Product•3 min read•2026-08-07
Options Chart That Matters: GEX, Walls, and Flow—Not a Pretty Candlestick
Looking for an options chart? Map gamma exposure, call/put walls, and same-session option flow in TradingFlow Rank—not just another price chart.
11 articles
Looking for an options chart? Map gamma exposure, call/put walls, and same-session option flow in TradingFlow Rank—not just another price chart.
Negative gamma narratives travel fast on social media. TradingFlow shows GEX regime, flip, walls, and same-session flow—with explicit snapshot horizons and no cascade guarantee.
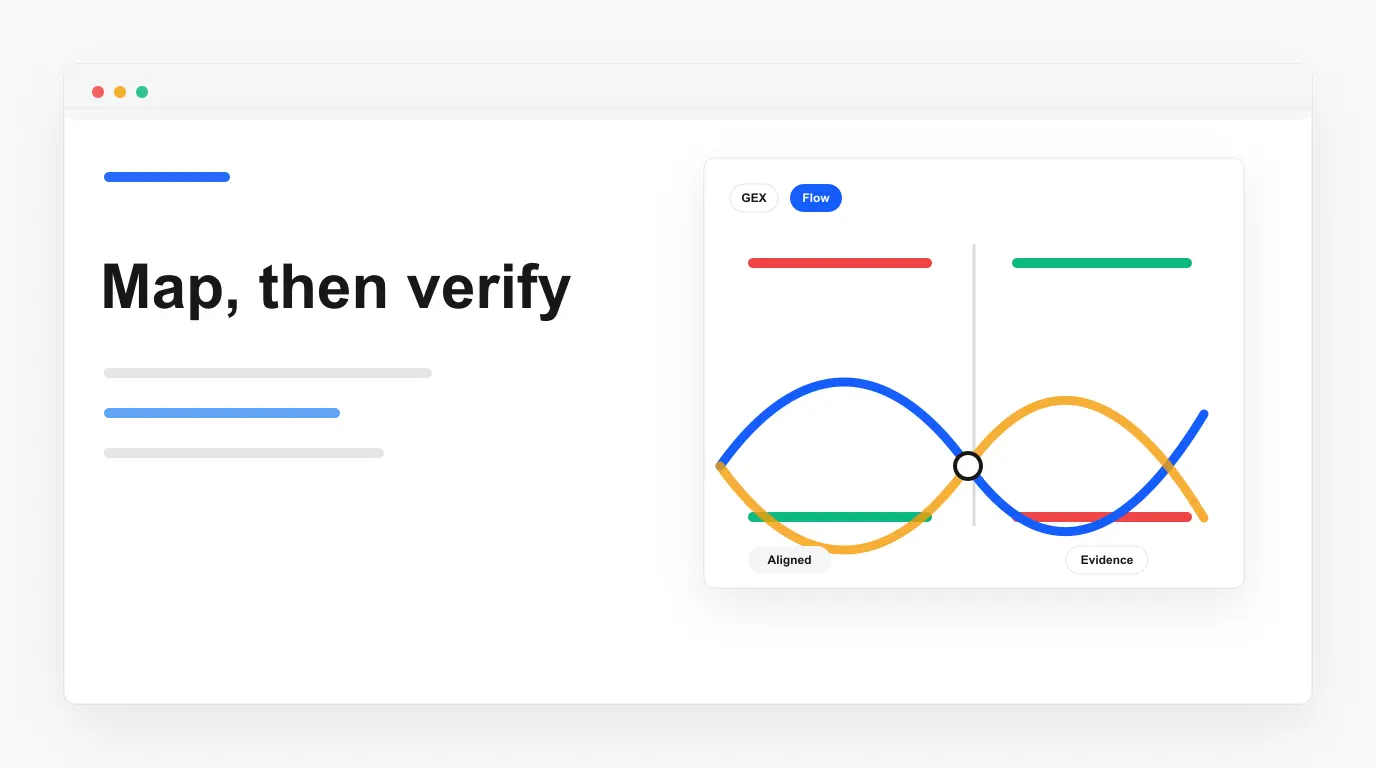
TradingFlow’s Session flow at mapped walls places same-session options flow beside canonical Call and Put GEX Walls, with transparent Flow-aligned, Flow-against, and Mixed flow verdicts.
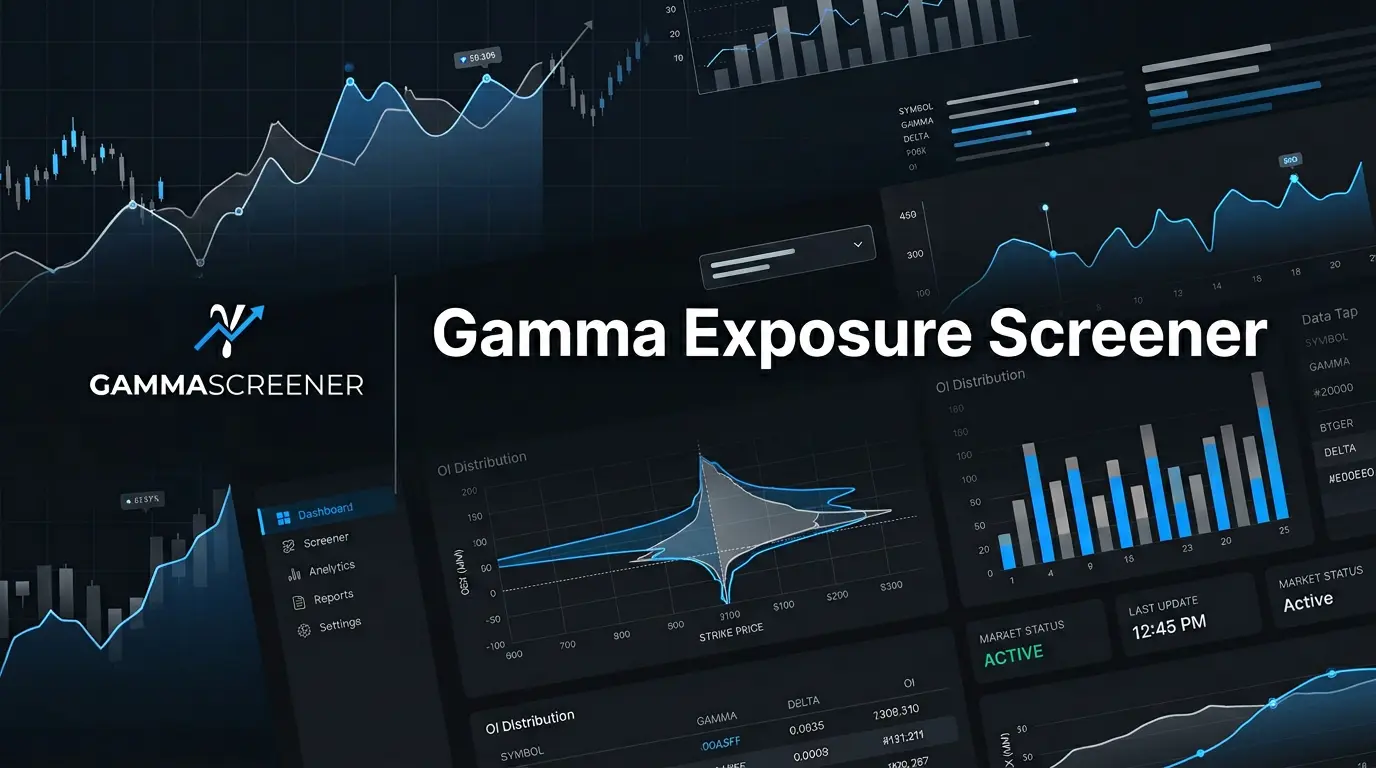
Use TradingFlow’s GEX scanner inside Rank Symbols for gamma exposure, call walls, put walls, volatility, OI, and option-chain context—after you rank options flow.

Rank Symbols on the completed September 9 session shows SPY closing 762.40 on the $762 0DTE put wall, under the $763 top. SPXW opened at the high, never retook it, and closed 7636.40 on the 7635 0DTE top. Both books were negative.

Four Rank sessions, one corridor. SPY closed 761.60 on September 1, sat on 765 then 773, and finished the week on the $770 0DTE top. SPX tagged 7757 Thursday and closed Friday under 7720. Friday GEX was negative, and 0DTE was 42.9% of SPY gross.

Rank Symbols on the completed September 3 session shows SPY tagging the $774 0DTE call wall and closing on the $773 top. SPXW 0DTE ran to 7757, then sat under the 7750 top. GEX is prior-close structure (T+1); the OHLC is the session.

Rank Symbols on the completed September 2 session shows SPY closing on the $765 put wall. SPXW 0DTE tagged 7681, then sat on the 7670 top. GEX is prior-close structure (T+1); the OHLC is the session.