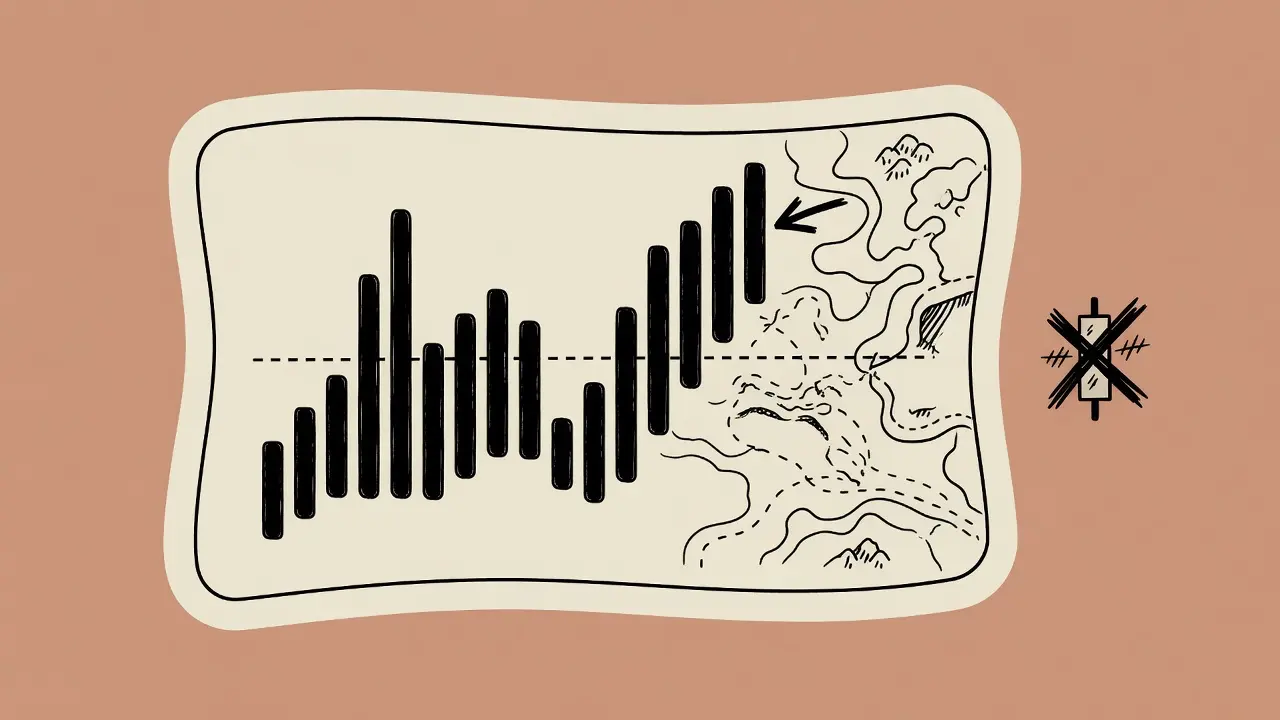
Options Chart That Matters: GEX, Walls, and Flow—Not a Pretty Candlestick
Looking for an options chart? Map gamma exposure, call/put walls, and same-session option flow in TradingFlow Rank—not just another price chart.
Searchers who type options chart, option charts, or option chart often want two different things:
- A price chart of the underlying (or an option series)
- An options structure chart—open interest / gamma by strike, walls, and regime—so positioning is visible
TradingFlow optimizes the second job. We are not a candlestick clone. We are a rank → tape → structure desk: option flow on the tape, gamma exposure and call / put walls on the map.
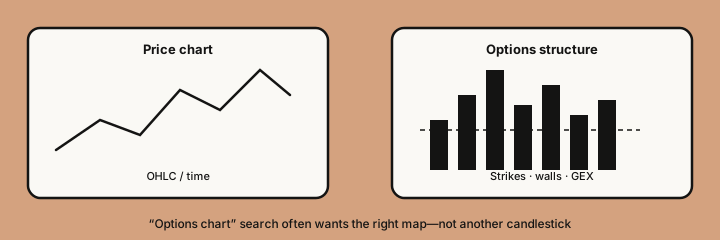
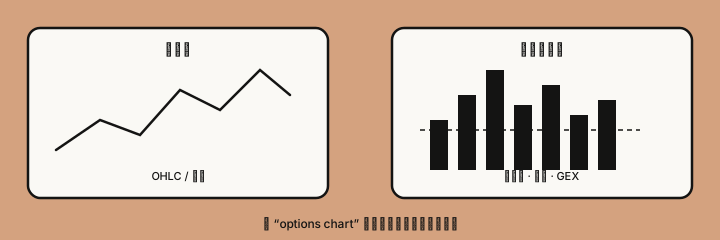
Left: time and price. Right: strikes and mass (OI/gamma). “Options chart” SEO often maps to the right panel.
What a useful options structure chart shows
| Element | Why it matters | Where in TradingFlow |
|---|---|---|
| Strike axis | Where risk is stacked | Rank Symbols → Chain / GEX profile |
| Call vs put mass | Asymmetry of positioning | GEX walls + chain OI |
| Regime | Dampen vs amplify backdrop | GEX tab (positive/negative language) |
| Same-session flow | Did size trade the map today? | Option Trades + Flow evidence |
If a tool only paints heat without a reproducible tape recipe, you still cannot audit a social claim. That is why we link structure to Option Trades.
Open the structure chart in Rank Symbols
Start at Rank Symbols—session ranking before you fixate on one chart.
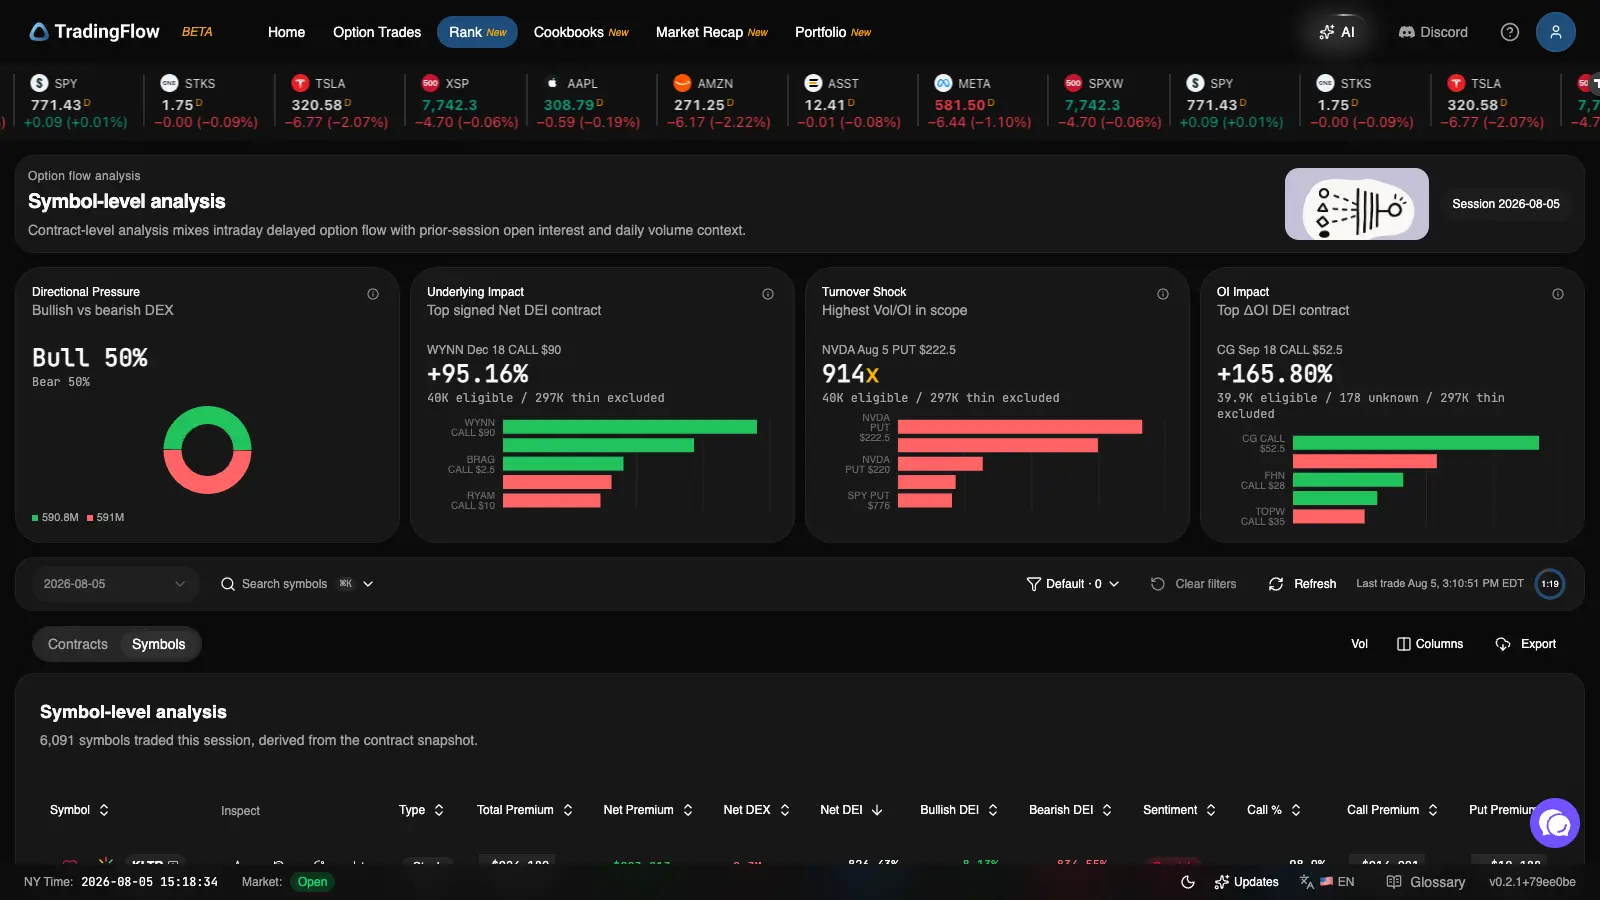
Market-level start: which underlyings matter this session before drilling a single structure chart.
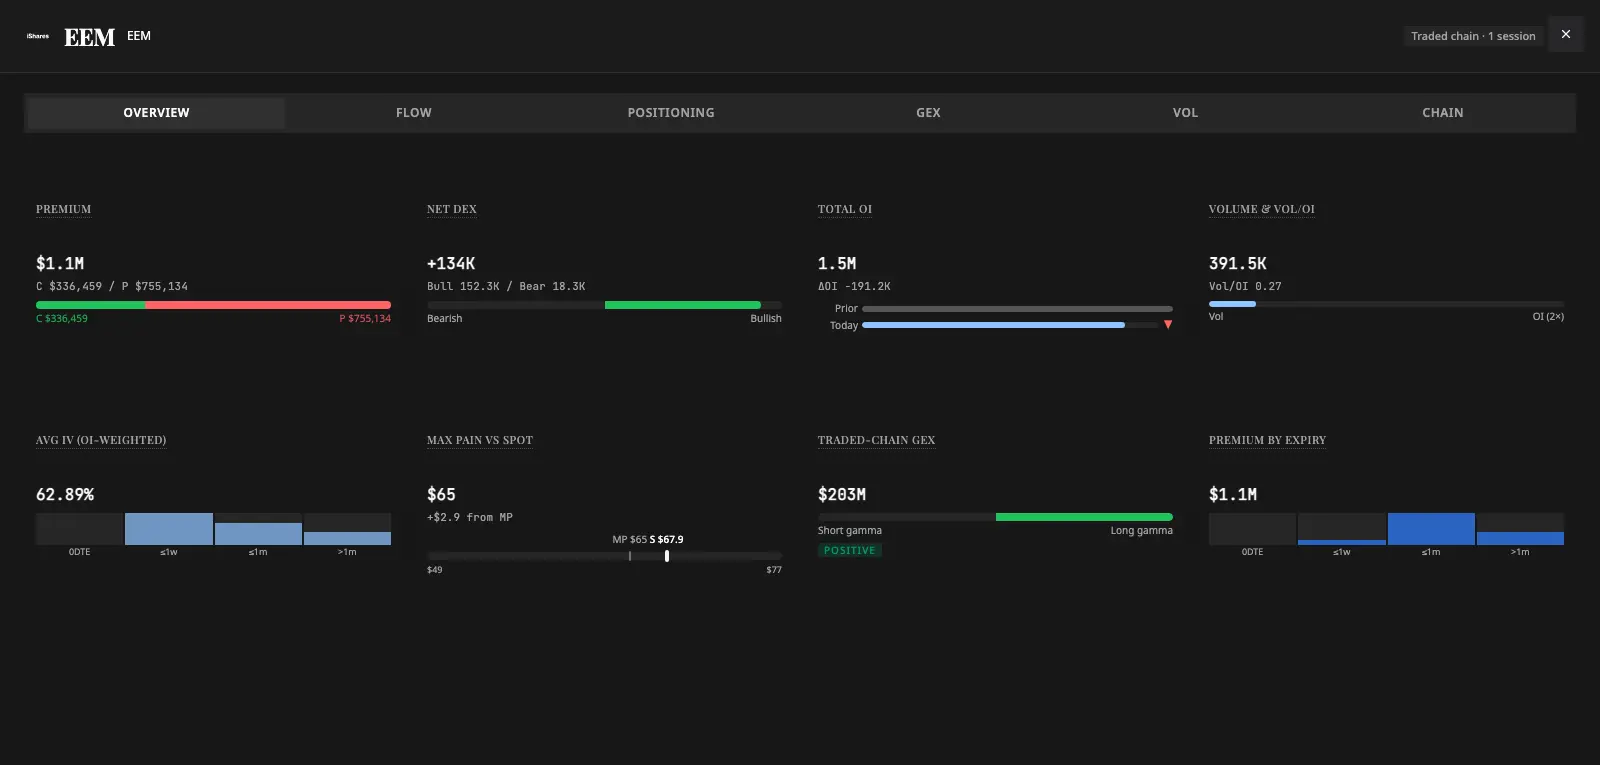
Select a symbol (example workflow: SPY / SPXW), open Open symbol drawer, then Gamma Exposure (GEX):
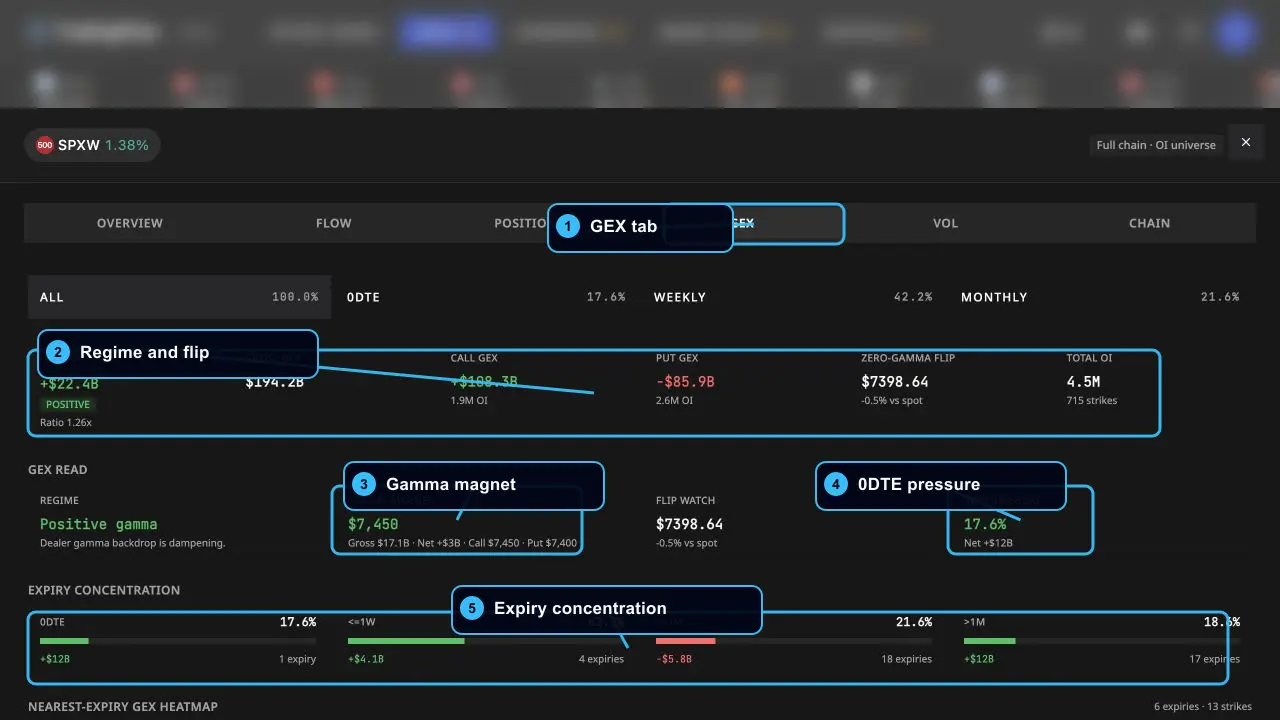
This is the options structure view: regime, flip, magnets, call/put walls, and strike profile. Snapshot timing is part of the evidence.
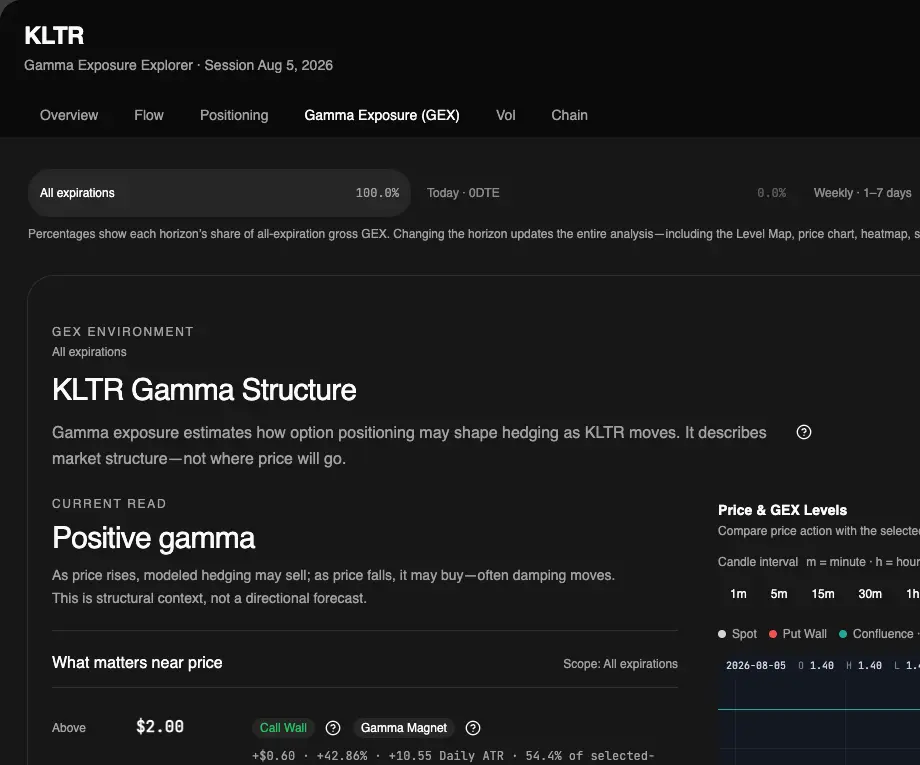
Product capture of the GEX drawer. Values are session-specific; layout is what readers reproduce on app.tradingflow.com after sign-in/entitlements.
Switch to Chain for the ladder:
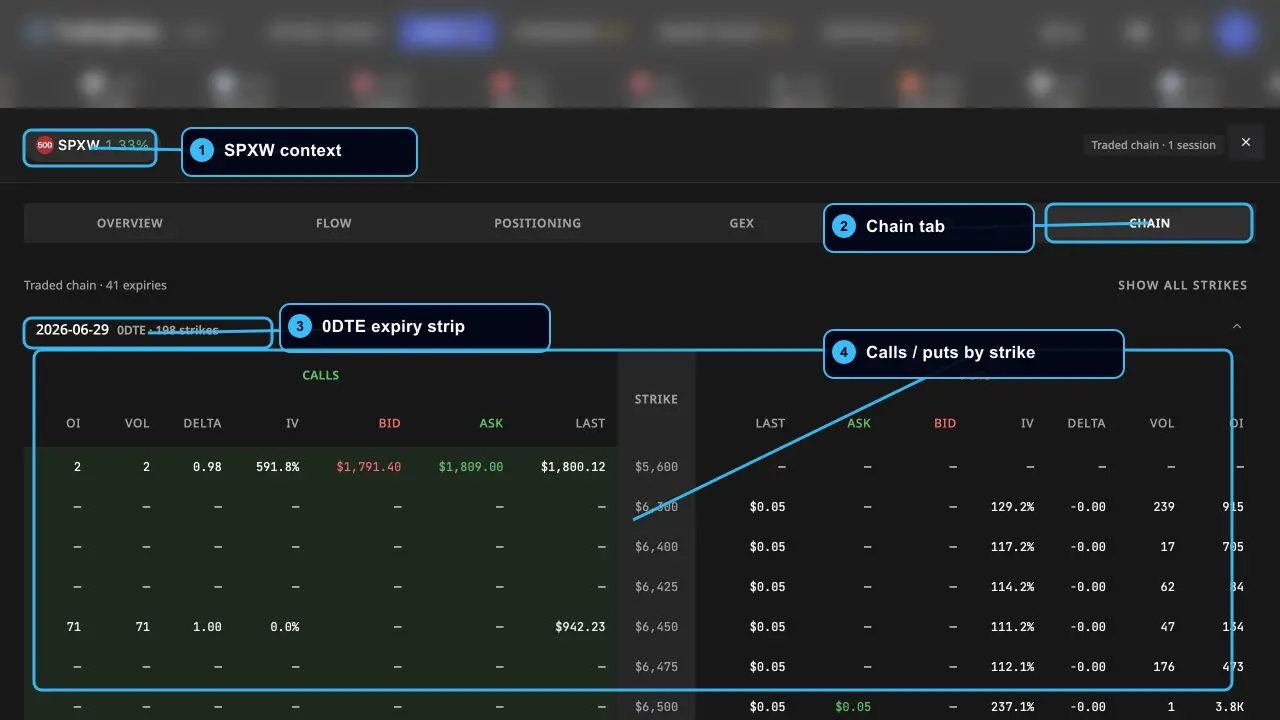
Strike ladder with OI/volume context—closer to a classic “chain chart” than a candlestick.
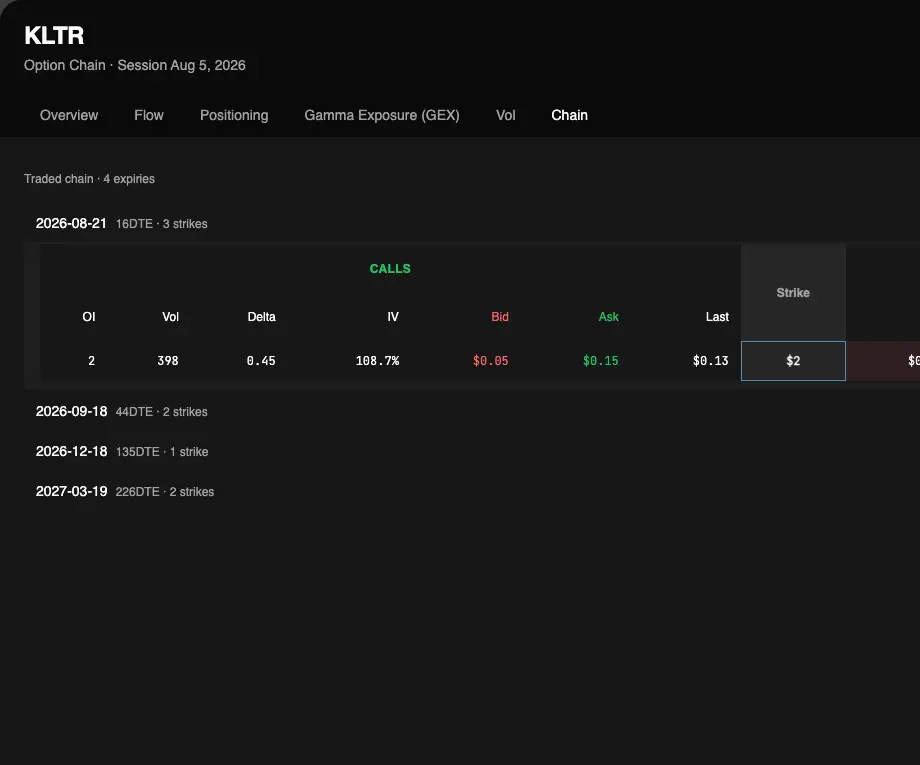
Chain-tab crop: expiries and strikes you can match to a price chart elsewhere.
Public links: SPY GEX · SPY Chain via drawer (use Open symbol drawer if deep-link state does not restore).
For multi-symbol scanning language, see the product guide: GEX scanner & screener.
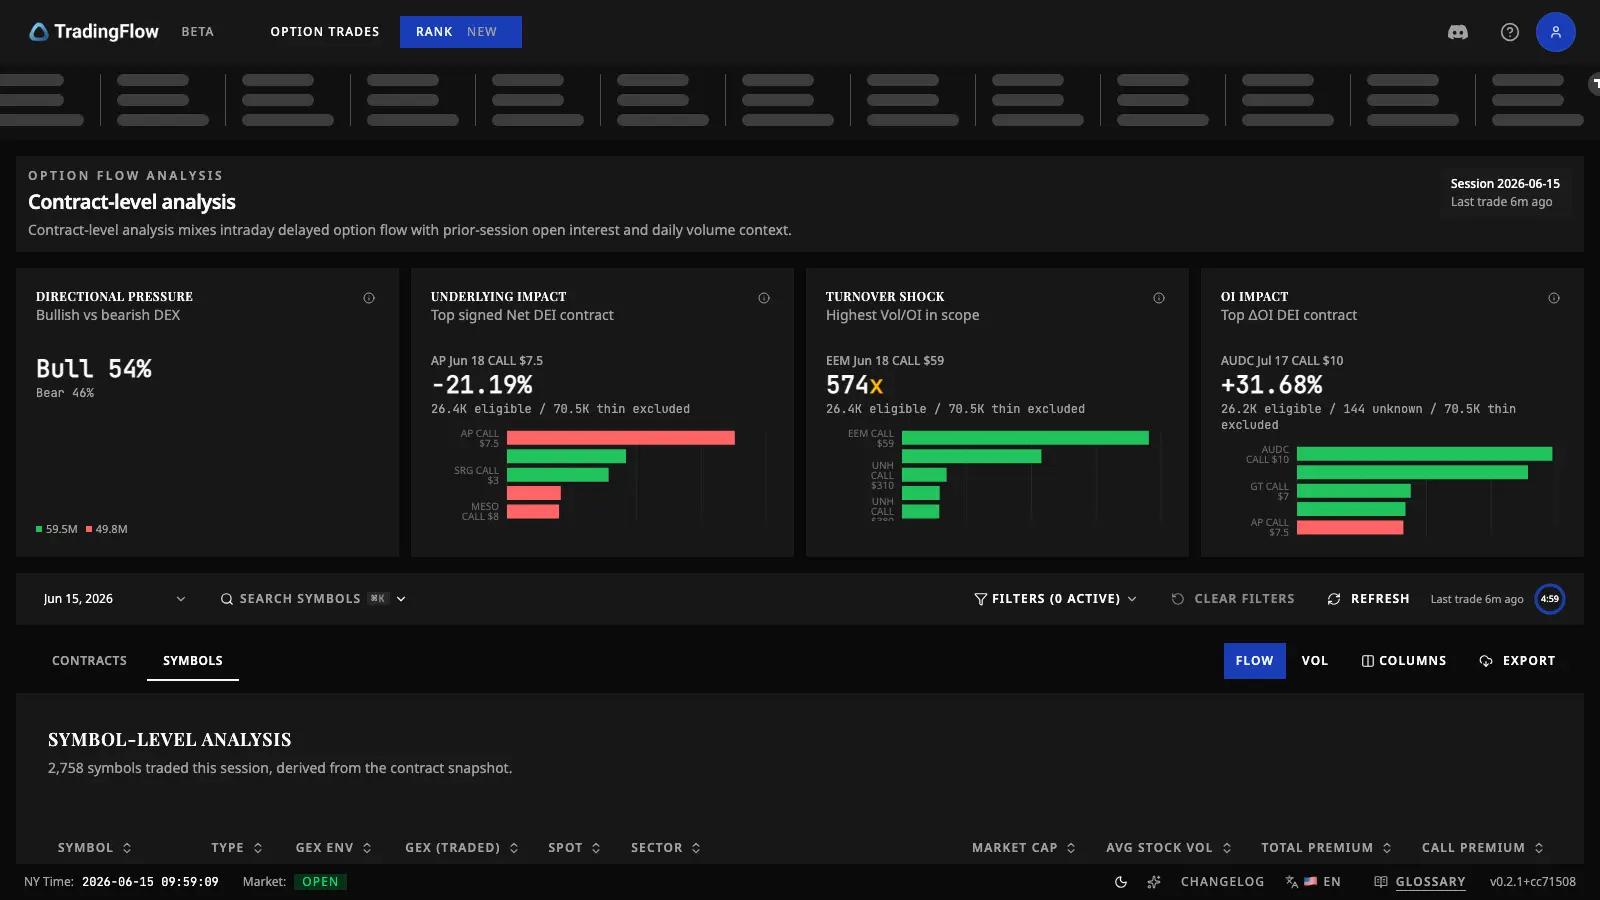
Rank-oriented GEX scanning is the product surface for “which names have interesting structure charts today?”
Drawer-level structure read aligns with the same Rank Symbols workbench used in evidence posts.
Heatmaps vs structure maps
Competitors sometimes win traffic with options heat maps. TradingFlow’s public educational stance:
- We prioritize GEX / walls / chain maps you can pair with a filter recipe on the tape
- A colorful heat layer without print-level audit is not our product promise
- When you need flow at walls, use GEX Flow Evidence
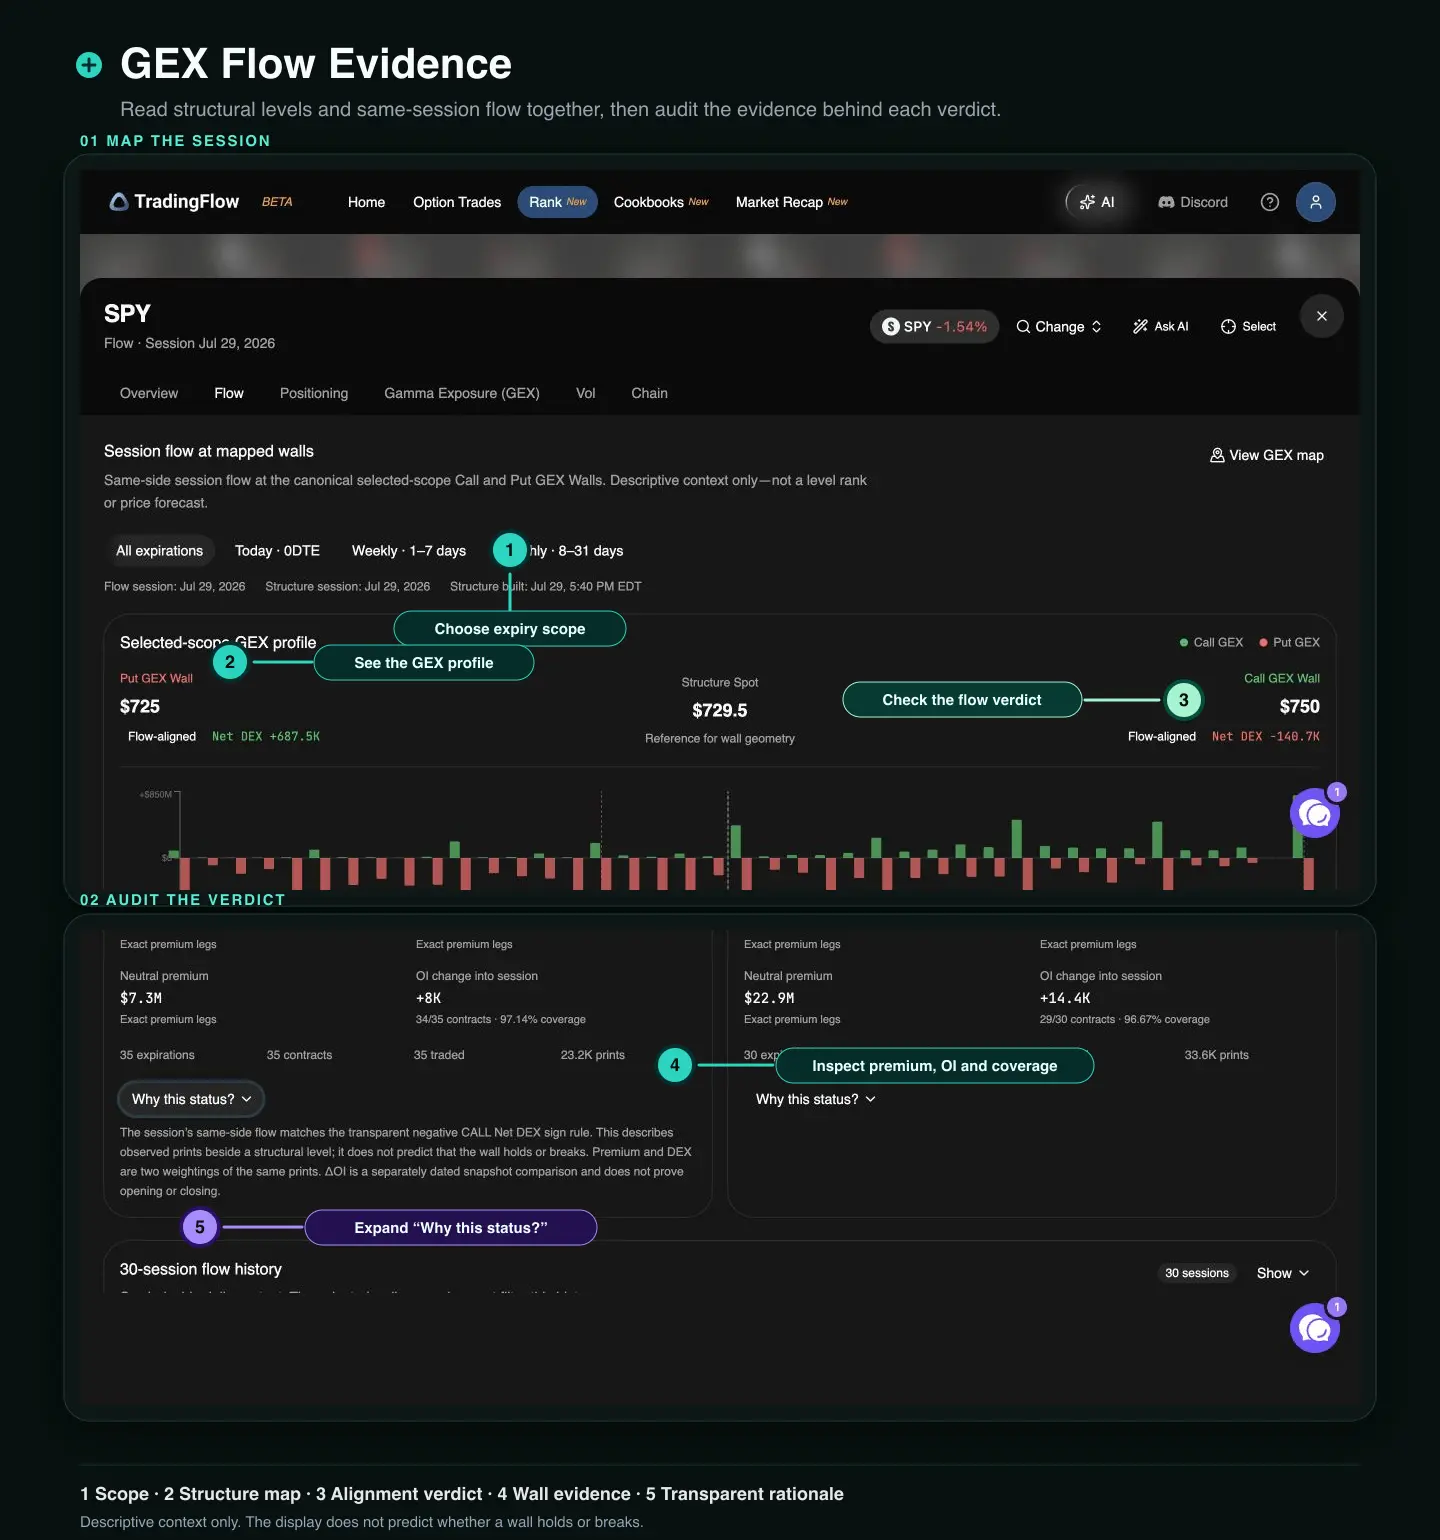
Structure chart + tape: flow-aligned / against / mixed at walls—still not a trade signal by itself.
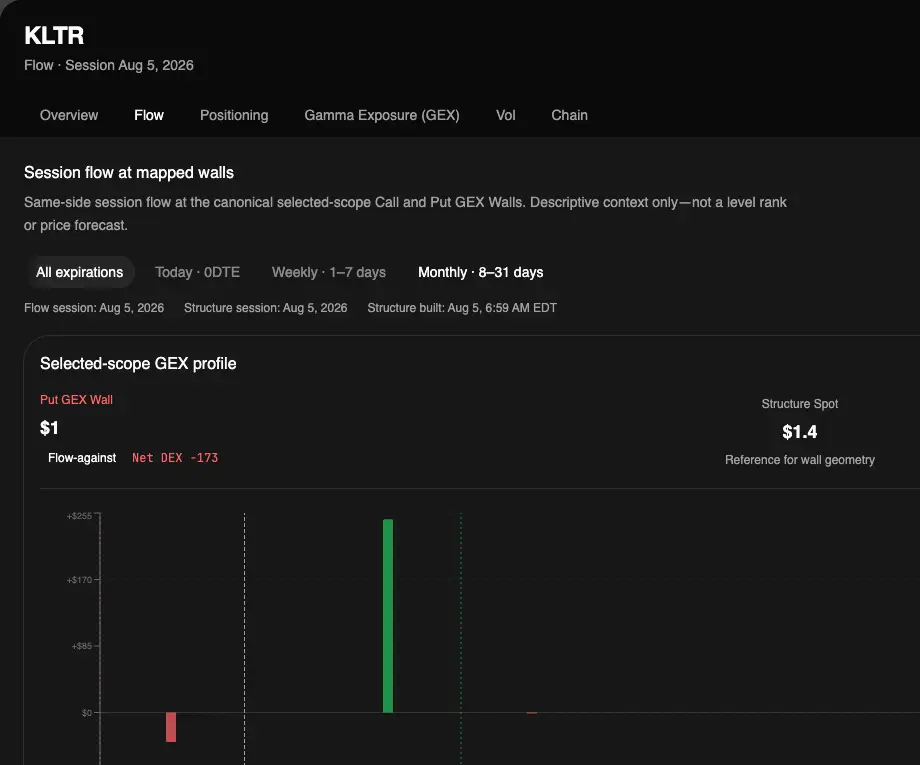
Load flow evidence after the structure map is clear.
Confirm with the tape (not the chart alone)
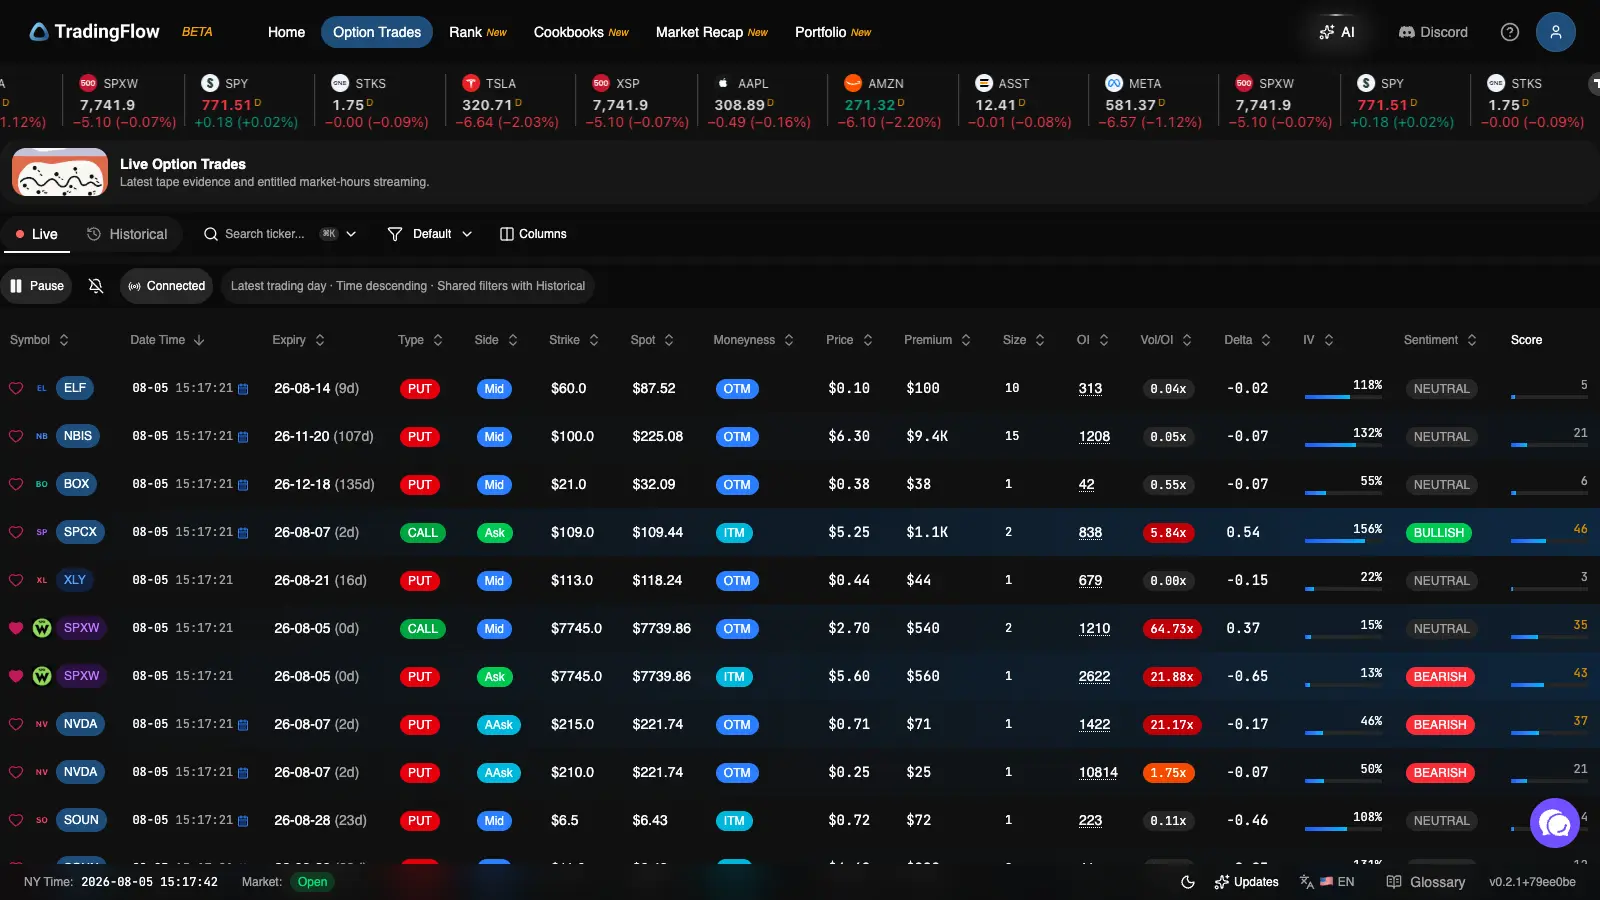
Structure without prints is a pretty map. Prints without structure are a firehose.
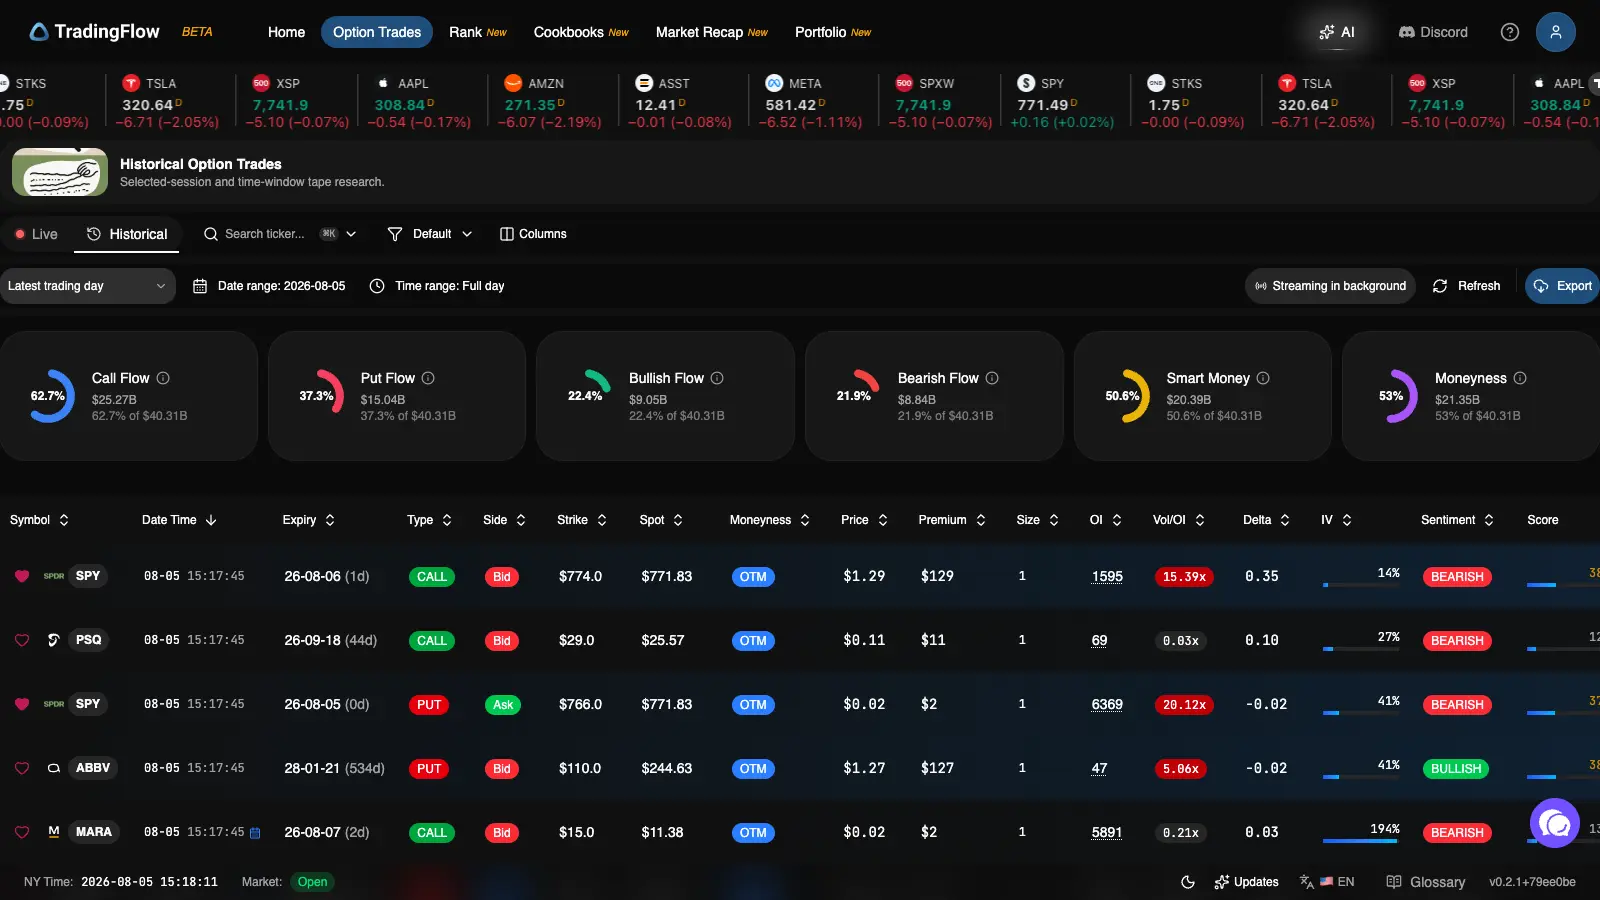
Historical mode for dated claims: lock New York date/window, symbol, strikes.
Full loop philosophy: Why alerts alone fail—Rank → tape → structure.
How this compares commercially
If you are shopping tools, fair dimensions live here—not brand bashing:
Related posts
- GEX scanner
- Option Chain Analysis
- GEX Flow Evidence
- Call walls, put walls, pin
- Max pain vs walls
- 0DTE evidence loop
Learn more
- Gamma exposure · Call wall · Put wall
- Option flow · Open interest
- Rank Symbols tutorial
- Option chain and OI
- Greeks and GEX
- Option Trades tutorial
Open the app
TradingFlow App Home → Rank Symbols (structure) → Option Trades (tape) on one symbol today.
Educational product demonstration only—not investment advice. Options involve substantial risk of loss.
Related Articles
GEX Flow Evidence: Read Session Flow at Mapped Walls
TradingFlow’s Session flow at mapped walls places same-session options flow beside canonical Call and Put GEX Walls, with transparent Flow-aligned, Flow-against, and Mixed flow verdicts.
GEX Scanner & Screener: Gamma Exposure, Call Walls & Put Walls
Use TradingFlow’s GEX scanner inside Rank Symbols for gamma exposure, call walls, put walls, volatility, OI, and option-chain context—after you rank options flow.
Max Pain Is Not a Pin Forecast: Walls, GEX, and the Tape
Max pain theory is a popular expiration narrative. TradingFlow maps OI walls and GEX next to same-session flow so you do not trade a single pin number blind.