
IV30 vs RV20: See Implied and Realized Volatility Side by Side
TradingFlow Rank Symbols now compares IV30 with RV20 and RV30, adds a signed IV30−RV20 spread, and preserves the separate dates behind each measure.
IV30 vs RV20 is now a first-class comparison in TradingFlow Rank Symbols. The new volatility view places IV30, RV20, RV30, and the signed IV30−RV20 difference in the same table and symbol drawer, making it easier to see how forward-looking option prices compare with the volatility the underlying recently realized.
The important word is compare. A positive spread does not prove options are overpriced; a negative spread does not prove they are cheap. These measures look through different windows and answer different questions. TradingFlow keeps those boundaries—and the dates behind the data—visible.
Open TradingFlow Rank Symbols to follow the workflow described below.
What changed in Rank Symbols
The Rank Symbols table now exposes four sortable, filterable fields:
| Metric | What it measures | Display |
|---|---|---|
| IV30 | Forward-looking, 30-day at-the-money implied volatility | Annualized percentage |
| RV20 | Realized volatility across the latest 20 valid completed sessions | Annualized percentage |
| RV30 | Realized volatility across the latest 30 valid completed sessions | Annualized percentage |
| IV30−RV20 | IV30 minus RV20 | Signed volatility points |
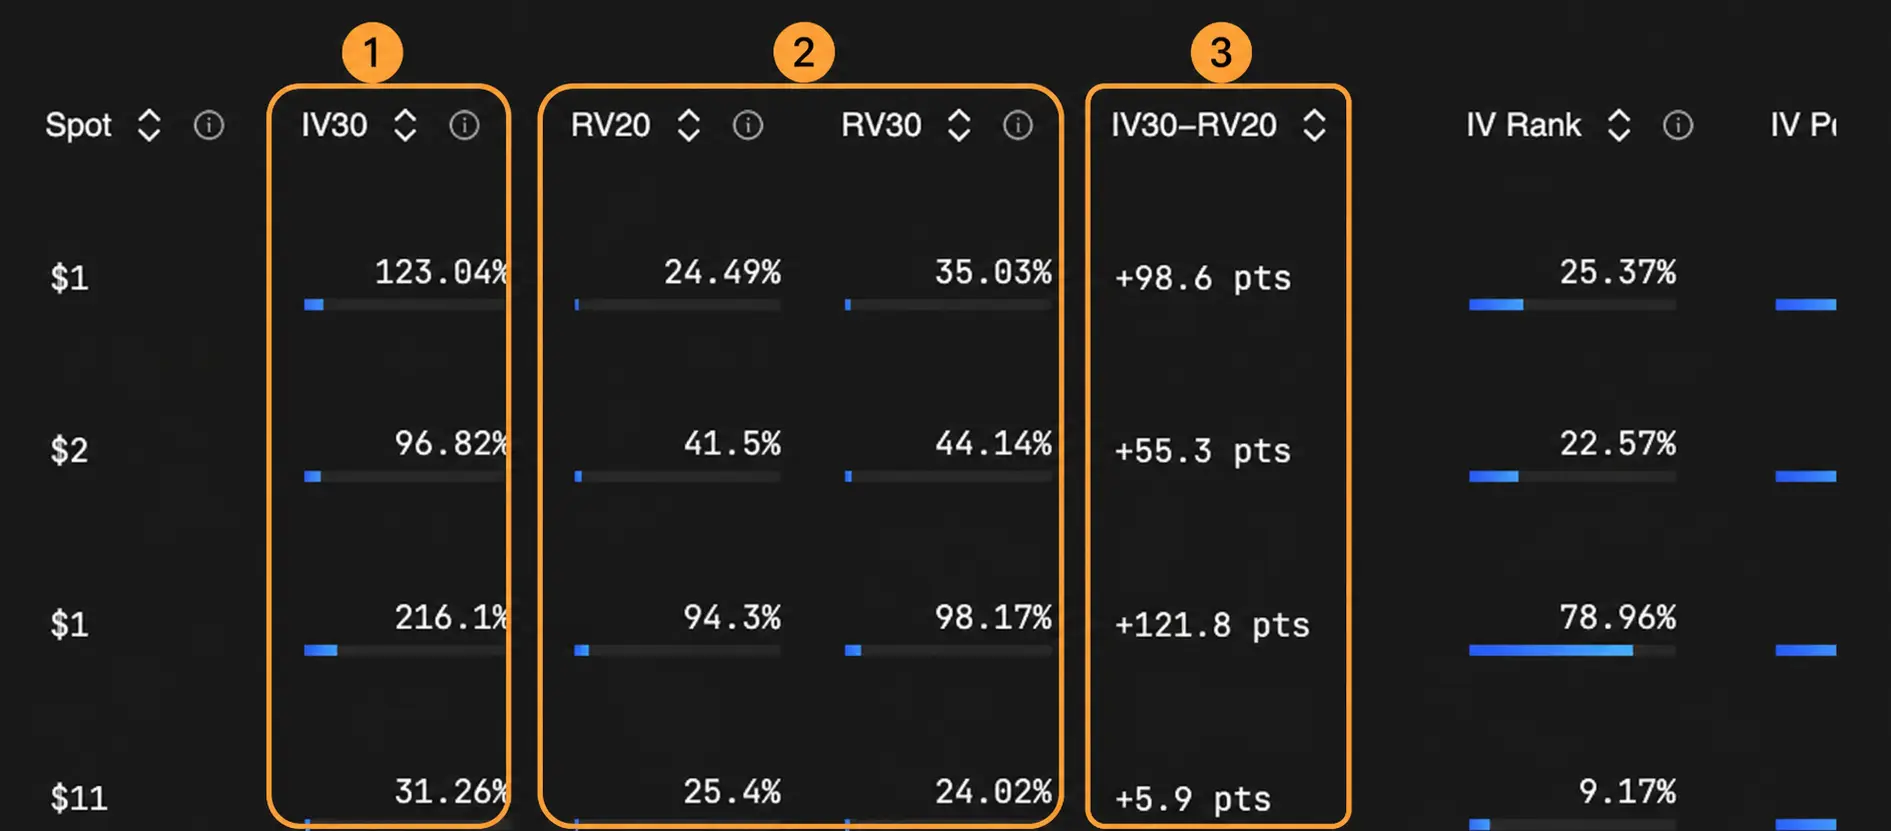
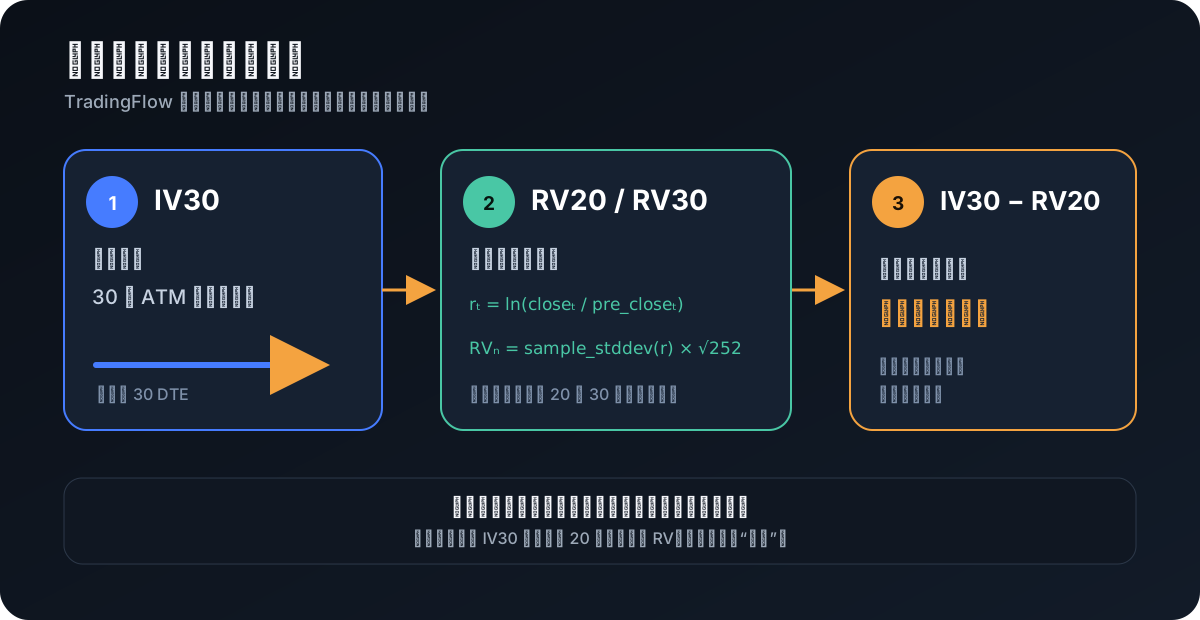
The cross-symbol table now brings the comparison into the discovery surface: 1) IV30, 2) RV20 and RV30, and 3) the signed IV30−RV20 difference. Values move with each new market snapshot.
The dedicated Vol presentation brings the four measures forward and removes unrelated flow columns from the default view. Paid Rank users can apply that preset, use numeric range filters, sort the spread, and preserve the setup in saved views. The selected-symbol Vol drawer keeps the headline values available for a focused structure read.
How TradingFlow calculates the comparison
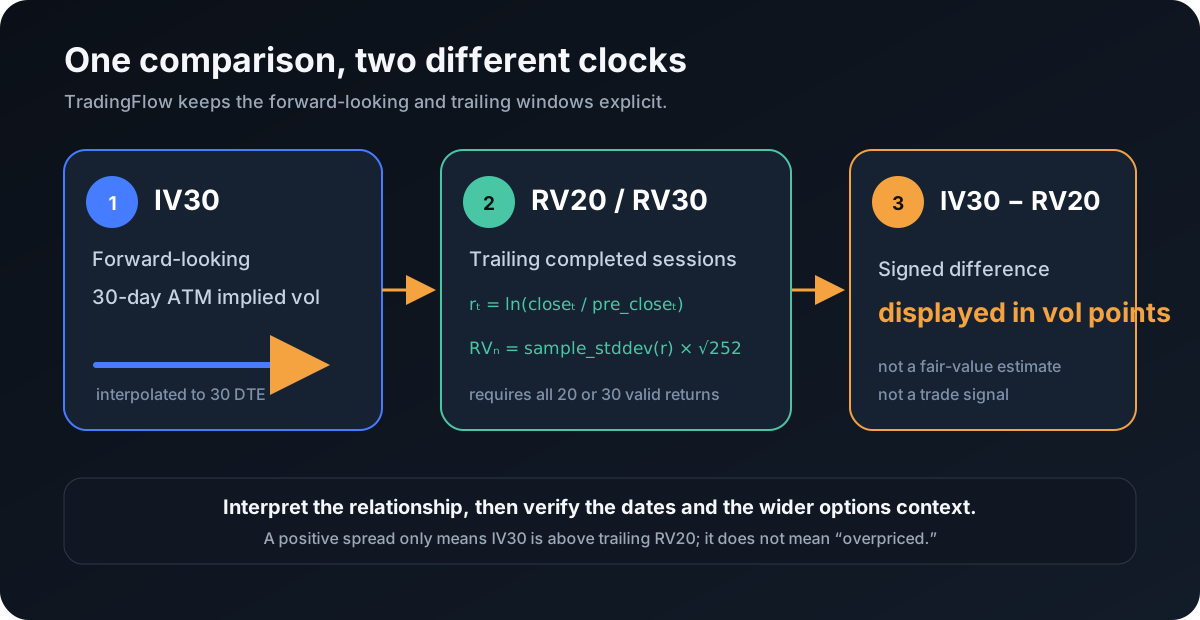
IV30: the option market’s forward-looking input
IV30 is TradingFlow’s 30-day at-the-money implied-volatility measure. For qualifying expirations, TradingFlow uses two-sided ATM call and put implied volatility, then interpolates between expirations to a 30-day horizon.
That makes IV30 forward-looking in construction: it reflects option prices and the market’s pricing of future uncertainty. It is not a forecast that the underlying will move by that amount.
If you need a refresher on how implied volatility fits with delta, gamma, and other option sensitivities, see the Greeks and GEX tutorial. You can also review IV Rank for a different question: where current implied volatility sits relative to its own history.
RV20 and RV30: what the underlying actually realized
RV20 and RV30 use completed trading sessions rather than option prices. For each valid session, TradingFlow computes the log return:
returnₜ = ln(closeₜ / pre_closeₜ)
It then takes the sample standard deviation of the latest 20 or 30 valid returns and annualizes the result with √252.
The full window is required. If TradingFlow cannot assemble all 20 or 30 valid observations, it returns no value instead of silently shortening the lookback. The table renders that missing state as —. A separate vendor “historical volatility” field is not relabeled or substituted for these RV measures.
This strict contract matters. It means RV20 always means the same completed 20-session calculation and RV30 always means the same completed 30-session calculation.
IV30−RV20: a relationship, not a verdict
TradingFlow calculates the spread only when both IV30 and RV20 are present:
IV30−RV20 = IV30 − RV20
The result is displayed in volatility points, not as a percent change. If IV30 is 31.3% and RV20 is 25.4%, the result is +5.9 points.
- Positive: IV30 is above trailing RV20.
- Near zero: the two annualized measures are at similar levels.
- Negative: IV30 is below trailing RV20.
None of those labels establishes fair value, mispricing, expected return, or trade direction. Earnings, event risk, skew, term structure, liquidity, and the mismatch between forward and trailing horizons can all explain the relationship.
A real symbol example: CANE
The screenshot below captures CANE from the Aug. 7, 2026 session in the current TradingFlow build:
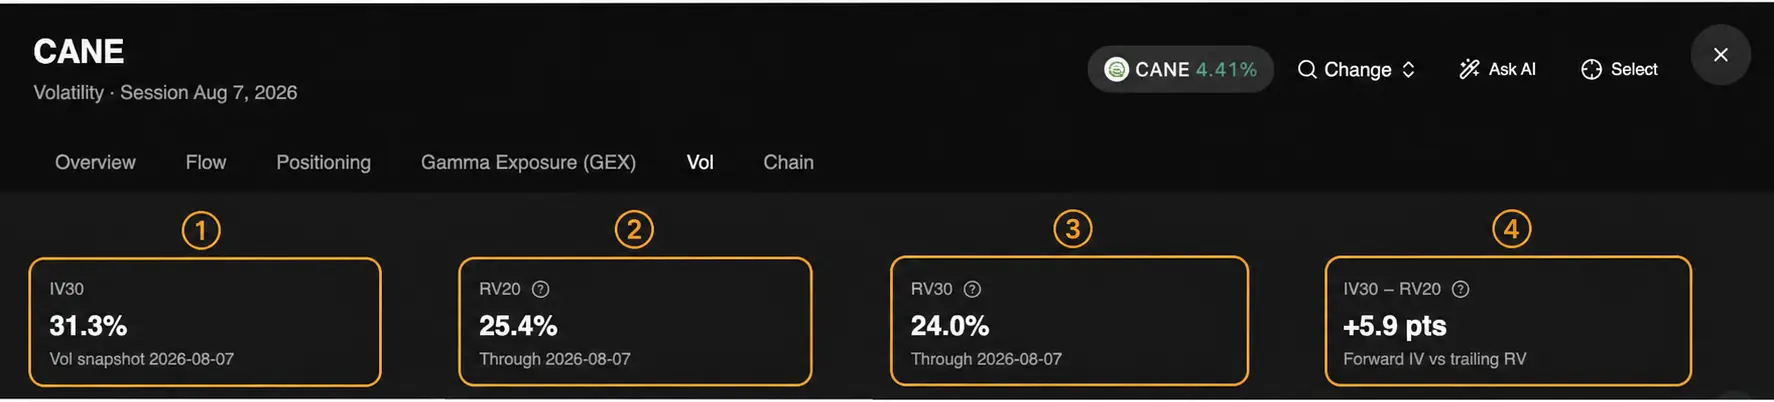
CANE example: 1) IV30 31.3% with its volatility snapshot date, 2) RV20 25.4% through Aug. 7, 3) RV30 24.0% through Aug. 7, and 4) a +5.9-point IV30−RV20 difference. This is a dated product example, not a recommendation.
Two details make the drawer more useful than an isolated spreadsheet column:
- IV and RV provenance stay separate. IV30 shows its volatility snapshot date; RV20 and RV30 show the last completed session included in their windows.
- RV20 and RV30 provide two trailing lenses. Here, RV20 is modestly above RV30, so the latest 20-session window realized slightly more annualized variation than the broader 30-session window. That is a historical description, not proof that volatility will continue rising.
To reproduce the workflow with live values, open CANE directly in the Vol drawer. The numbers and selected session will update as new snapshots arrive.
A practical IV vs RV research workflow
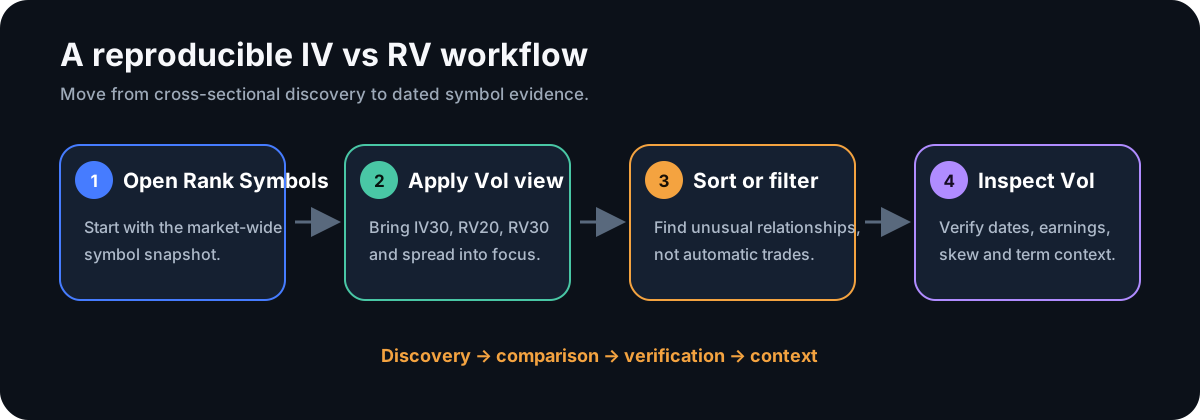
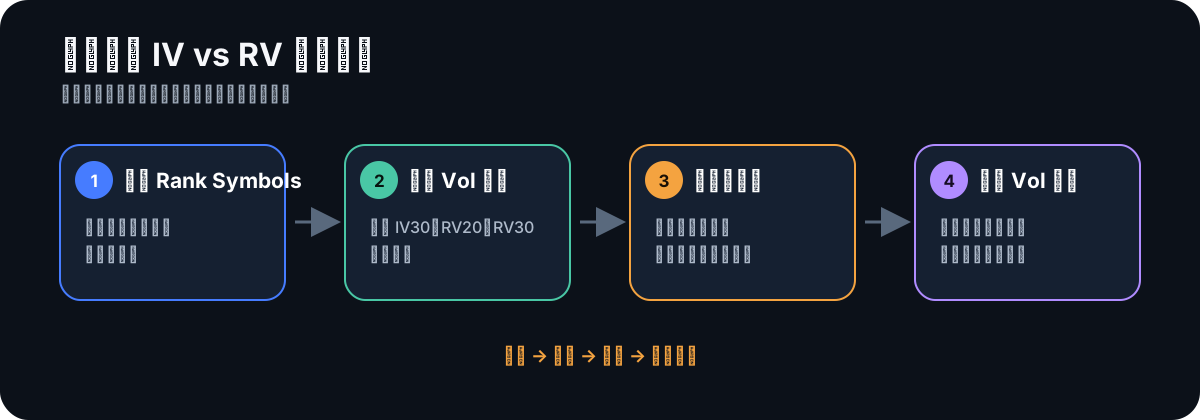
1. Start with the cross-section
Open Rank Symbols and use the Vol presentation to bring IV30, RV20, RV30, and the spread together. Sort or filter a metric to find relationships worth inspecting.
Large positive or negative spreads are investigation candidates—not automatic entries. Extremely high IV can be justified by an upcoming event; unusually high RV can follow a one-off move that the option market does not expect to repeat.
2. Compare RV20 with RV30
The two realized-volatility windows add recency context:
- RV20 above RV30 means the more recent 20-session window was more volatile on an annualized basis than the broader 30-session window.
- RV20 below RV30 means the recent window was calmer than the broader one.
This comparison does not identify the cause. Open the underlying’s chart, recent news, earnings calendar, and options structure before forming a thesis.
3. Open the Vol drawer and verify the clocks
Select a symbol, open Vol, and confirm the IV snapshot date and RV through-date. If either input is unavailable, TradingFlow shows — rather than inventing a comparison.
The drawer also keeps IV Rank, IV Percentile, skew, and term context nearby. Those fields answer different questions; they should support the read rather than be collapsed into one score.
4. Turn the comparison into a better question
Useful follow-up questions include:
- Is the spread concentrated around a known earnings or macro event?
- Does the term structure show that the premium is isolated to one expiration?
- Is skew assigning more price to downside or upside protection?
- Is RV20 diverging materially from RV30 because of a recent gap or sustained movement?
- Is there enough options liquidity to treat the displayed IV as actionable context?
This is where a volatility screener creates value: it reduces a large market into a manageable research list while keeping the evidence inspectable.
What this feature deliberately does not claim
TradingFlow does not treat IV30−RV20 as:
- an options “cheap/expensive” verdict;
- a probability that volatility will rise or fall;
- a dealer-position or investor-intention signal;
- a substitute for event, liquidity, skew, or term-structure analysis;
- a recommendation to buy or sell volatility.
The feature is a descriptive comparison between a forward option-market measure and trailing underlying-price measures. That narrower definition makes the output more reusable—and more honest.
Start comparing implied and realized volatility
The addition of RV20, RV30, and IV30−RV20 turns Rank Symbols into a more complete volatility discovery surface. You can scan the market, preserve a view, inspect one symbol, verify each clock, and then move into deeper options research without leaving the same workflow.
Open TradingFlow App Home or go directly to Rank Symbols to compare live IV30 and RV data.
Educational market-data analysis only; not investment advice. Volatility values and availability change with source data and market snapshots.
Related Articles
Direction Can Be Right and Calls Still Lose: The July-August Single-Name IV Crush
Frank trading's August 17 note said mid-July to mid-August was a crowded dispersion unwind, not a routine earnings crush. Rank Symbols shows the same regime on SPY, MSFT, AMZN, and NVDA.
A Five-Box Daily Vol Note, Written on SPY
张无忌wepoets publishes the same five boxes every day: gamma pin, skew, VRP, expiry OI, and a named print. This article follows that 冰火岛 note, then fills the boxes on SPY in Rank Symbols and on the tape.
We Verified the Viral $7M Memory Put Trade. The Tape Needs Context.
TradingFlow’s historical option tape matches the six contracts and $422,135 gross premium in a viral memory-stock put post—but not its one-month, 40%-drop narrative.