
Direction Can Be Right and Calls Still Lose: The July-August Single-Name IV Crush
Frank trading's August 17 note said mid-July to mid-August was a crowded dispersion unwind, not a routine earnings crush. Rank Symbols shows the same regime on SPY, MSFT, AMZN, and NVDA.
On August 17, 2026, Frank trading (@Franktradinglog) posted a long note on X. It expands an August 11 line that single-name vol had already been sold hard. This article follows that August 17 note in the same order, then puts the parts Rank Symbols can measure next to the August 14, 2026 session.
VIX is back at 14-15 this week, so it is easy to treat volatility as a closed subject. Look at mid-July through mid-August instead. Single-name implied volatility did not merely crush after earnings. A crowded dispersion book reversed. That stretch matters for how you hold options next.
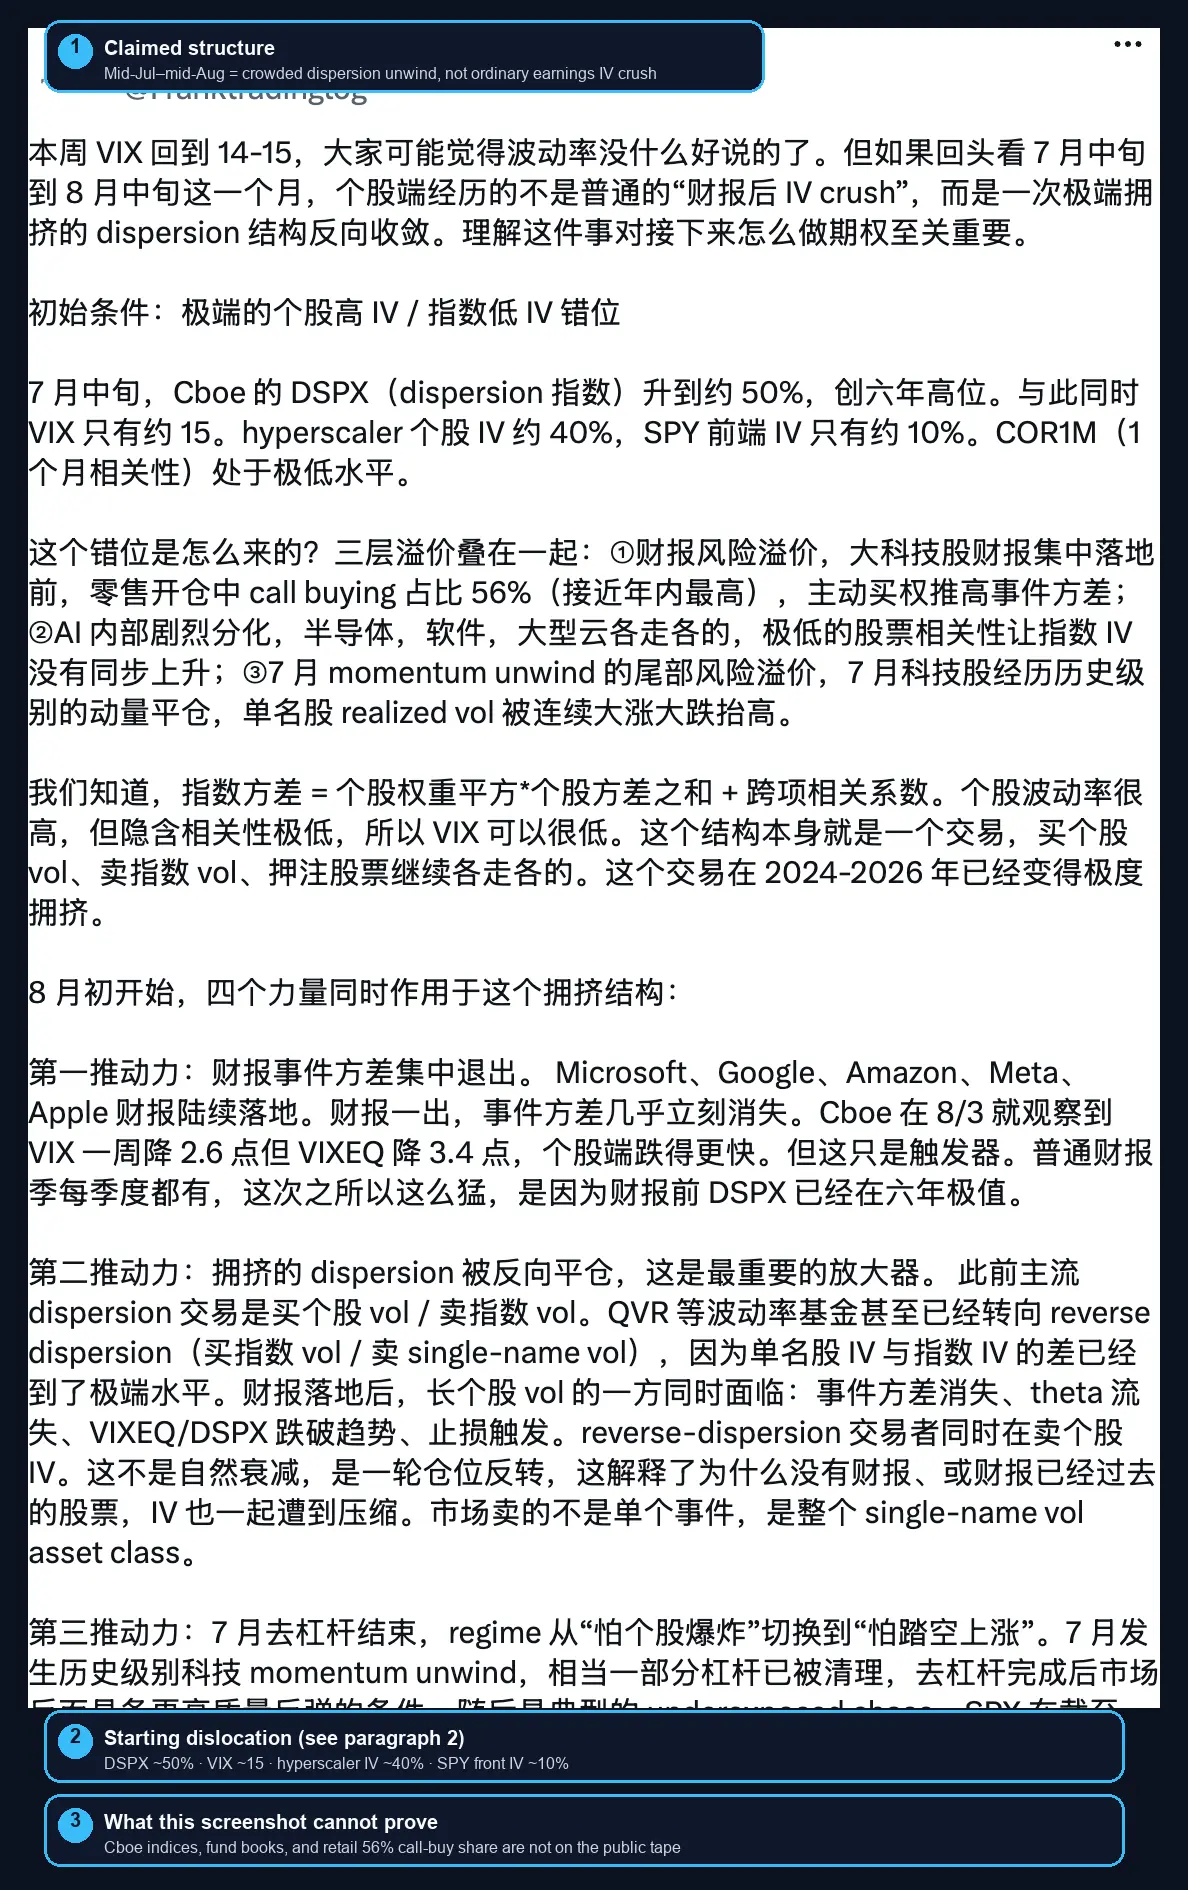
Original post from Frank trading (@Franktradinglog), captured August 17, 2026. Callout 1 keeps the claimed regime: a crowded dispersion unwind, not a routine earnings crush. Callout 2 marks the mid-July starting dislocation. Callout 3 marks what a social post cannot prove on its own: Cboe proprietary indices, named fund books, and a 56% retail call-buy share.
TradingFlow cannot reprint Cboe DSPX, COR1M, or VIXEQ, and it cannot see a volatility fund's book. It can put IV30 next to trailing realized volatility on a dated Rank session. Readers with access can start from SPY in the Vol drawer and change the date to August 14, 2026.
Initial conditions: single-name IV high, index IV low
The note's starting snapshot, dated mid-July:
- Cboe DSPX near 50%, a six-year high
- VIX near 15
- Hyperscaler IV near 40%
- SPY front-end IV near 10%
- COR1M (one-month implied correlation) extremely low
Those Cboe prints are the original post's numbers. Rank does not carry DSPX or COR1M. What it does show, on the completed August 14 session, is that the index side was already quiet.
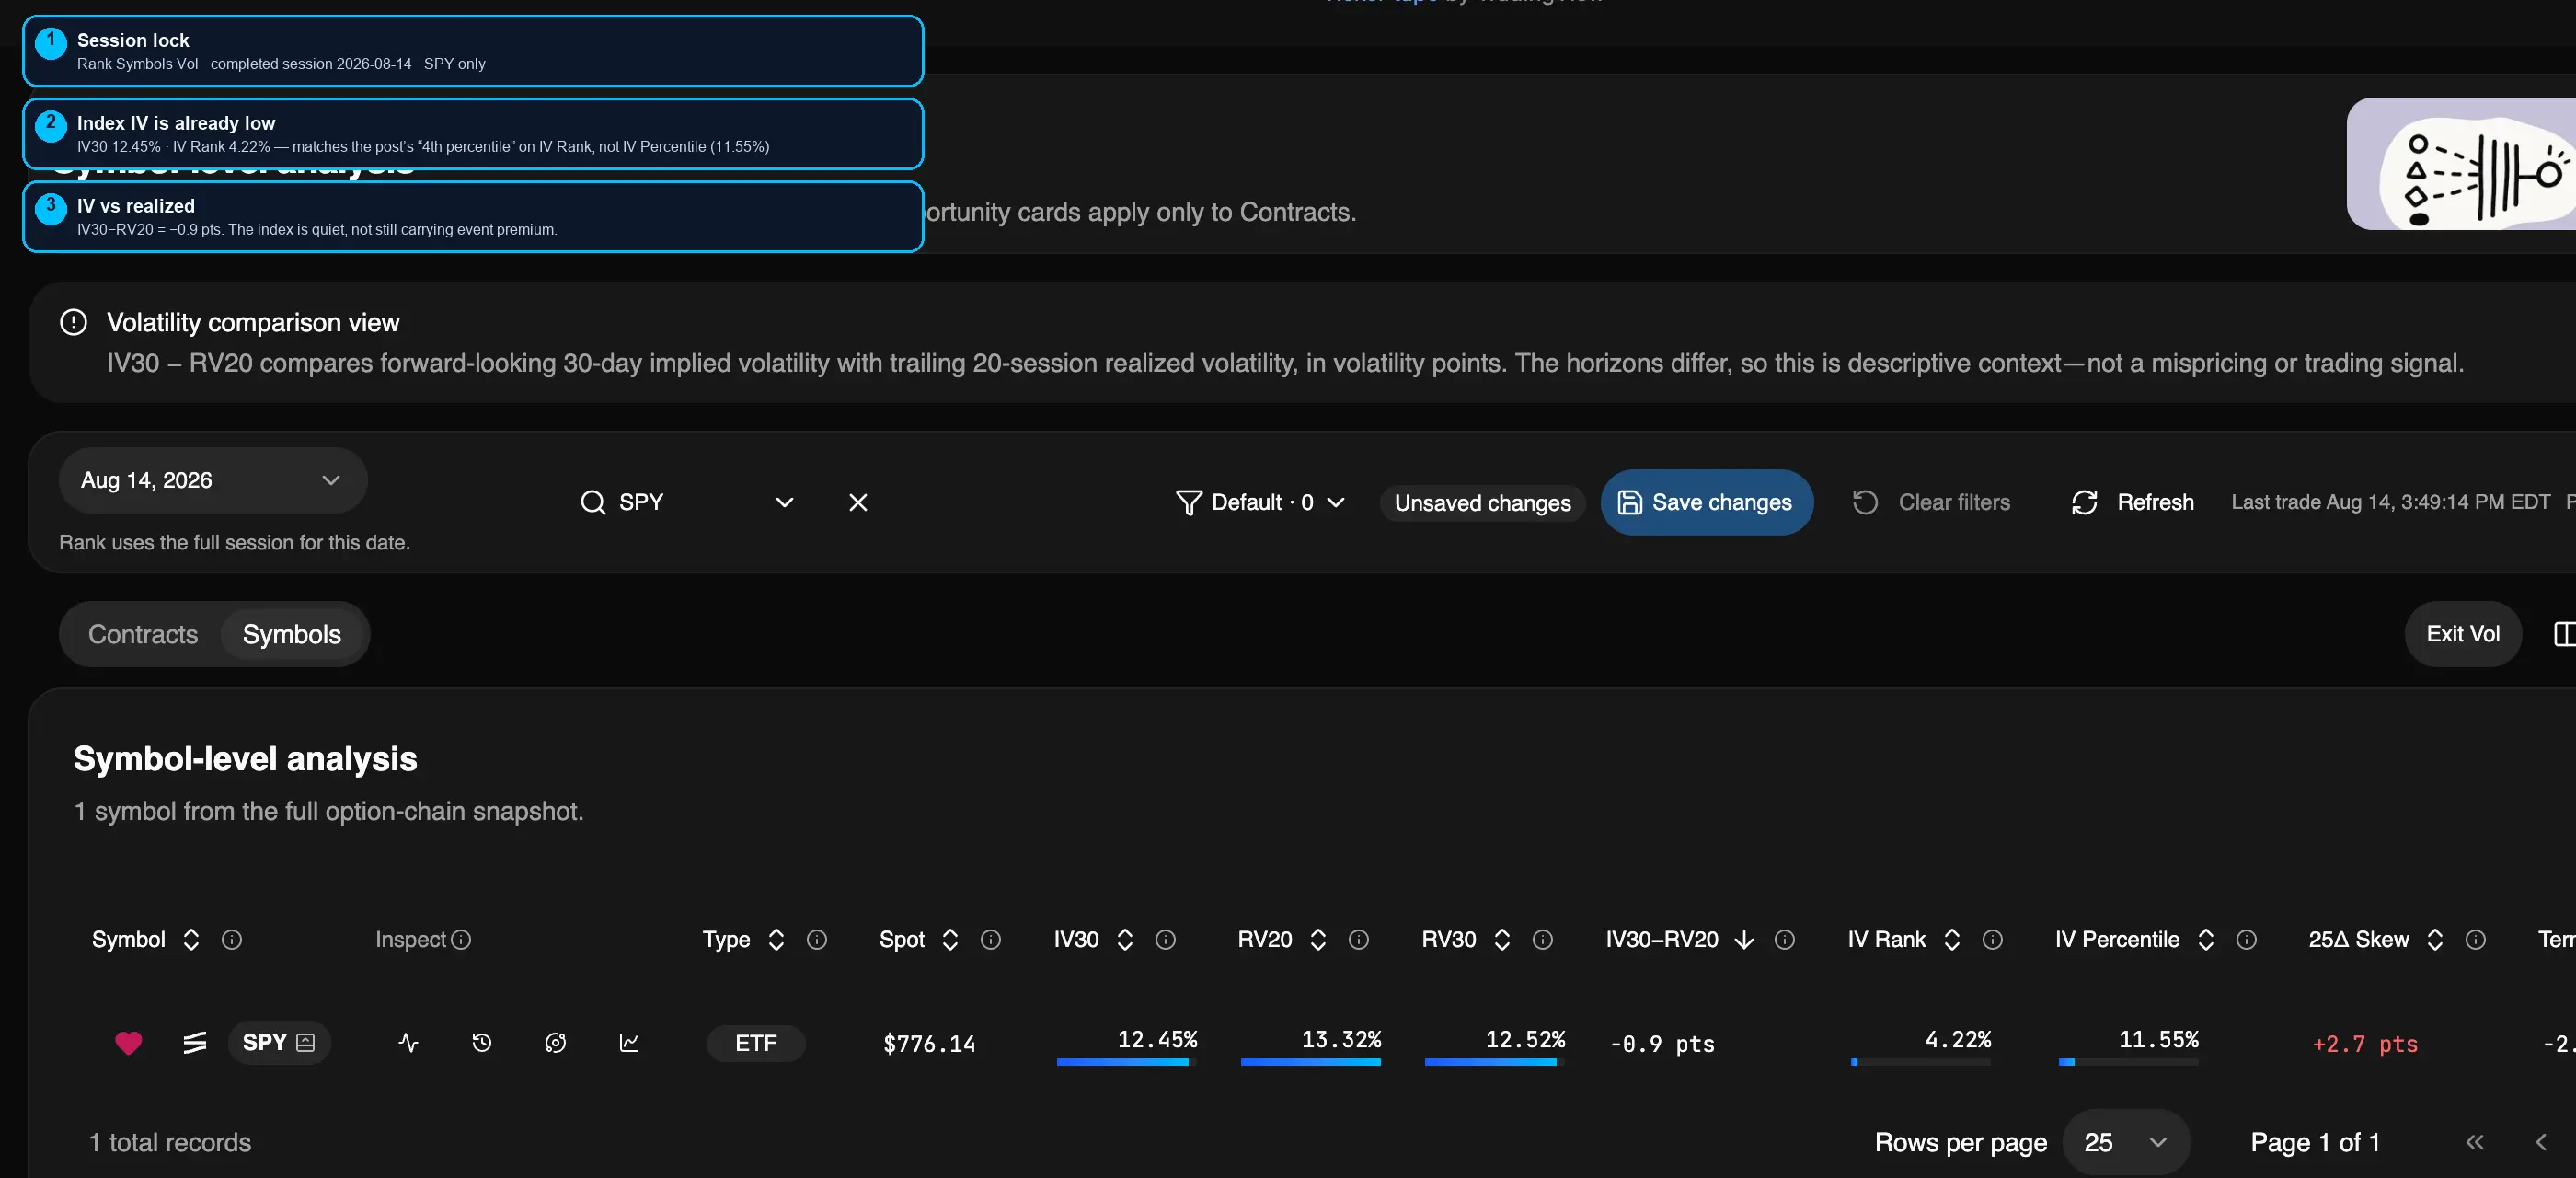
Authenticated test-environment capture of Rank Symbols Vol for SPY on the completed August 14, 2026 session. Callout 1 locks the date and the Vol presentation. Callout 2 isolates IV30 12.45% and IV Rank 4.22%. Callout 3 notes IV30−RV20 at −0.9 points. This is a dated snapshot, not a live quote.
On that session SPY printed:
- IV30: 12.45%
- RV20: 13.32%
- IV30−RV20: −0.9 pts
- IV Rank: 4.22%
- IV Percentile: 11.55%
- 25-delta skew: +2.7 pts
The note's "SPY IV in the 4th percentile of the past year" matches TradingFlow's IV Rank, not IV Percentile. IV Rank asks how close today's IV30 sits to the bottom of its own 1-year range. IV Percentile asks on how many clean history days IV30 printed lower. They are different clocks.
How the dislocation formed
The original note stacks three premia.
Earnings-event premium: mega-cap reports were still ahead, and the post says retail call buying in opening flow ran about 56%, near a year high. Active call buying lifted event variance. Public option flow is anonymous, so Rank cannot confirm that 56% share.
AI-internal split: semiconductors, software, and large-cloud names stopped moving together. Low stock correlation kept index IV from rising with single-name IV.
July momentum-unwind tail: a large tech unwind lifted single-name realized vol through a string of up and down days.
The identity underneath is standard:
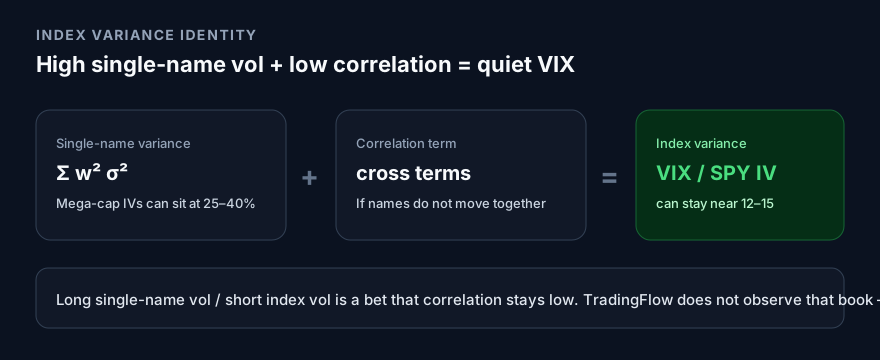
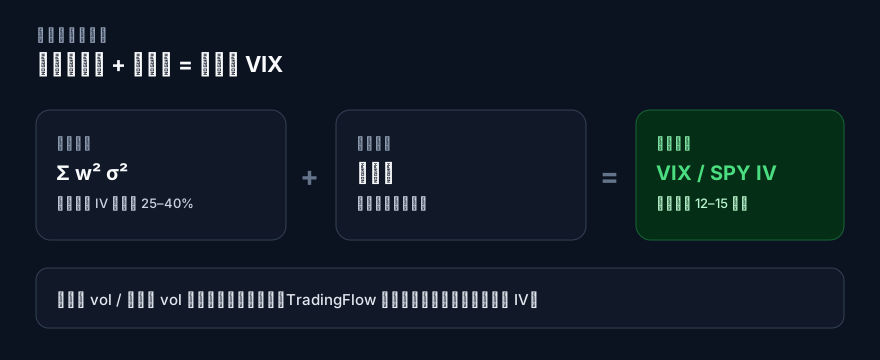
Index variance equals the weighted sum of single-name variances plus a correlation term. High single-name vol with low correlation can leave VIX quiet. TradingFlow sees the IV30s. It does not see DSPX, COR1M, or the book that was long one side and short the other.
Index variance = weighted single-name variance + correlation. Single-name vol can sit high while implied correlation sits low, and VIX stays quiet. That structure is a trade: buy single-name vol, sell index vol, and bet the names keep walking on their own. The note says that book had already become extremely crowded across 2024-2026.
Four forces from early August
1. Event variance left with earnings
Microsoft, Google, Amazon, Meta, and Apple reported. Event variance dropped almost immediately. The original post cites Cboe on August 3: VIX down 2.6 points on the week, VIXEQ down 3.4, with single-name vol falling faster. That is a trigger, not the whole story. Earnings seasons happen every quarter. This one was violent, the note says, because DSPX was already at a six-year extreme before the prints.
Rank cannot reprint VIXEQ. It can show what the mega-caps looked like after those prints.
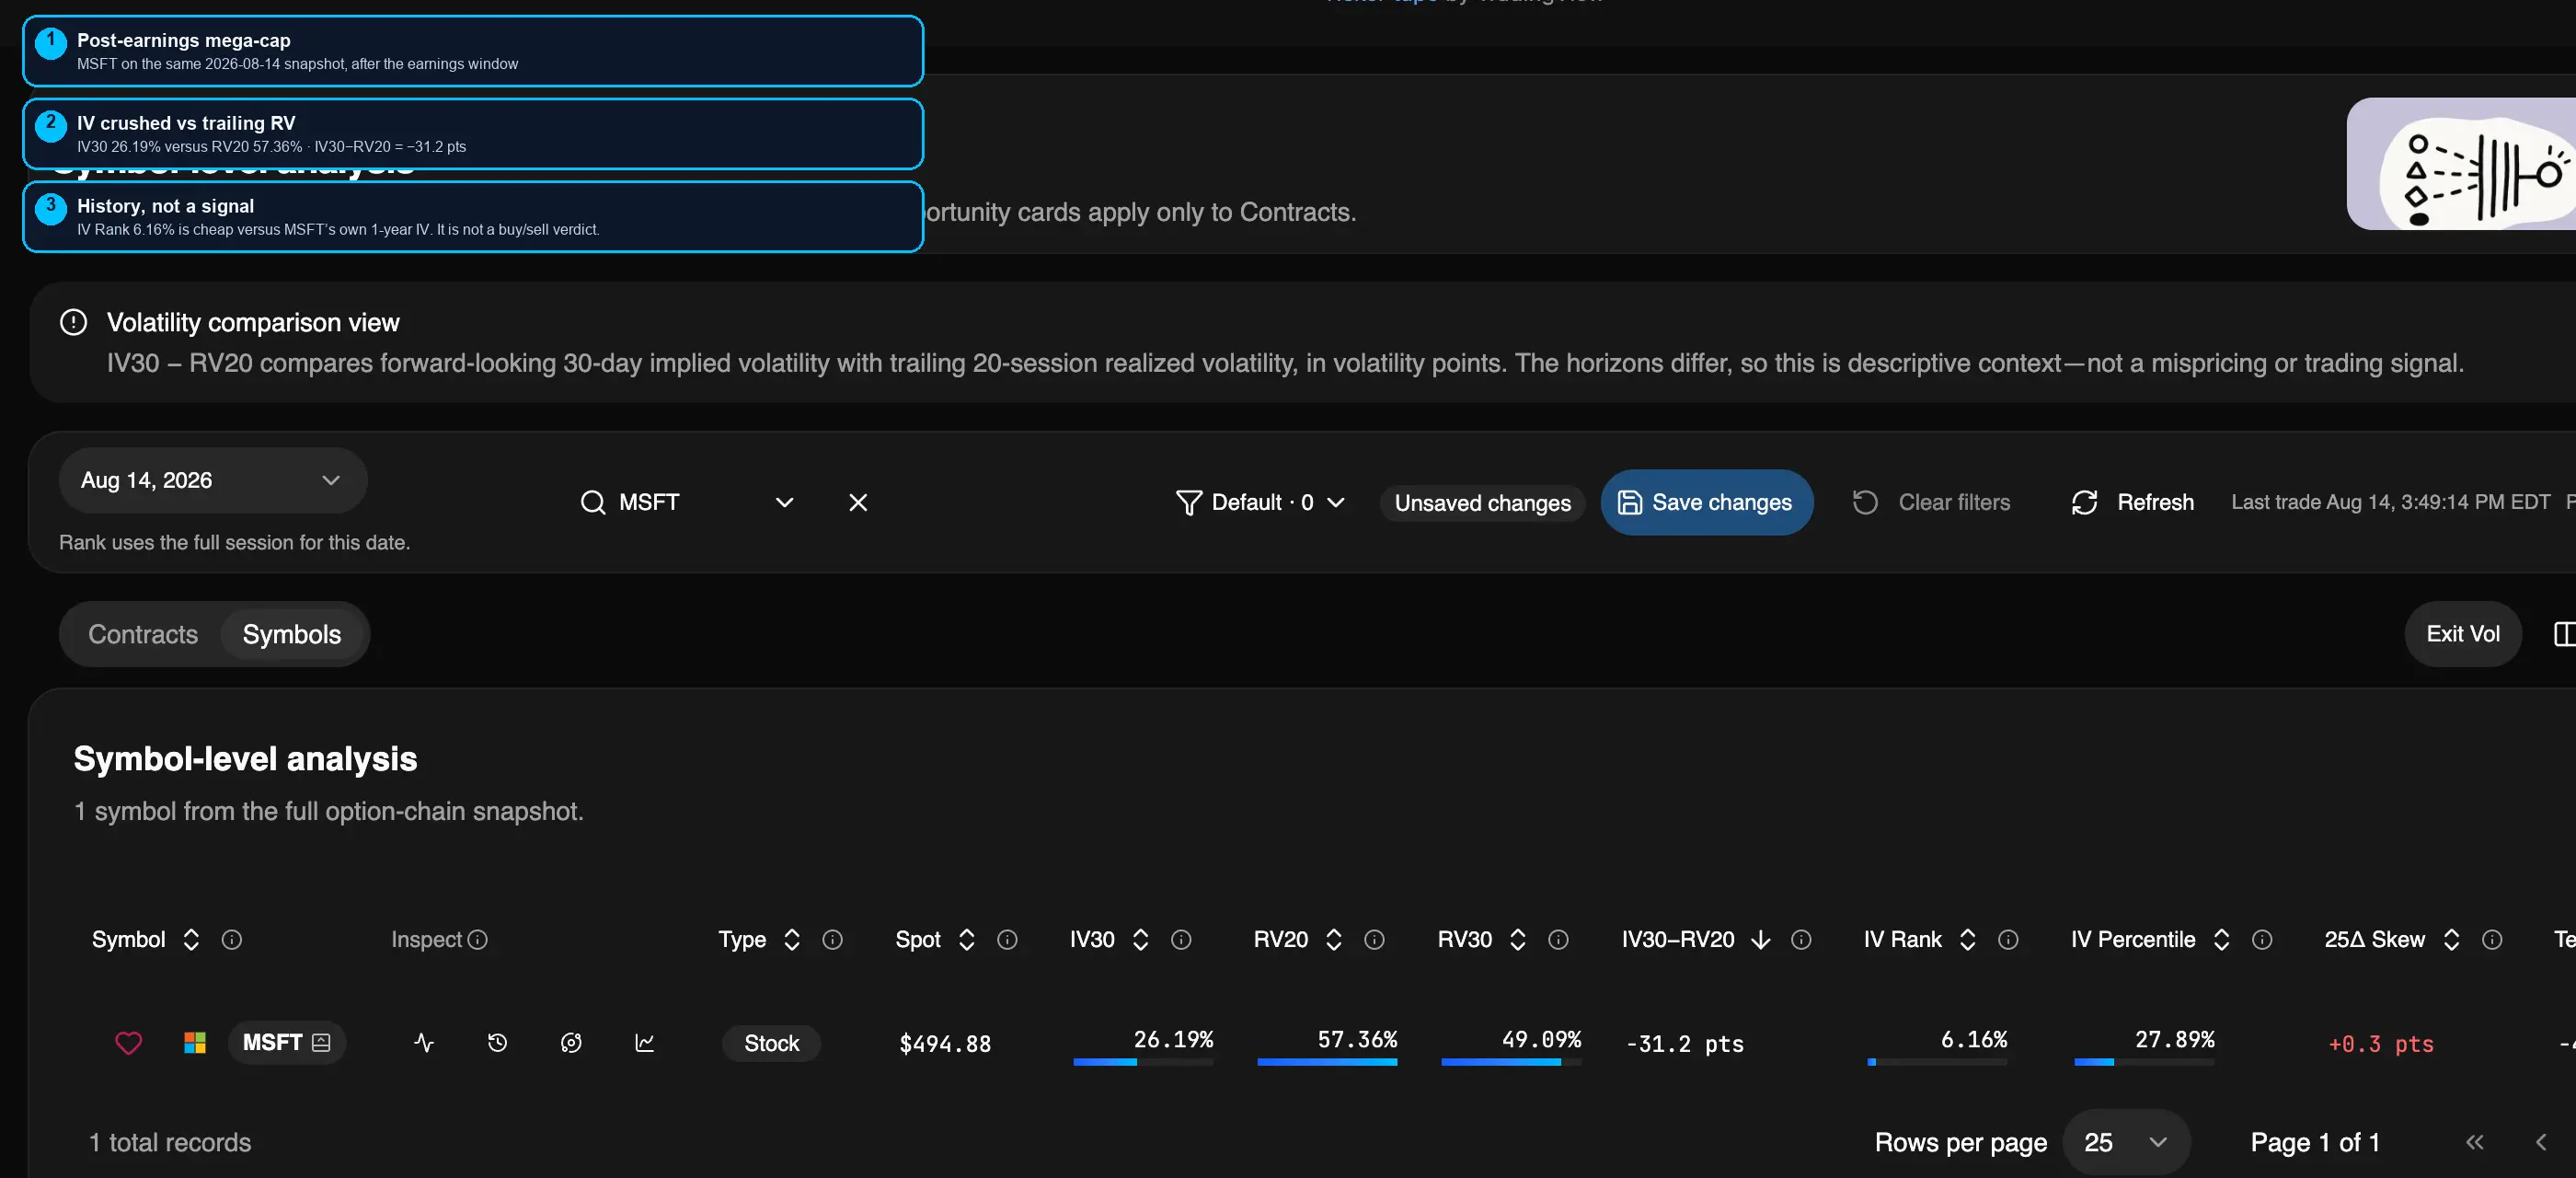
Same session, MSFT only. IV30 26.19% versus RV20 57.36% is the post-earnings signature: implied vol has already reset, trailing realized vol still remembers July's range. Authenticated test-environment capture.
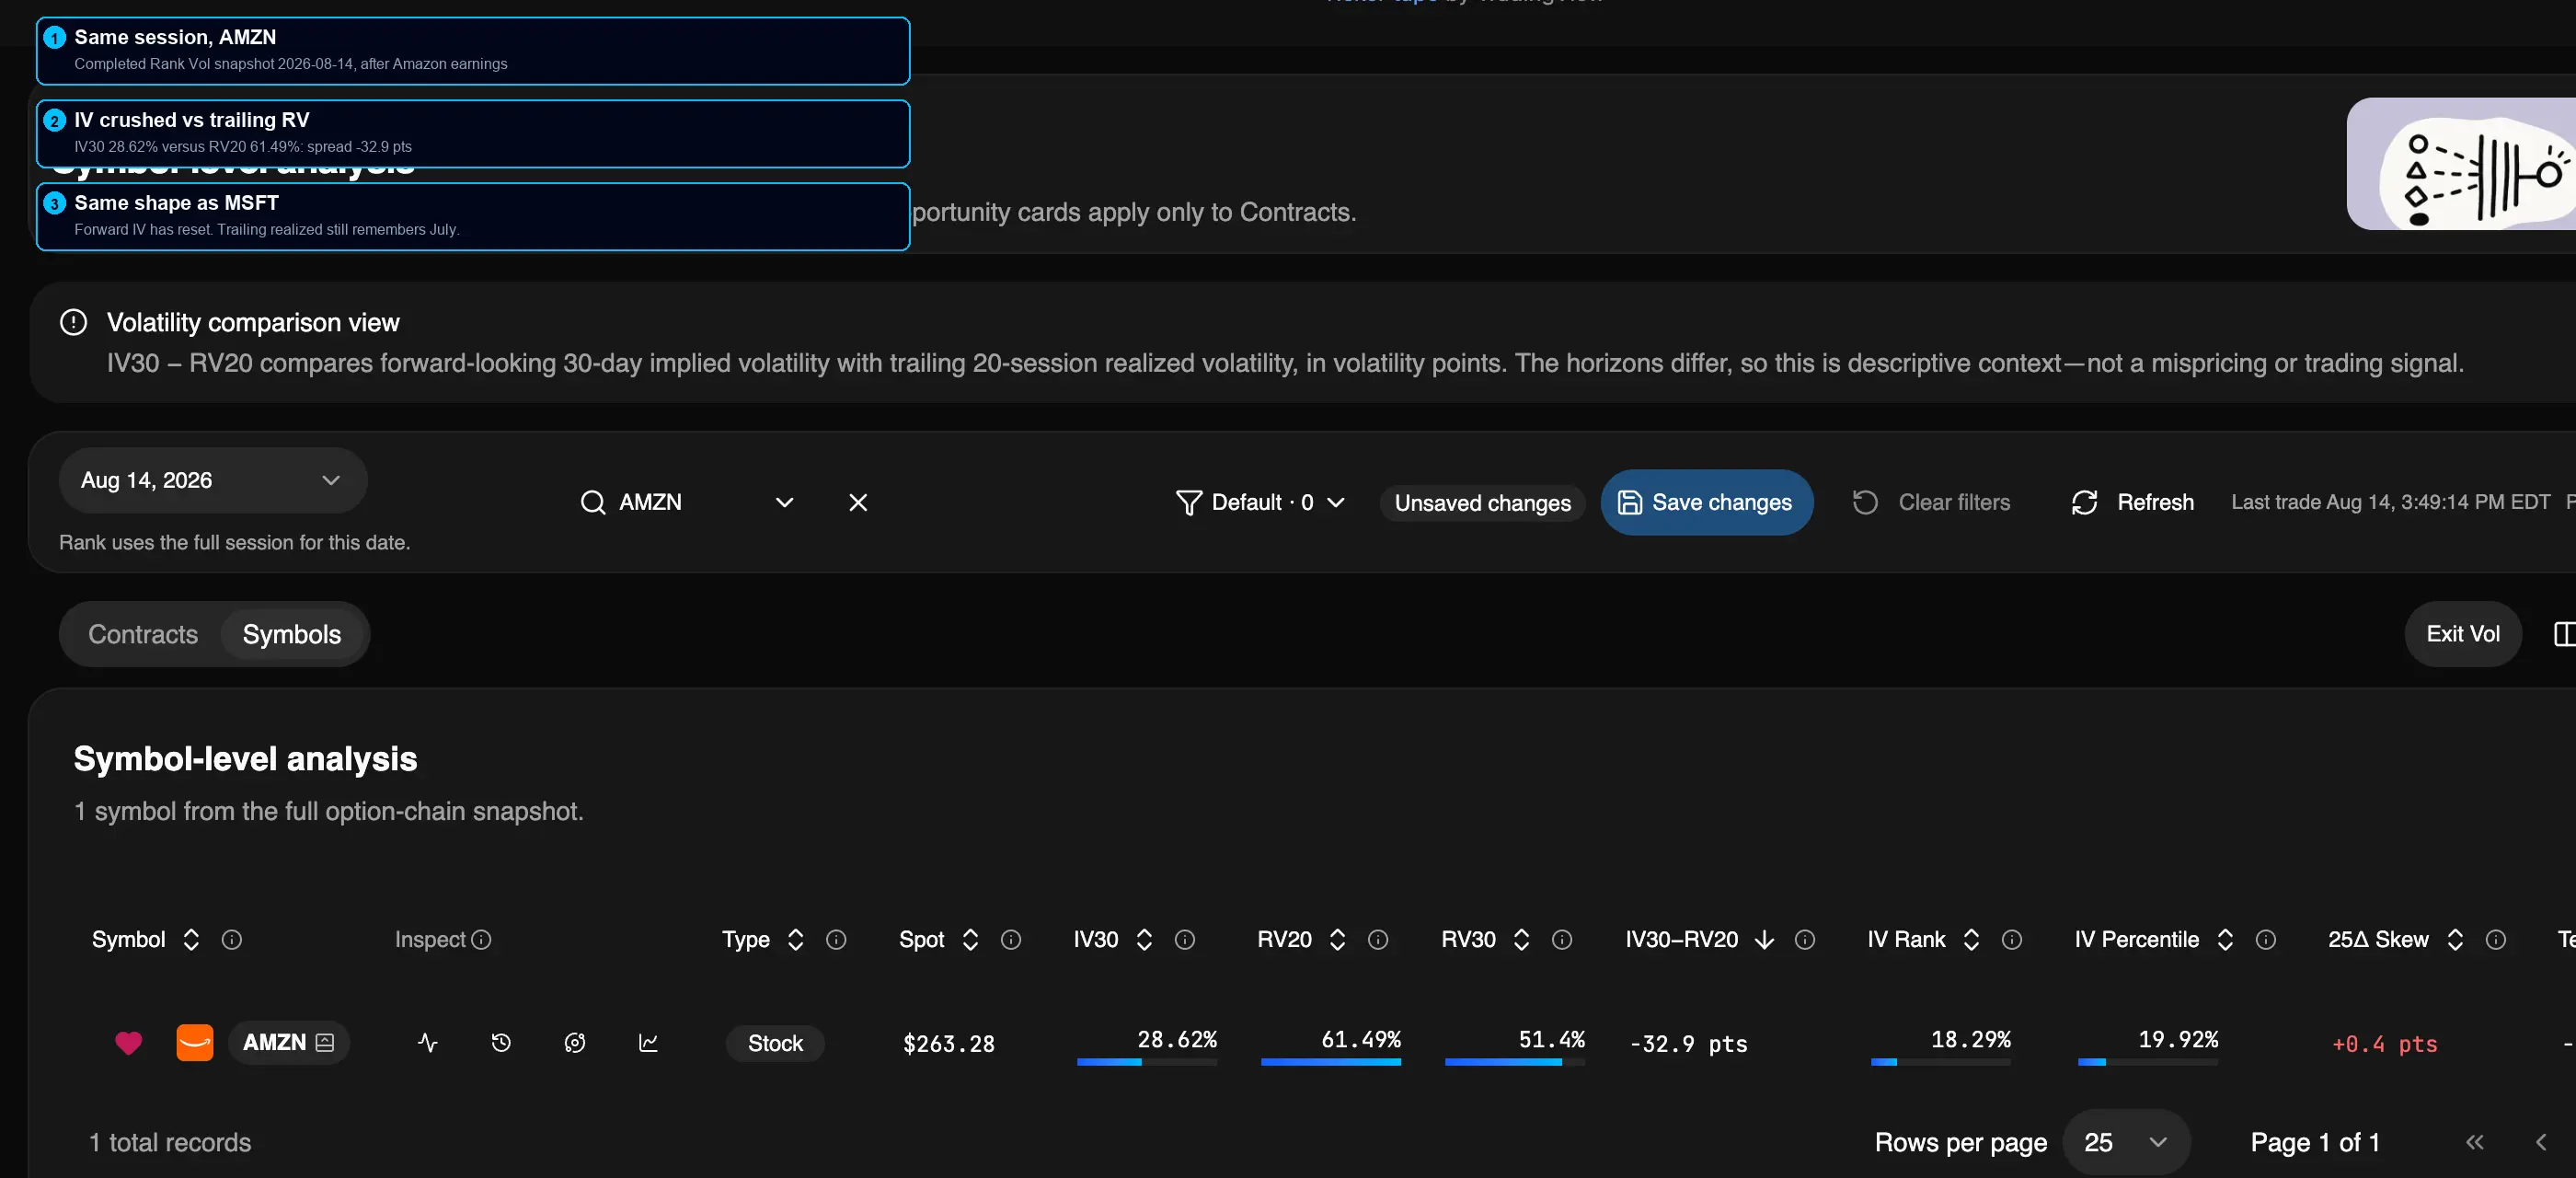
AMZN on the same August 14 snapshot. IV30 28.62% versus RV20 61.49%, spread −32.9 points. Same shape as MSFT: forward IV is already in, trailing realized is not. Authenticated test-environment capture.
The Vol drawer makes the two clocks explicit:
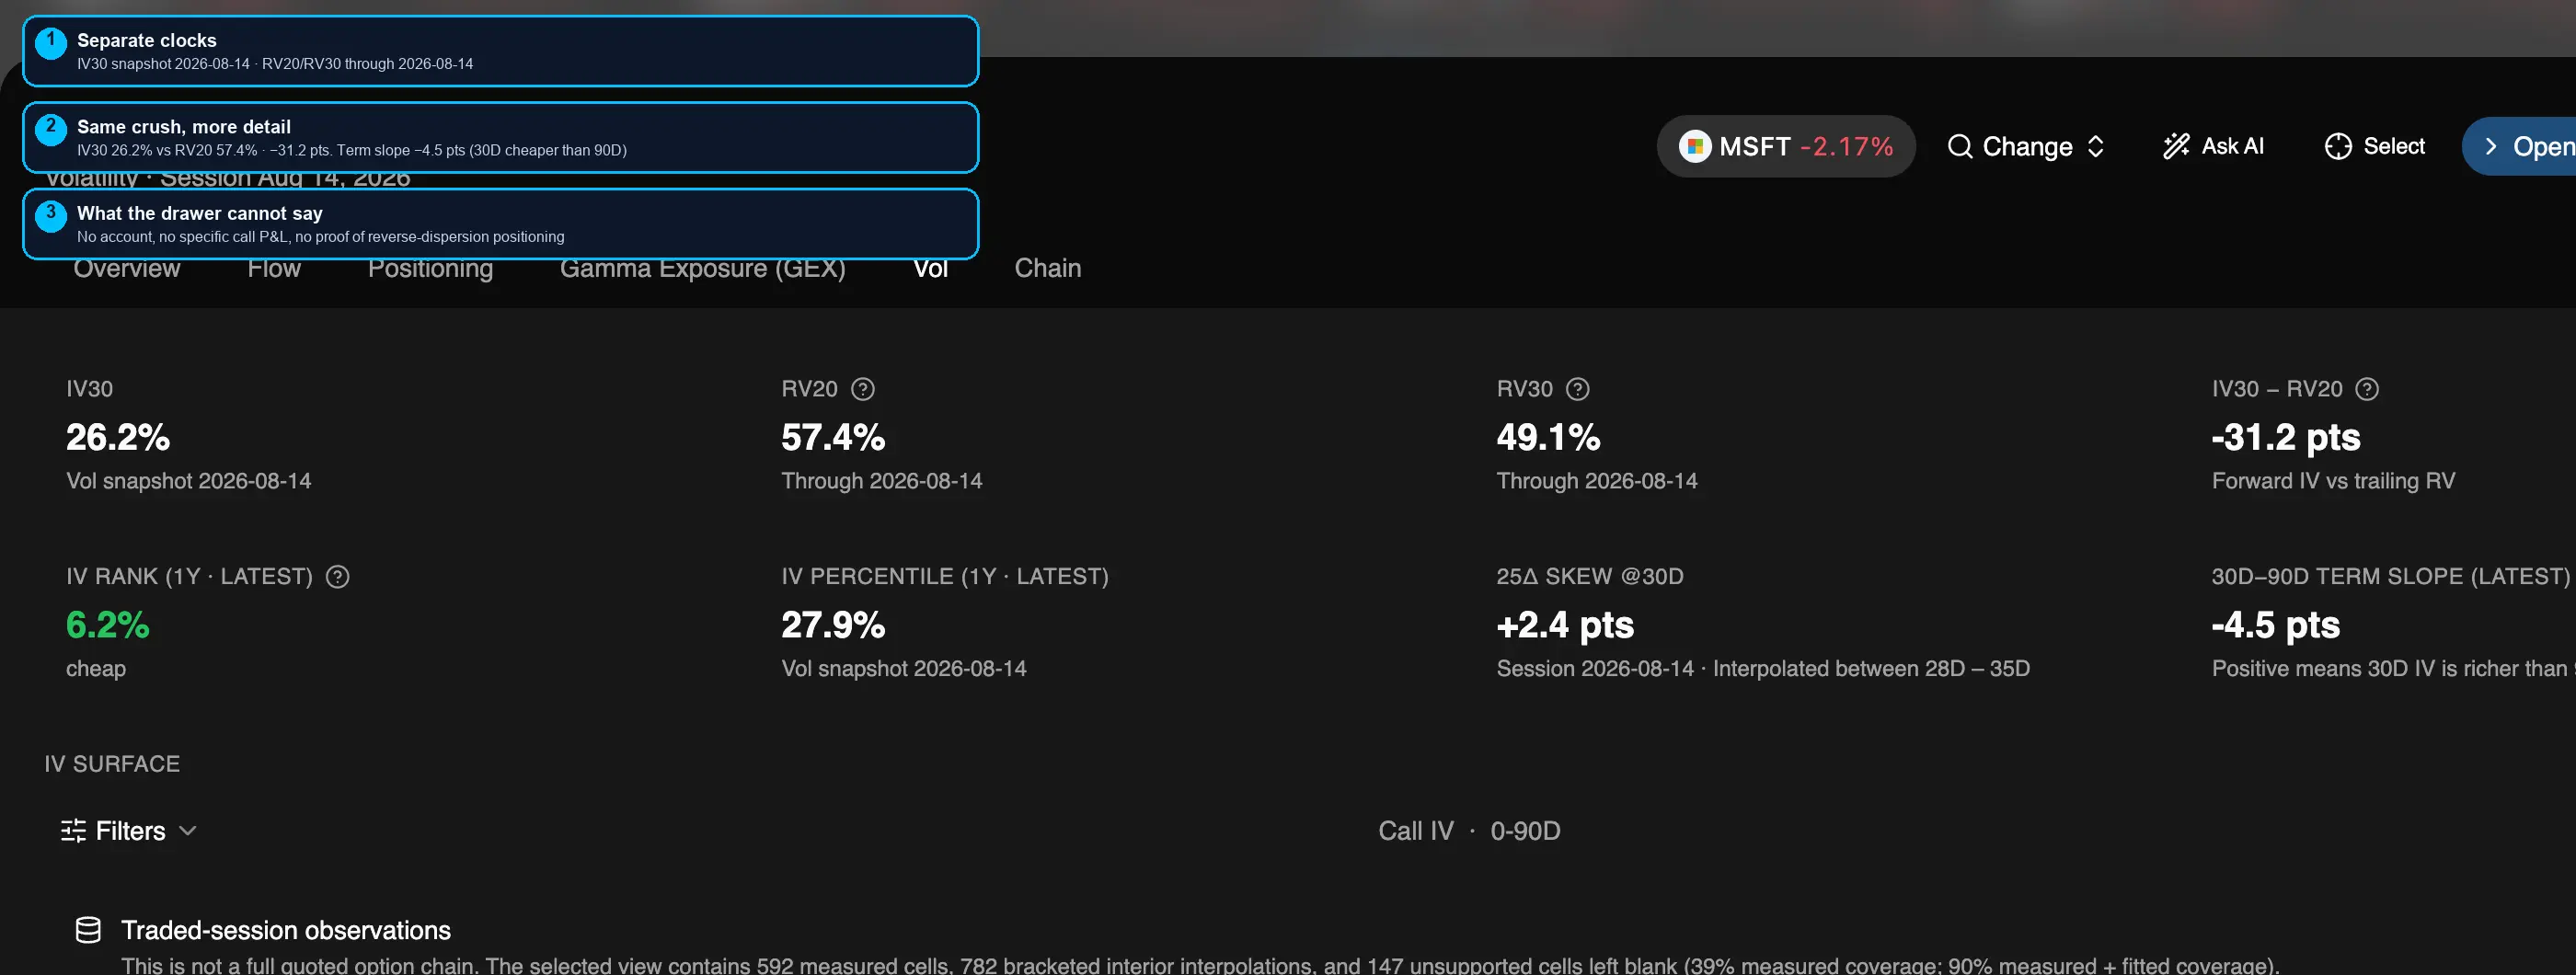
MSFT Vol drawer, session August 14, 2026. IV30 26.2% (vol snapshot that date) versus RV20 57.4% (through that date) produces −31.2 points. Term slope −4.5 points means 30-day IV is cheaper than 90-day IV. The drawer cannot name an account or a specific call's P&L.
2. The crowded dispersion book reversed
This is the amplifier in the original note. The mainstream trade had been buy single-name vol / sell index vol. The post says some vol funds, including QVR, had already flipped to reverse dispersion (buy index vol / sell single-name vol) because the single-name versus index IV gap had gone extreme.
After earnings, the long single-name-vol side hit event-variance gone, theta bleed, DSPX/VIXEQ breaking trend, and stops. Reverse-dispersion desks were selling single-name IV at the same time. That is a position flip, not a slow fade. It is also why names with no earnings, or with earnings already behind them, saw IV compress together. The market was selling the single-name vol asset class, not one print.
Rank cannot see that book. What it can show is the result: MSFT and AMZN, already through earnings, still sitting 31-33 volatility points under their own trailing RV.
If the August story were "sell every single-name vol the same way," NVDA should look like MSFT. It does not.
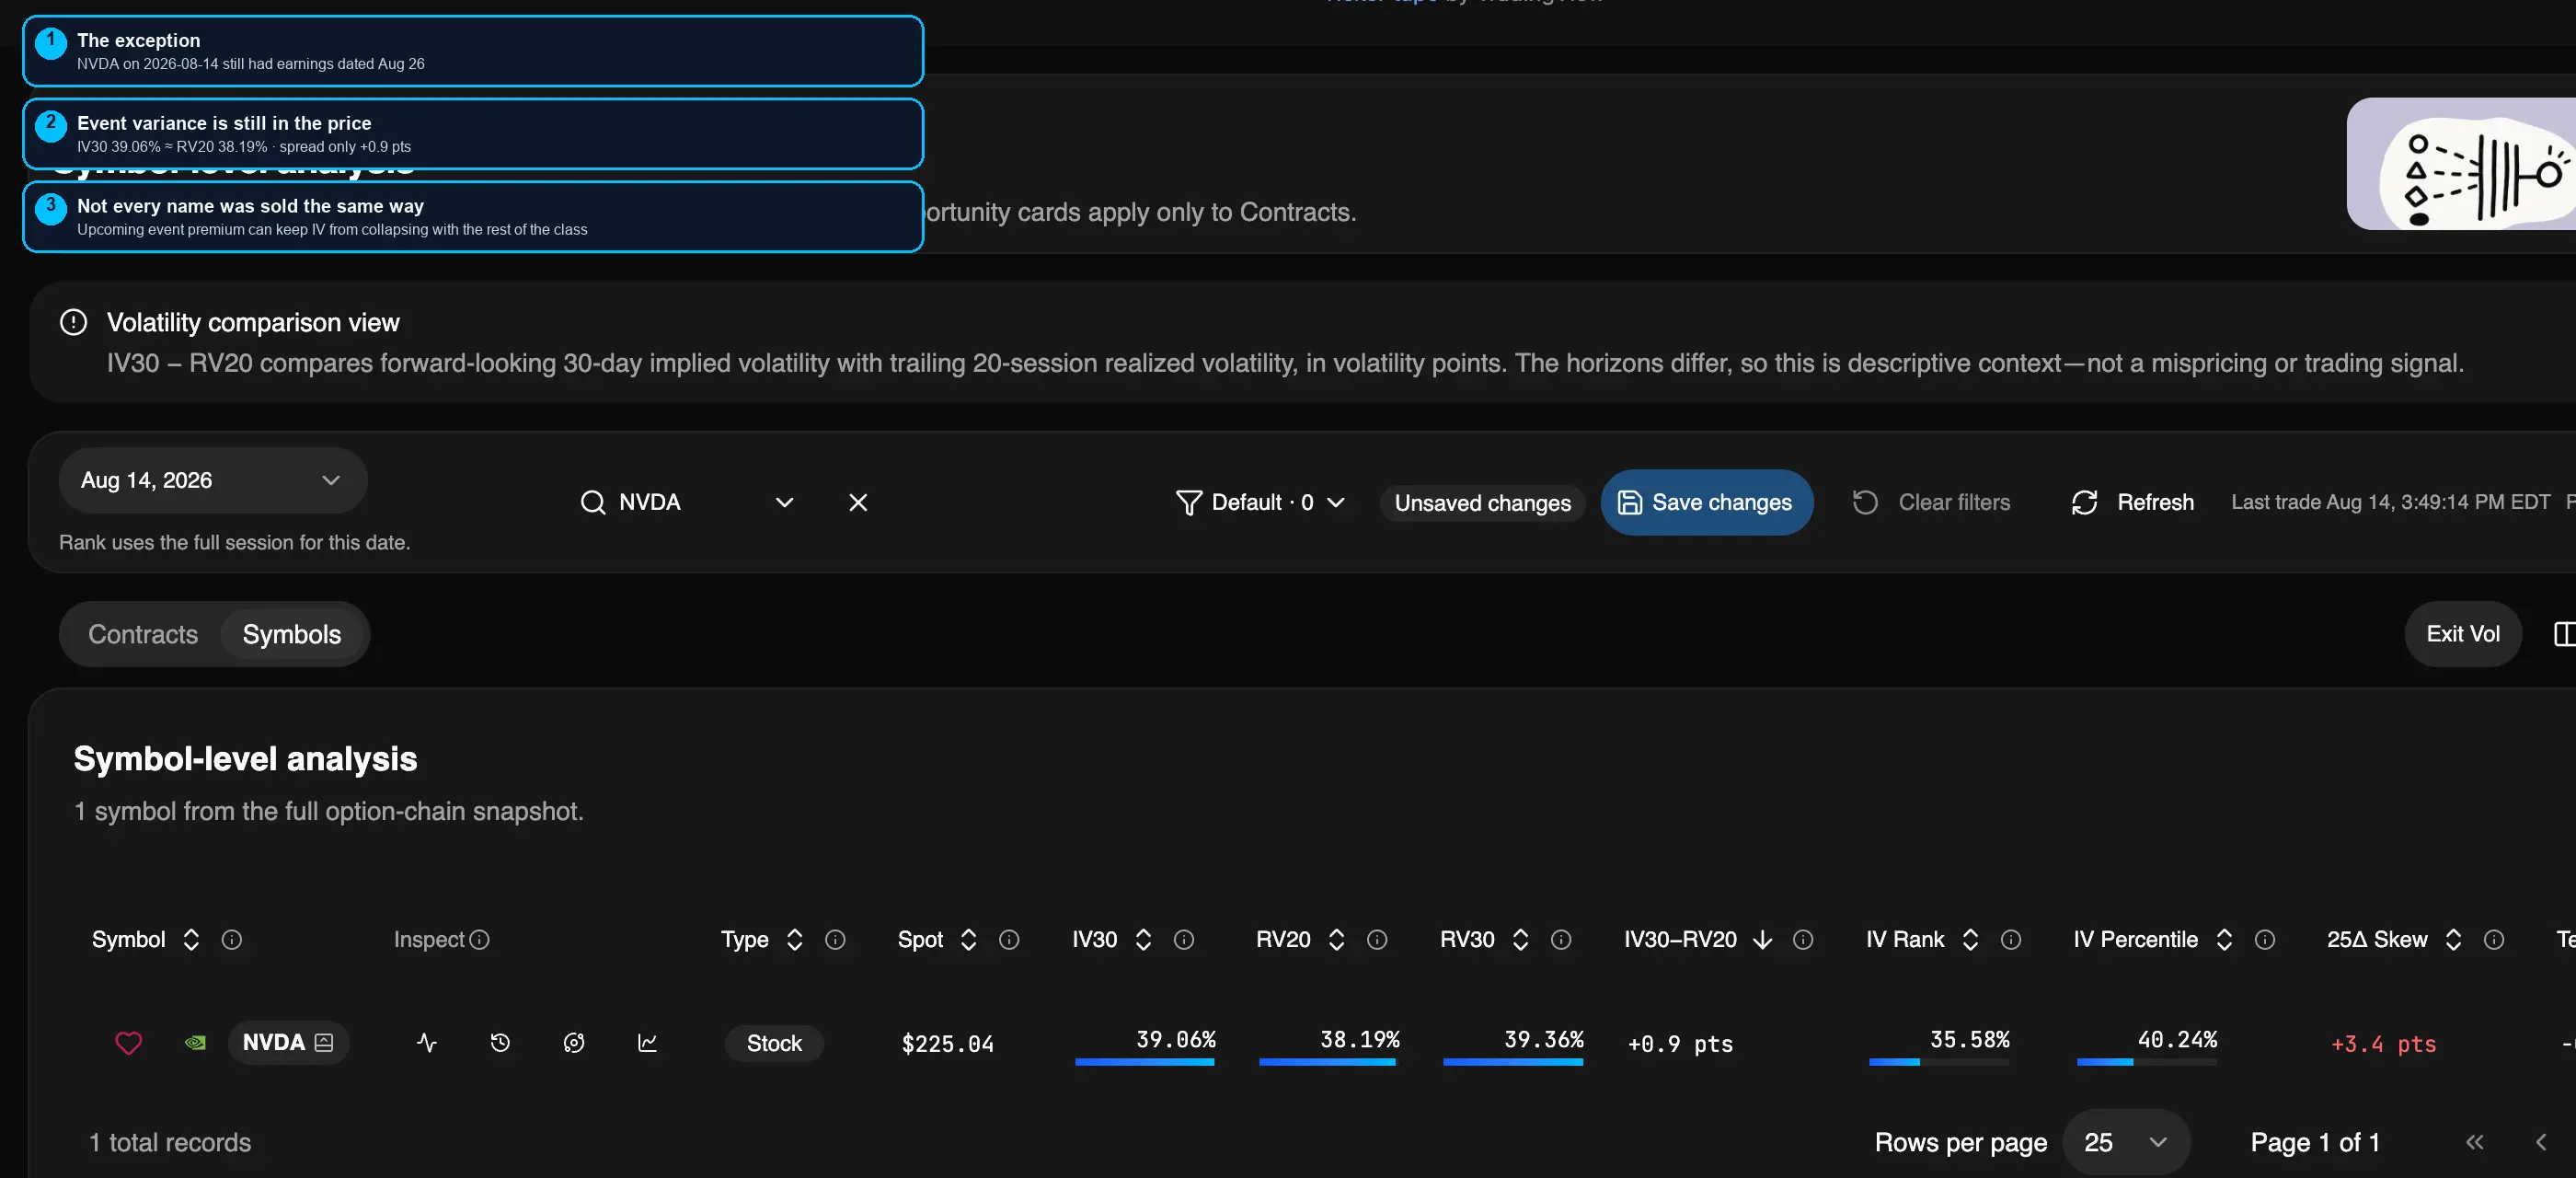
NVDA on the same August 14 session. Earnings were still dated August 26. IV30 39.06% sits on top of RV20 38.19%. Authenticated test-environment capture.
The name that still had a dated catalyst kept IV30 on top of realized vol. That is the first engine in the original note: event variance. It also keeps the mid-July "hyperscaler IV ~40%" line in context. On August 14, NVDA was still near 39%. The names that had already reported were the ones sitting in the mid-20s.
3. After July's de-leveraging, the fear flipped
The original note's third force is a regime change: from "fear a single-name blow-up" to "fear missing the rally." July's tech momentum unwind had already cleaned out a lot of leverage. Once that finished, the bounce had a cleaner base. Then came an underexposed chase. The post says SPX rose 5.8% in the four sessions through August 4, that July 30 to August 5 became the heaviest five-day SPX call-volume window on record, and that short-dated call skew hit a two-year high.
Those volume and skew records are the original post's figures. Rank's August 14 Vol table does not reprint them.
4. Vol-control feedback
The fourth force is the system-money loop. The note says that by August 10, average 3-month ATM IV on the SOX top ten was already down nearly 20% since the start of August. Lower vol lets vol-control and similar strategies add exposure; adding exposure lifts prices; higher prices cut demand for downside vol; still-lower vol frees more buying power.
The chain the post writes is: IV down → expected risk down → system money adds → trend improves → RV down → IV down again.
Rank is looking at the result of that loop, not the allocator. On August 14, SPY IV30 was already 12.45%, and MSFT/AMZN forward IV sat far under trailing RV.
Direction can be right and the call still loses
ATM IV can collapse while far OTM calls still get bid. Strong call demand does not protect an ATM or mild-OTM long call from IV crush. The post cites Cboe around August 10: SPX skew near a one-year low, while deep OTM puts still found buyers. That is a surface reprice, not "nobody is buying options."
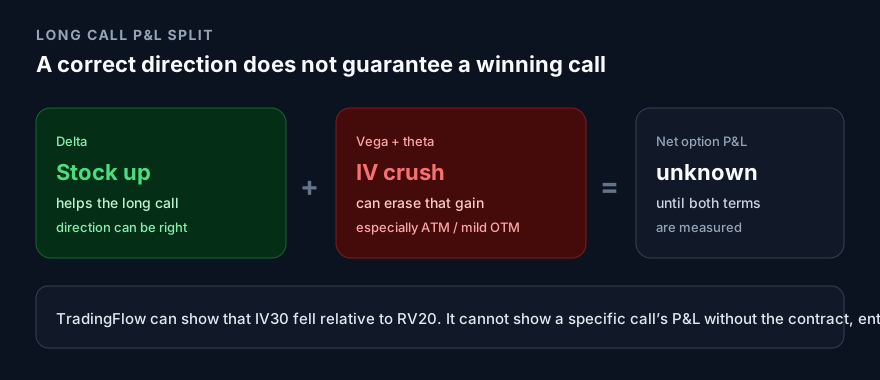
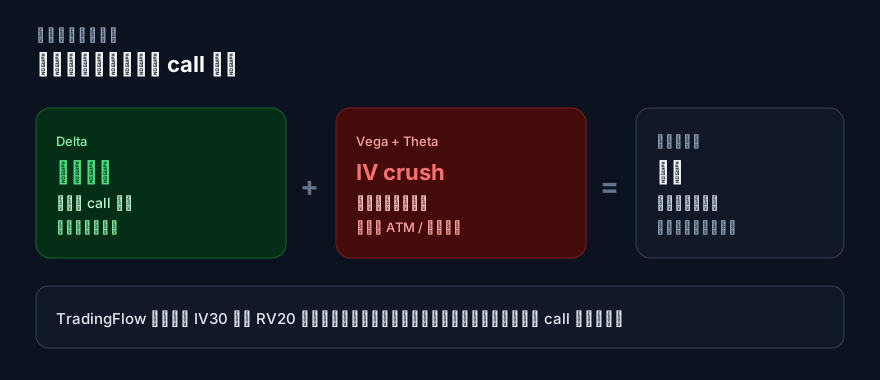
A correct stock direction is only one term. Vega and theta from an IV crush can erase the delta. TradingFlow can show that IV30 has already fallen versus RV20. It cannot mark a specific call without the contract and the fills.
Even when the stock goes the right way, a large negative vega move plus theta can eat the entire delta gain. When IV's change is sharply negative, the option's total P&L can still be negative.
The note reads this crush as vol normalizing after a speculative-leverage washout. After July's momentum drawdown, levered AI product liquidations, and single-name options de-risking: short-dated option demand fell, retail and momentum chasing slowed, single-name realized vol cooled, dealers had less need to chase spot with gamma hedges, and single-name IV was sold as a class.
ATM vol crushed; the wings did not
The original note's live structure point: single-name ATM IV looks cheap, while 25-delta and 10-delta wings are still expensive. Index and single-name term structure had already dropped into a low zone.
On the August 14 Rank snapshot:
- SPY 25-delta skew was still +2.7 points
- MSFT 30-day IV sat 4.5 points below 90-day IV
- AMZN 25-delta skew was only +0.4 points; NVDA's was +3.4
Rank's 25-delta skew is a 25-delta risk reversal, not a 10-delta wing price. It is enough to say ATM and the wings did not crush in lockstep. It is not a 10-delta quote.
The note's structure read, not a TradingFlow recommendation: if you want direction, an ATM-area call spread still makes sense; if you want IV to mean-revert, ATM or mild-OTM single-leg vega is where the crush actually happened; buying the far wing because it "looks cheap" is the wrong place, because wing skew did not crush with ATM. Buy the vol that was crushed (ATM / mild OTM). Do not buy the deep OTM put or call that is still expensive.
Has the crush ended?
As of August 14, the original note printed:
- VIX about 14.25
- DSPX about 33.45
- SPY IV in the 4th percentile of the past year
- Median single-name IV still around the 31st percentile
- Single-name realized vol around the 61st percentile
Implied dispersion had fallen. Realized dispersion had not. IV may already be running ahead of RV.
Rank's August 14 snapshot, captured in the test environment on August 17:
| Name | IV30 | RV20 | IV30−RV20 | IV Rank | What it shows |
|---|---|---|---|---|---|
| SPY | 12.45% | 13.32% | −0.9 pts | 4.22% | Index IV already at a 1-year extreme low |
| MSFT | 26.19% | 57.36% | −31.2 pts | 6.16% | Post-earnings crush versus its own RV |
| AMZN | 28.62% | 61.49% | −32.9 pts | 18.29% | Same crush shape |
| NVDA | 39.06% | 38.19% | +0.9 pts | 35.58% | Event premium still in the price |
That table is four names, not a cross-section median. It cannot reprint DSPX 50% → 33.45. It is consistent with the note's gap: index IV and post-earnings mega-cap IV are already down; trailing single-name realized vol is not.
The original note then laid out two paths from that date:
If single-name realized vol also drifts down, the IV crush can keep grinding. If realized dispersion stays high, this low IV starts to attract bids again. The note also flagged August 19 VIX expiry and August 21 monthly OPEX as removing some of the gamma that had been pinning index vol, with NVDA earnings and Jackson Hole still on the calendar. If correlation then rises, the repair path can switch from "single-name IV falls" to "index IV rises."
What this snapshot cannot say
- It cannot reprint DSPX, COR1M, VIXEQ, or the 56% retail call-buy share. Those are the original post's Cboe and flow figures.
- It cannot prove a named desk's reverse-dispersion inventory, a record SPX call-volume window, or any one call's P&L.
- IV30−RV20 is not a mispricing signal. July's realized range can keep RV20 elevated for weeks after the option market has already reset.
- A low IV Rank is not a reason to buy vol. NVDA is why: the next event was still on the calendar.
- No public tape names who was long or short those IVs.
Reproduce the Rank read
- Open Rank Symbols.
- Click Vol.
- Set the trading date to August 14, 2026 (completed session).
- Filter SPY, then MSFT, AMZN, and NVDA.
- Open each name's Vol drawer and confirm the IV snapshot date and the RV through-date before comparing them.
Sign-in and a paid Rank entitlement may be required. Delayed data can apply. Numbers move when the snapshot moves. The figures here are the August 14, 2026 session as captured in the test environment on August 17.
Related reading
- IV30 vs RV20: see implied and realized volatility side by side
- A five-box daily vol note, written on SPY
- The last tape said OTM. The official close exercised the QQQ $731 calls.
Learn more
Open the app
TradingFlow App Home → Rank Symbols for the dated IV30 vs RV20 comparison → Historical Option Trades if you then want the earnings-week tape.
Educational market-structure research only, not investment advice. Options involve substantial risk of loss.
Related Articles
IV30 vs RV20: See Implied and Realized Volatility Side by Side
TradingFlow Rank Symbols now compares IV30 with RV20 and RV30, adds a signed IV30−RV20 spread, and preserves the separate dates behind each measure.
A Five-Box Daily Vol Note, Written on SPY
张无忌wepoets publishes the same five boxes every day: gamma pin, skew, VRP, expiry OI, and a named print. This article follows that 冰火岛 note, then fills the boxes on SPY in Rank Symbols and on the tape.
We Verified the Viral $7M Memory Put Trade. The Tape Needs Context.
TradingFlow’s historical option tape matches the six contracts and $422,135 gross premium in a viral memory-stock put post—but not its one-month, 40%-drop narrative.