
A Five-Box Daily Vol Note, Written on SPY
张无忌wepoets publishes the same five boxes every day: gamma pin, skew, VRP, expiry OI, and a named print. This article follows that 冰火岛 note, then fills the boxes on SPY in Rank Symbols and on the tape.
On August 17, 2026 (the note is stamped that date; the X timestamp is 8:49 PM on August 16), 张无忌wepoets (@wepoets1107) posted his usual 冰火岛期权笔记. This article follows that note in the same order, then fills each box on SPY in Rank Symbols and Historical Option Trades. The SPY numbers are the latest session on August 17, 2026, captured in the test environment that afternoon. Last tape time on the Vol view was 2:11 PM ET.
HV has collapsed to 20.7% / 27.4%, a local low. BTC 21AUG skew has widened to +5.9%. ETH 1,900 calls printed a 500-lot buy.
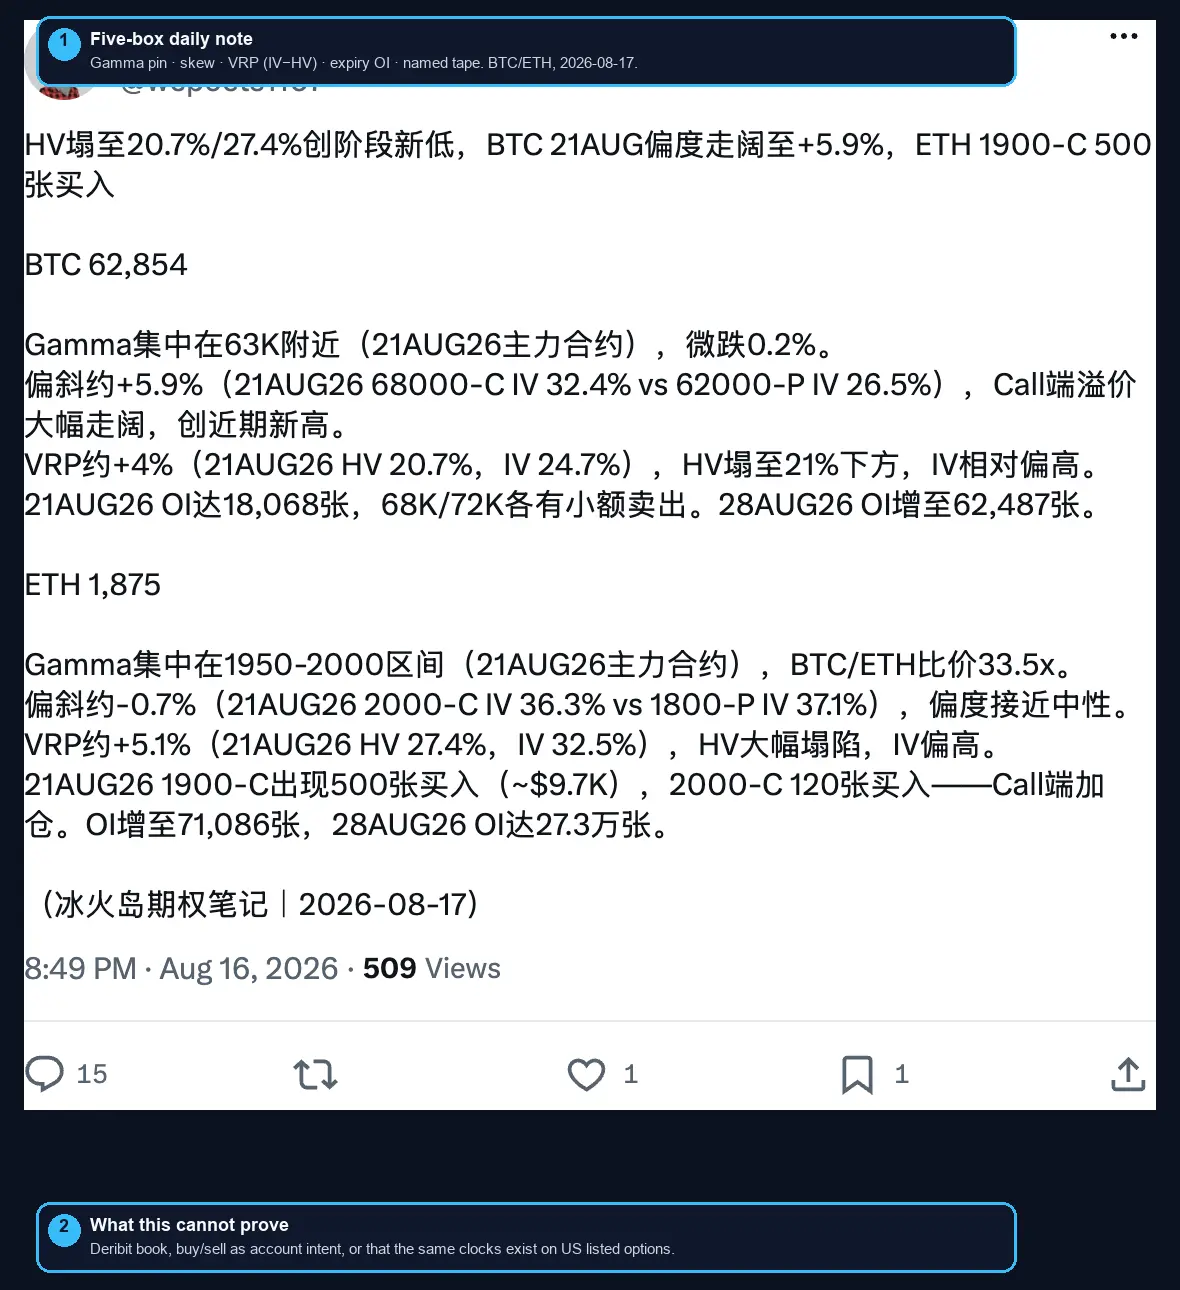
Original post from 张无忌wepoets (@wepoets1107). The author labels the note 2026-08-17. Callout 1 marks the five-box template. Callout 2 marks what a social note cannot prove on US listed options: Deribit inventory, account-side buy/sell, or identical clocks.
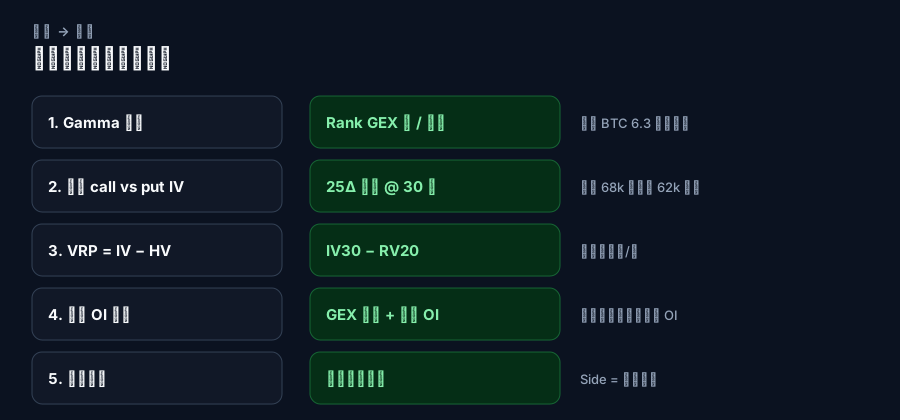
The note is written on BTC and ETH on Deribit. TradingFlow does not have that chain. The five boxes still travel: where gamma sits, how far call IV is from put IV, VRP as IV minus HV, front versus next-expiry open interest, and one named tape print.
A later post the same day, RV已经降低到2字头, reads the collapsed realized vol as "the big wave should not be far" and says to switch to positive gamma. That sentence is a trade. The five boxes are a checklist. This article fills the checklist on SPY. It does not copy the trade.
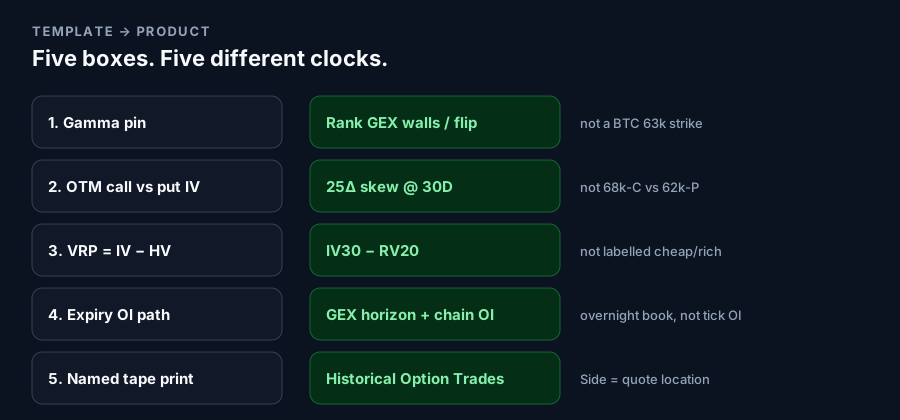
The template is portable. The clocks are not. IV30−RV20 is not his expiry HV. 25-delta skew is not 68k-call versus 62k-put. Tape Side is quote location.
Readers with access can start from SPY in the Vol drawer, then open Gamma Exposure and, separately, Historical Option Trades. Sign-in and a paid Rank entitlement may be required. Delayed data can apply.
1. Gamma pin
On BTC he writes: gamma concentrated near 63,000 on the 21AUG26 main expiry, spot 62,854, down 0.2%. On ETH: gamma in the 1,950-2,000 zone on the same expiry, spot 1,875.
TradingFlow will not hand you a Deribit strike. On SPY it hands you a flip, a call-side top, a put wall, and how much of gross GEX lives in 0DTE versus the week.
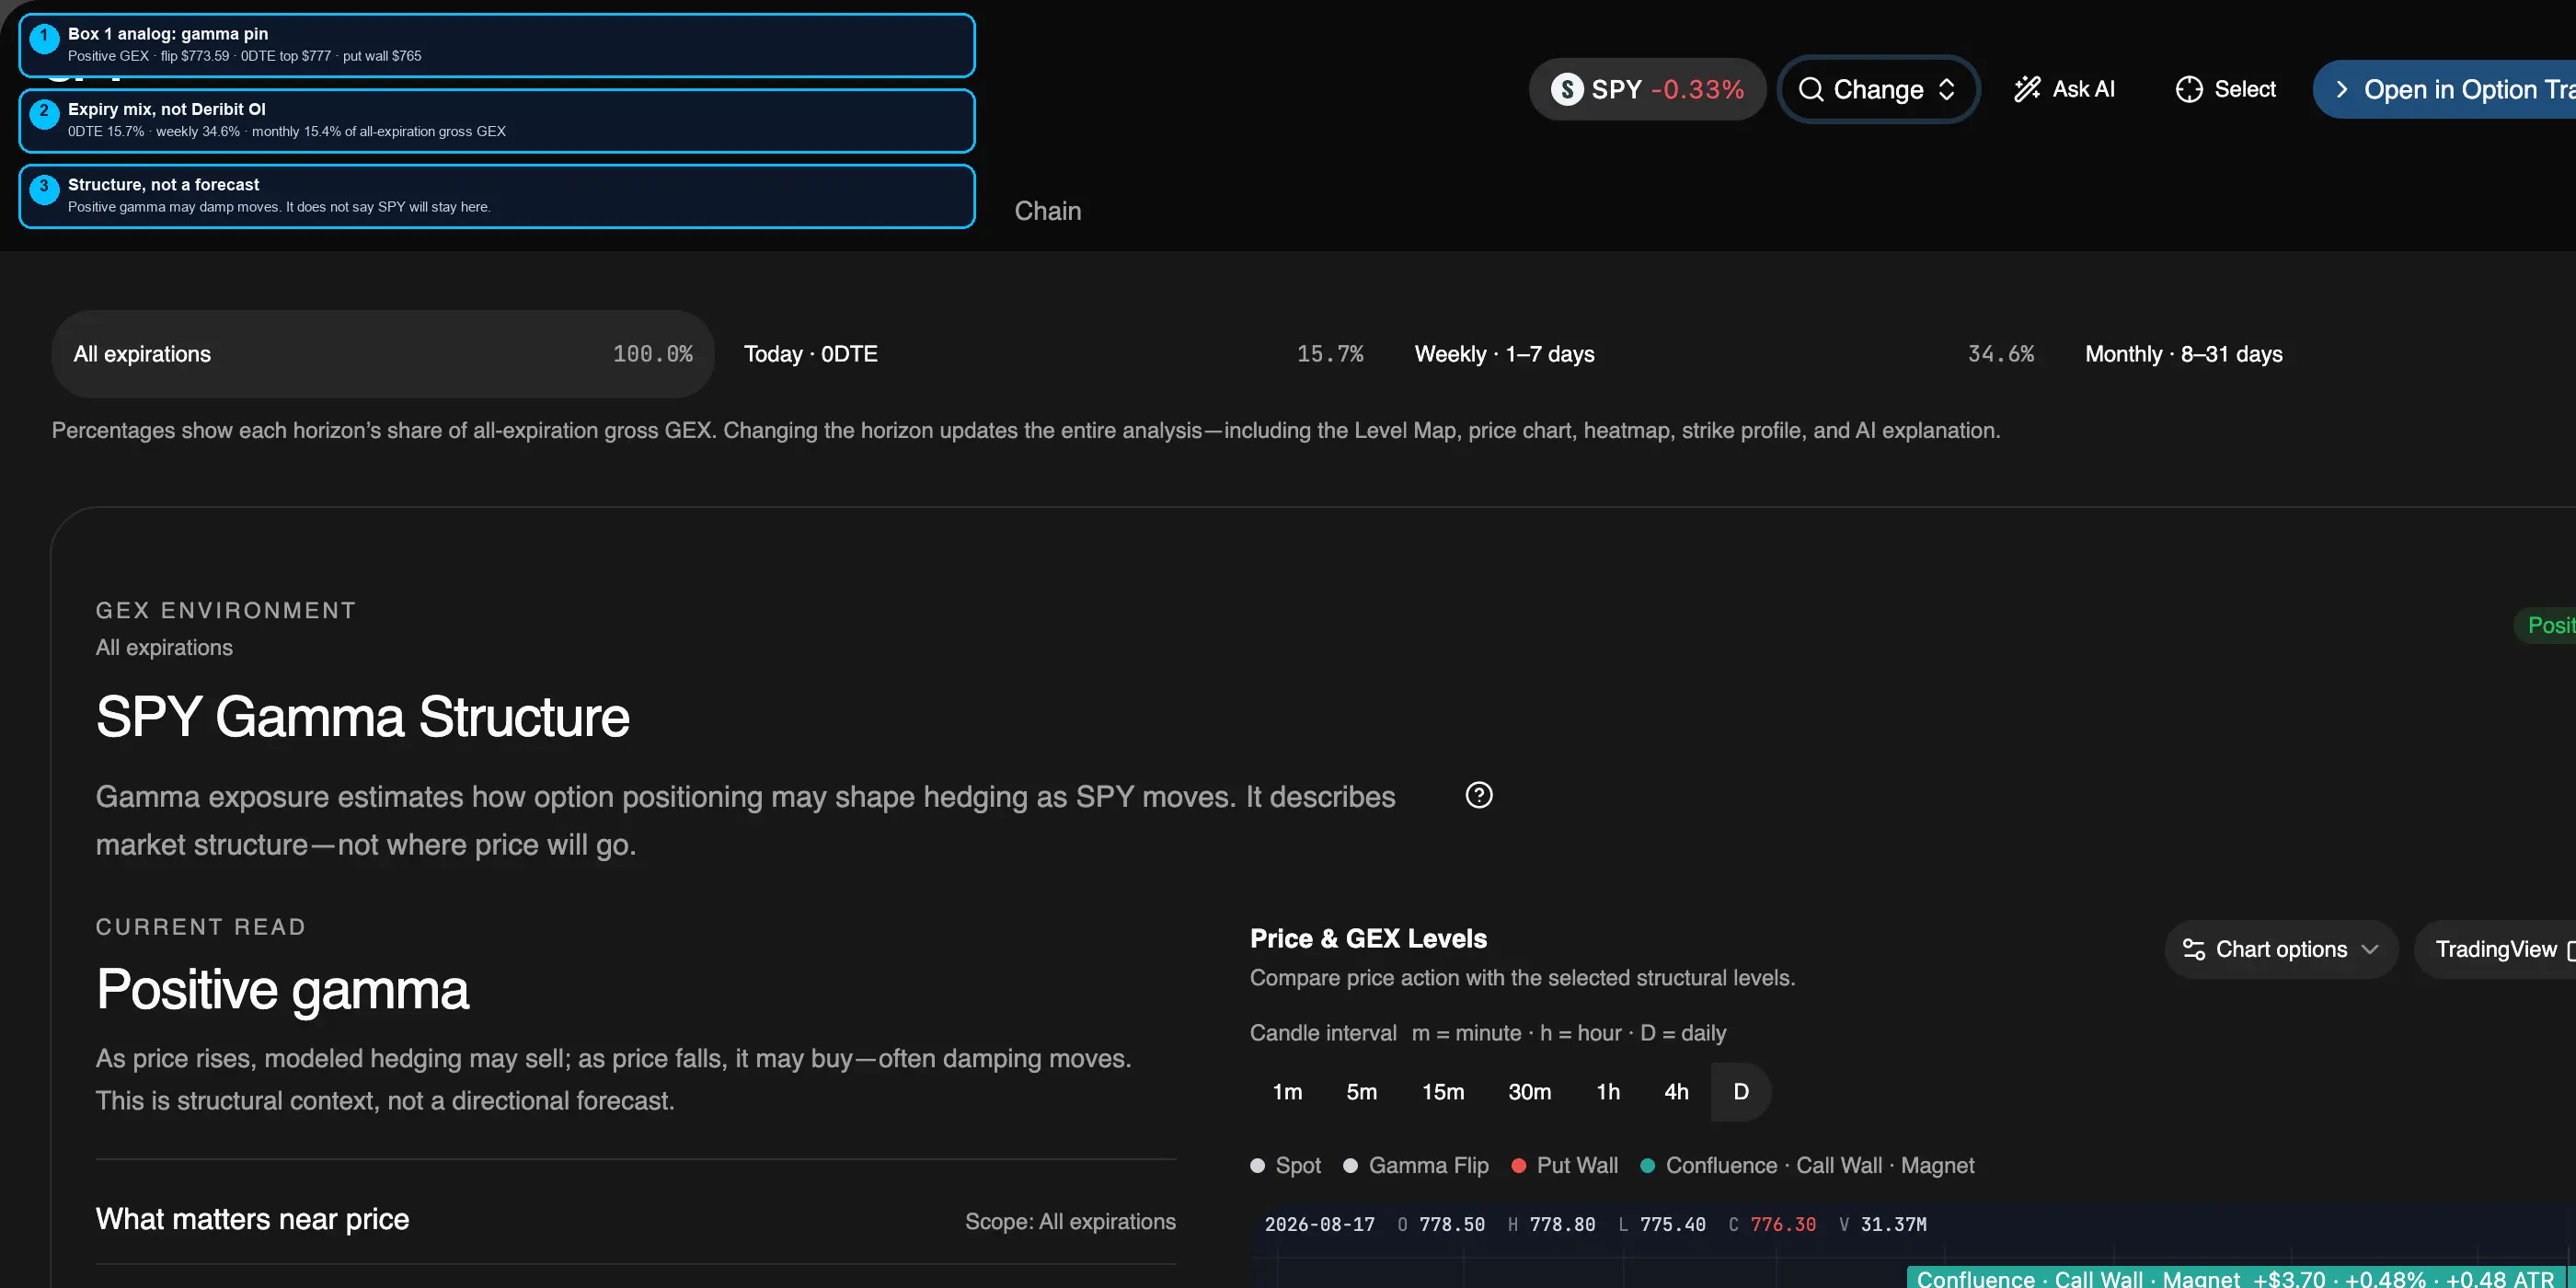
Same session. All-expiration GEX is positive. Modeled flip $773.59 sits on top of spot. 0DTE top $777; put wall $765. Horizon mix: 0DTE 15.7%, weekly 34.6%, monthly 15.4%. GEX levels are prior-close structure (T+1). This is not a price target. See Greeks and GEX.
On this snapshot:
- Environment: positive GEX
- Flip: $773.59
- 0DTE top: $777
- Put wall: $765
- Spot around $773.6, so the flip is sitting on cash
That is the closest analog to "gamma concentrated at 63k." Positive GEX describes modeled hedging that may damp moves. It is not an instruction to buy straddles, and it is not evidence that realized vol is about to expand.
2. Skew
On BTC he measured 21AUG 68,000 call IV 32.4% versus 62,000 put IV 26.5%: +5.9%, call premium, a recent high. On ETH the same expiry was nearly flat: 2,000 call IV 36.3% versus 1,800 put IV 37.1% (−0.7%).
Rank's analog is 25-delta skew at 30 days, not a 68k-call versus 62k-put pair.
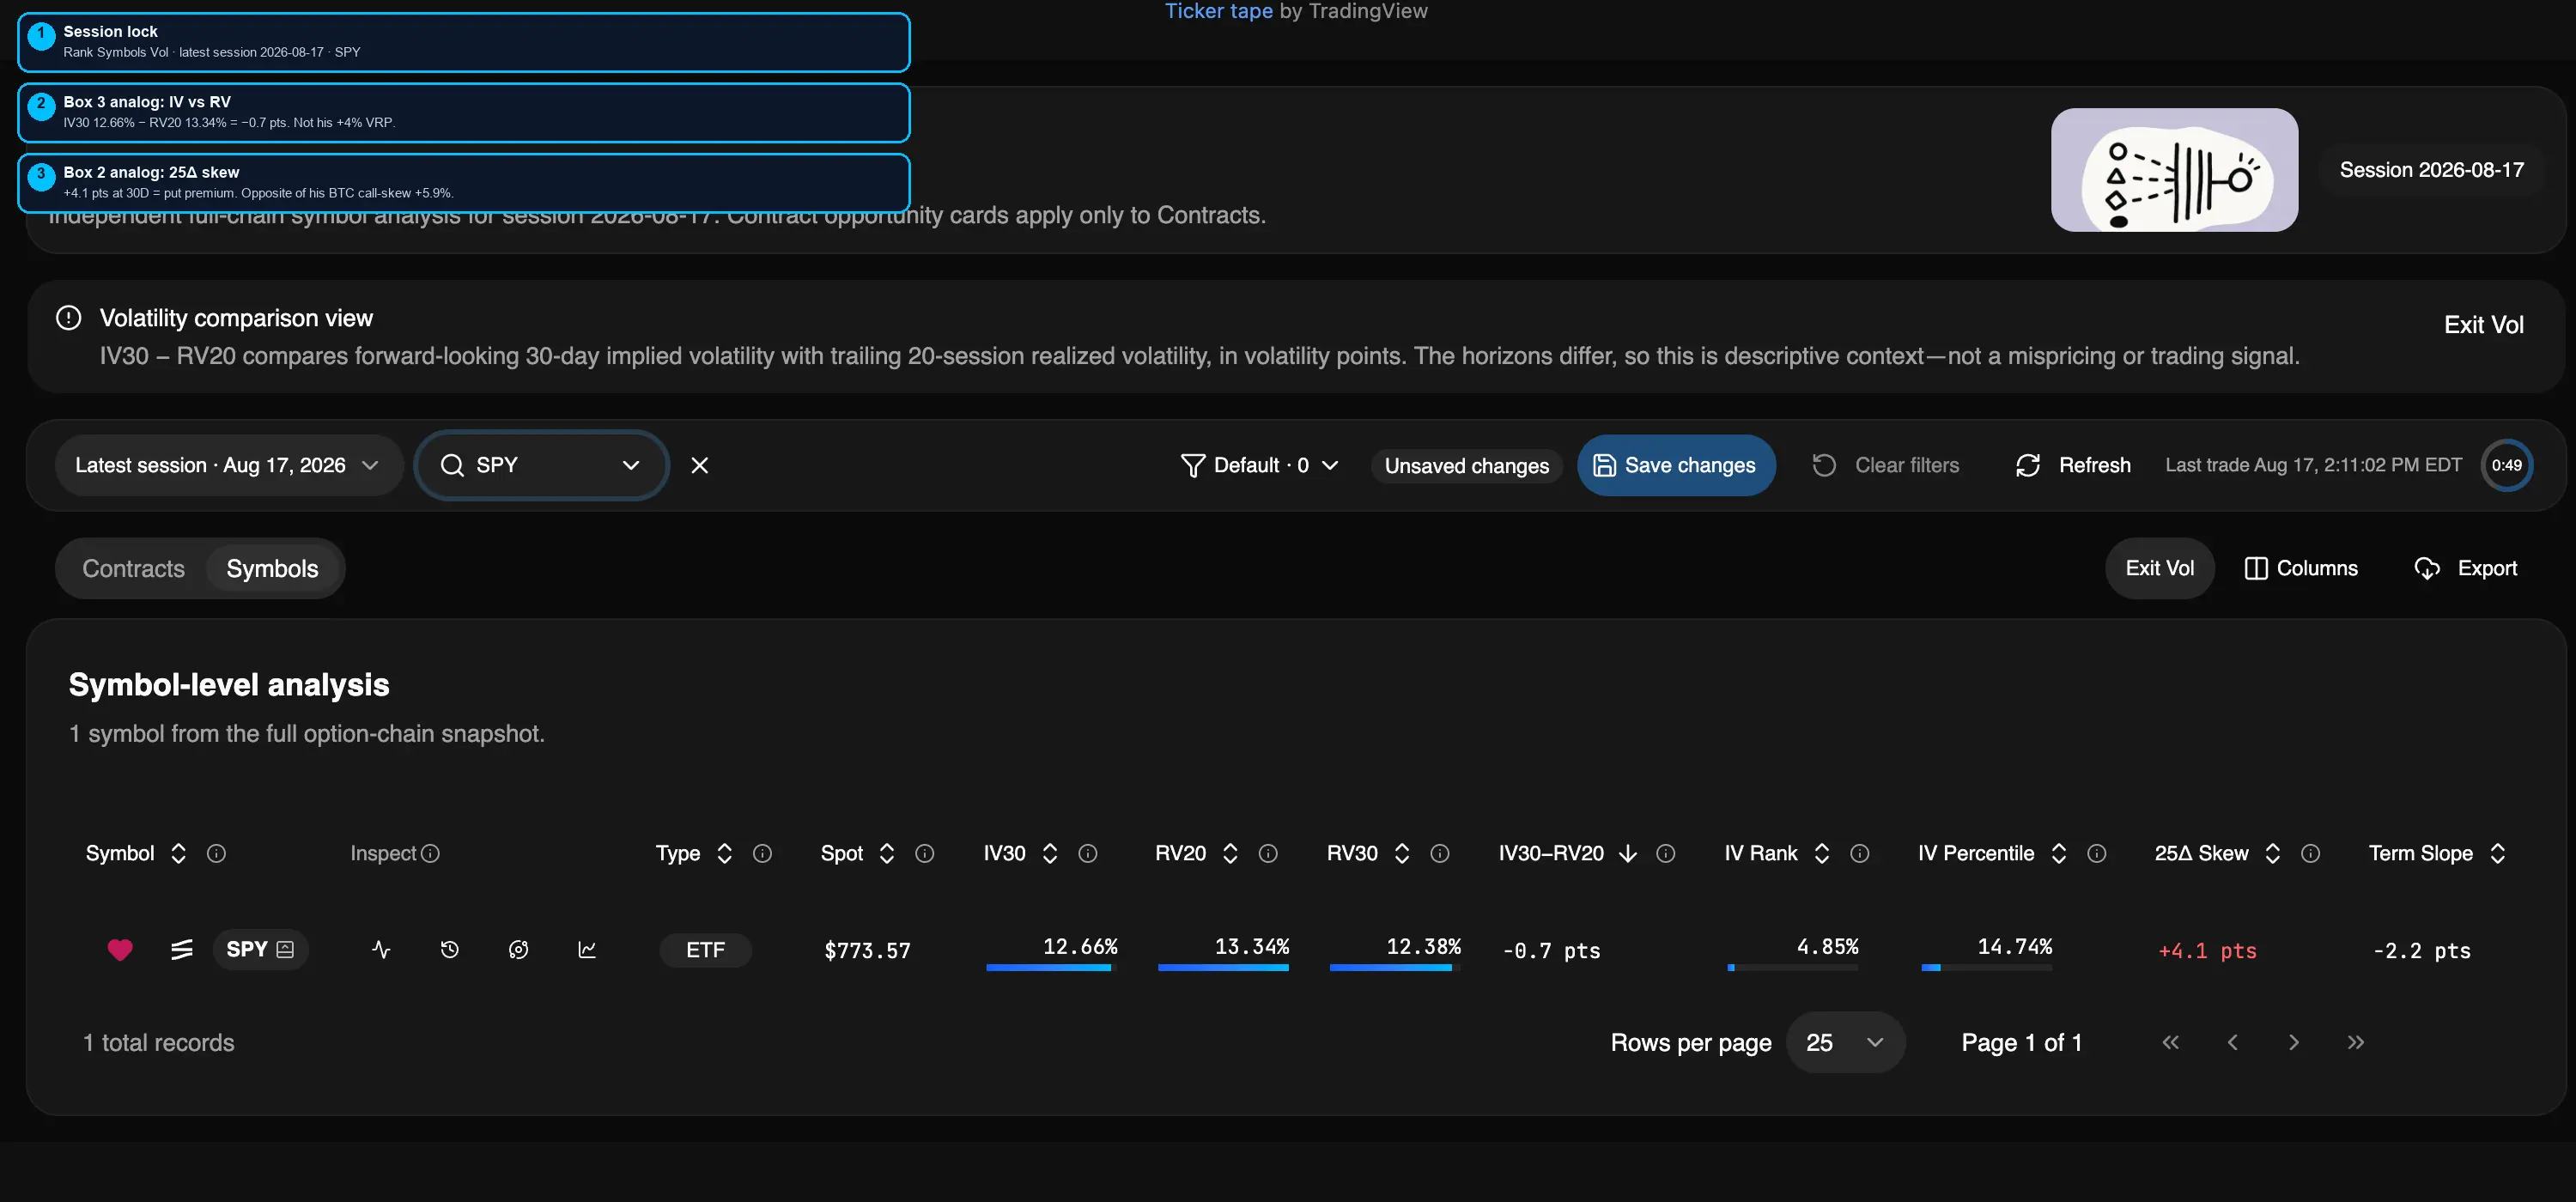
Authenticated test-environment capture. Vol presentation, SPY only, latest session August 17, 2026. IV30 12.66% sits 0.7 points under RV20. 25-delta skew is +4.1 points. This is a dated snapshot, not a live quote.
SPY 25-delta skew on this session is +4.1 pts. In TradingFlow that sign is put premium. His BTC number was call premium. Copying "skew is wide" without the sign would reverse the story.
The Vol drawer keeps the same session's surface next to it:
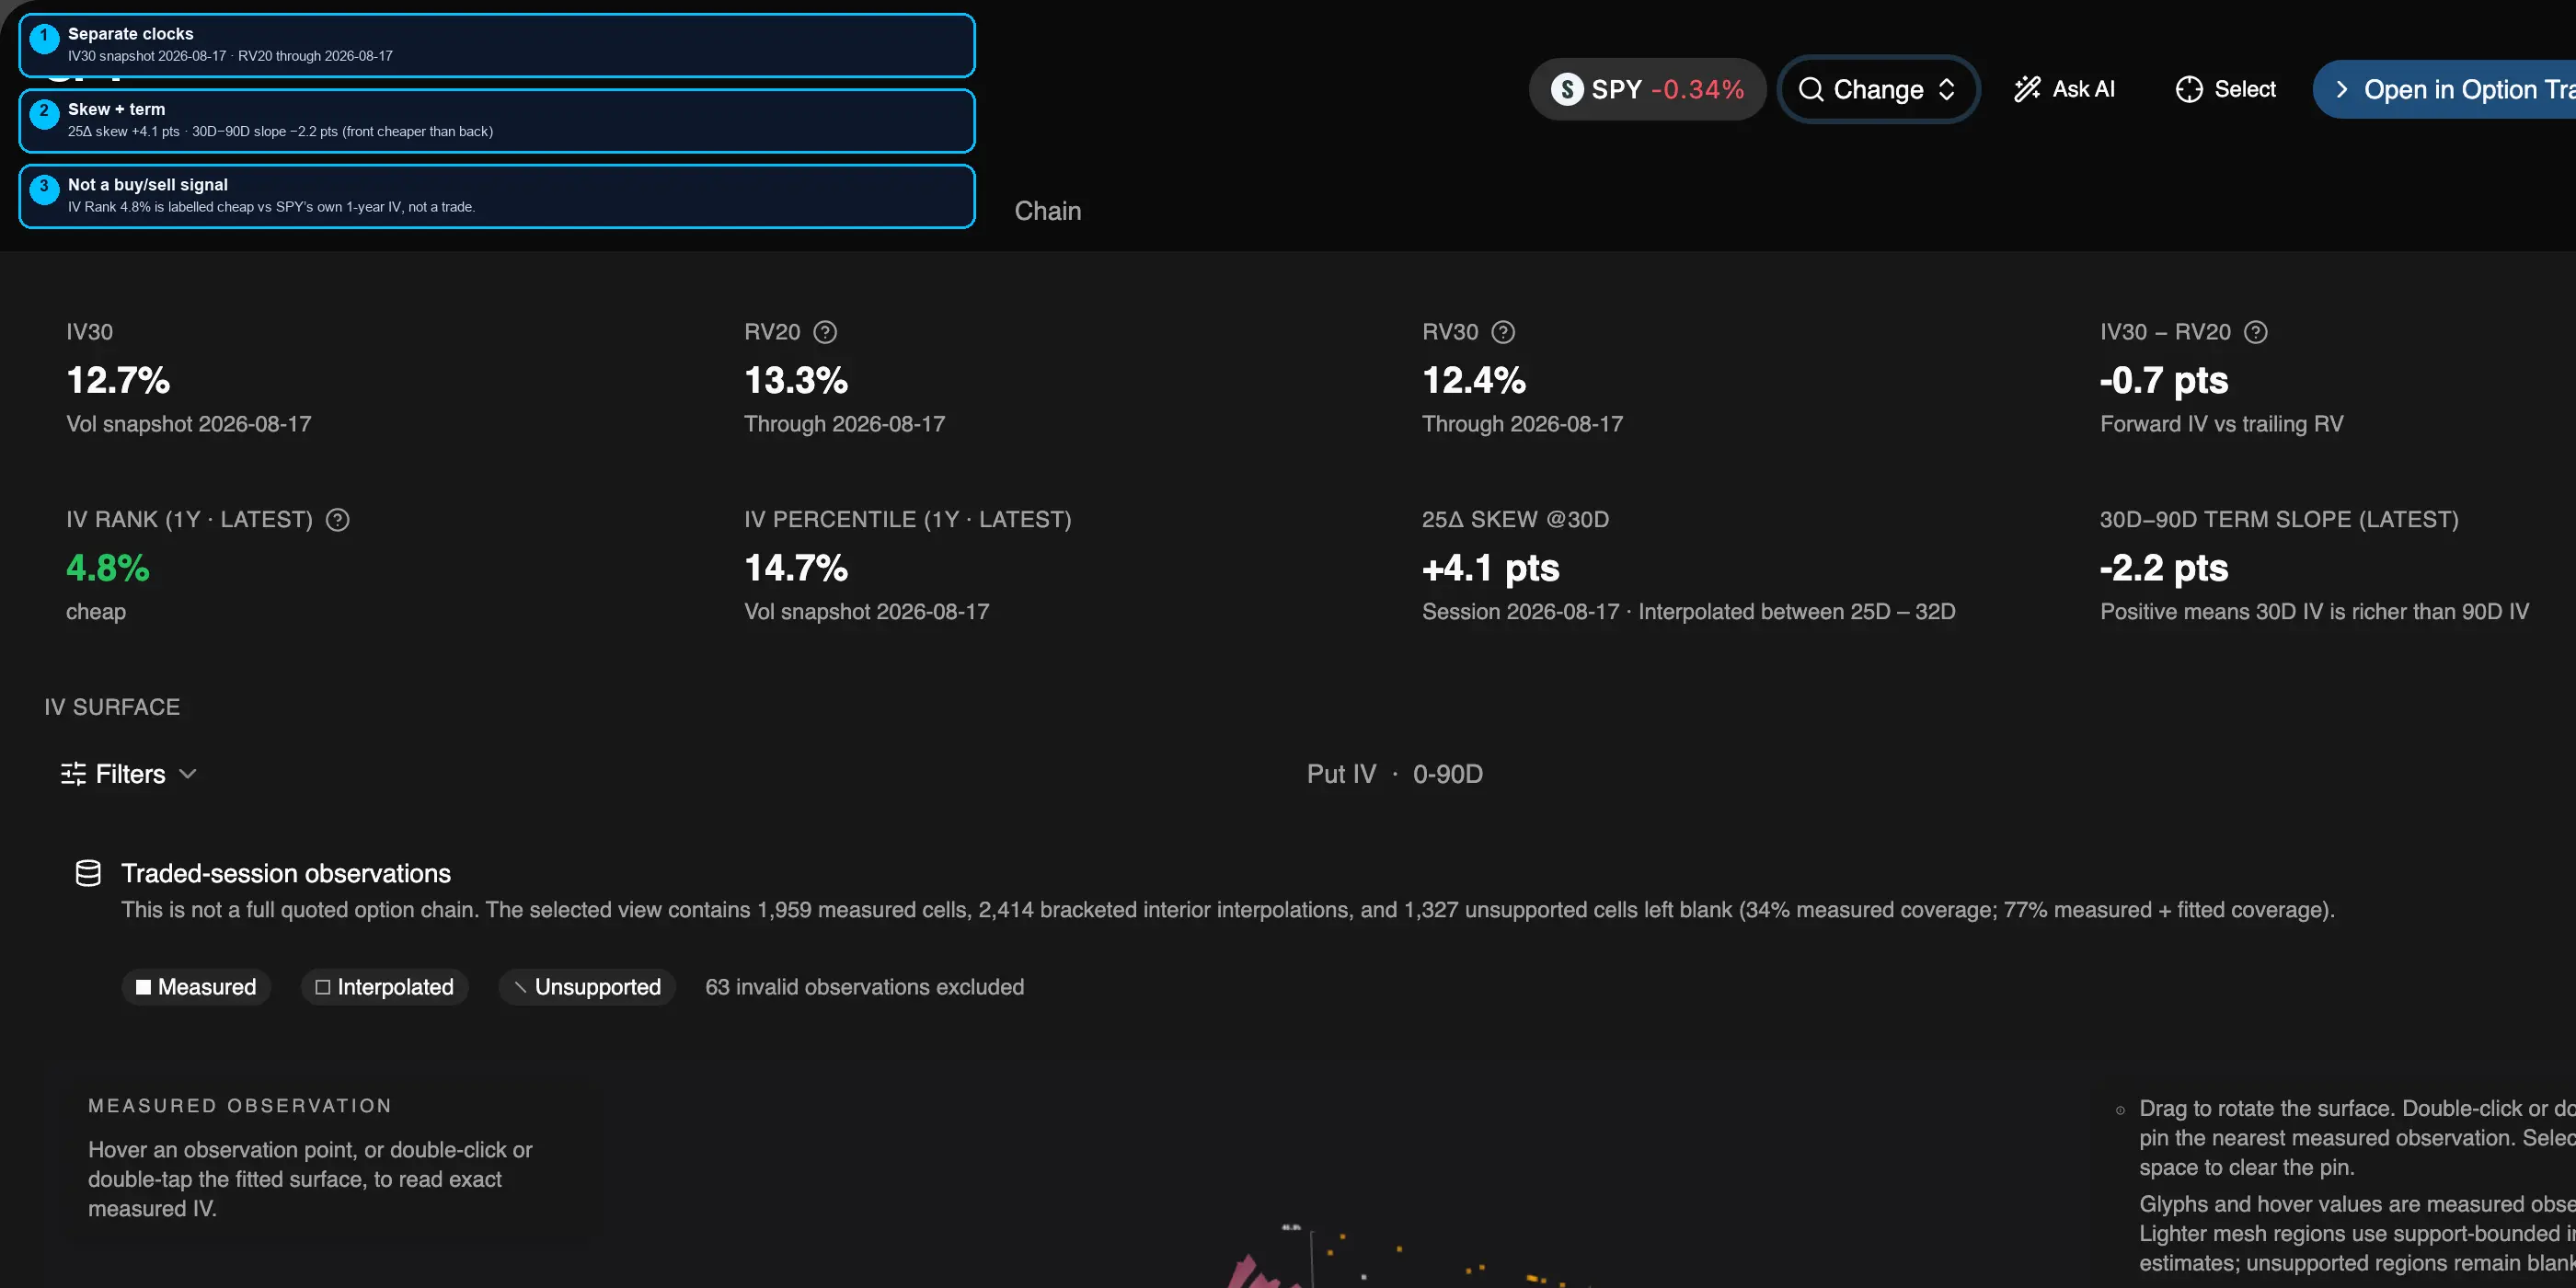
IV30 snapshot date 2026-08-17. RV20 through 2026-08-17. 25-delta skew +4.1 points. Term slope −2.2 points means 30-day IV is cheaper than 90-day IV. The drawer's "cheap" label on IV Rank is versus SPY's own one-year IV, not a buy-vol instruction. See IV30 vs RV20.
3. VRP = IV − HV
This is the line the original note leads with. BTC 21AUG: HV 20.7%, IV 24.7%, VRP about +4%. HV has "collapsed" under 21%; IV looks high versus that HV. ETH 21AUG: HV 27.4%, IV 32.5%, VRP about +5.1%.
Rank's analog is IV30 − RV20. Those are different clocks. His HV is tied to a specific expiry. Ours is a 20-session realized window.
On this SPY snapshot:
- IV30: 12.66% (drawer 12.7%)
- RV20: 13.34% (drawer 13.3%)
- IV30−RV20: −0.7 pts
- IV Rank: 4.85% (drawer 4.8%)
- IV Percentile: 14.74%
His note needs IV above HV to call VRP fat. On this SPY snapshot the signed gap is slightly negative. Two honest readings:
- The clocks disagree, so they can. 21AUG HV is not a 20-session RV20.
- SPY implied volatility is already at a 4.85% IV Rank. That is "low versus its own history," which is a different sentence from "IV is rich versus last month's realized."
Collapsed HV on BTC is not a transfer function onto SPY.
4. Expiry OI path
On BTC he writes 21AUG OI 18,068, with small sells at 68k/72k, and 28AUG OI 62,487. On ETH: 21AUG OI 71,086, 28AUG OI 273,000.
TradingFlow's overnight book is not two Deribit Fridays. Prefer the GEX horizon split, then a named strike's OI on the tape.
On this SPY snapshot the all-expiration gross GEX mix is:
- 0DTE: 15.7%
- Weekly (1-7 days): 34.6%
- Monthly (8-31 days): 15.4%
The chain drawer for this session lists 34 expiries. That is a book with many clocks.
On the tape, the Aug 21 $775 call prints with OI 54,464. The Aug 21 $770 put prints with OI 16,100. The Aug 17 $775 put prints with OI 11,470. Those OI figures are the prior book sitting on the print, not a Deribit two-expiry path.
5. Named tape print
On ETH he names it: 21AUG 1,900 call, 500 lots, labelled a buy (~$9.7K), plus 120 lots of the 2,000 call. Call-side add, in his words.
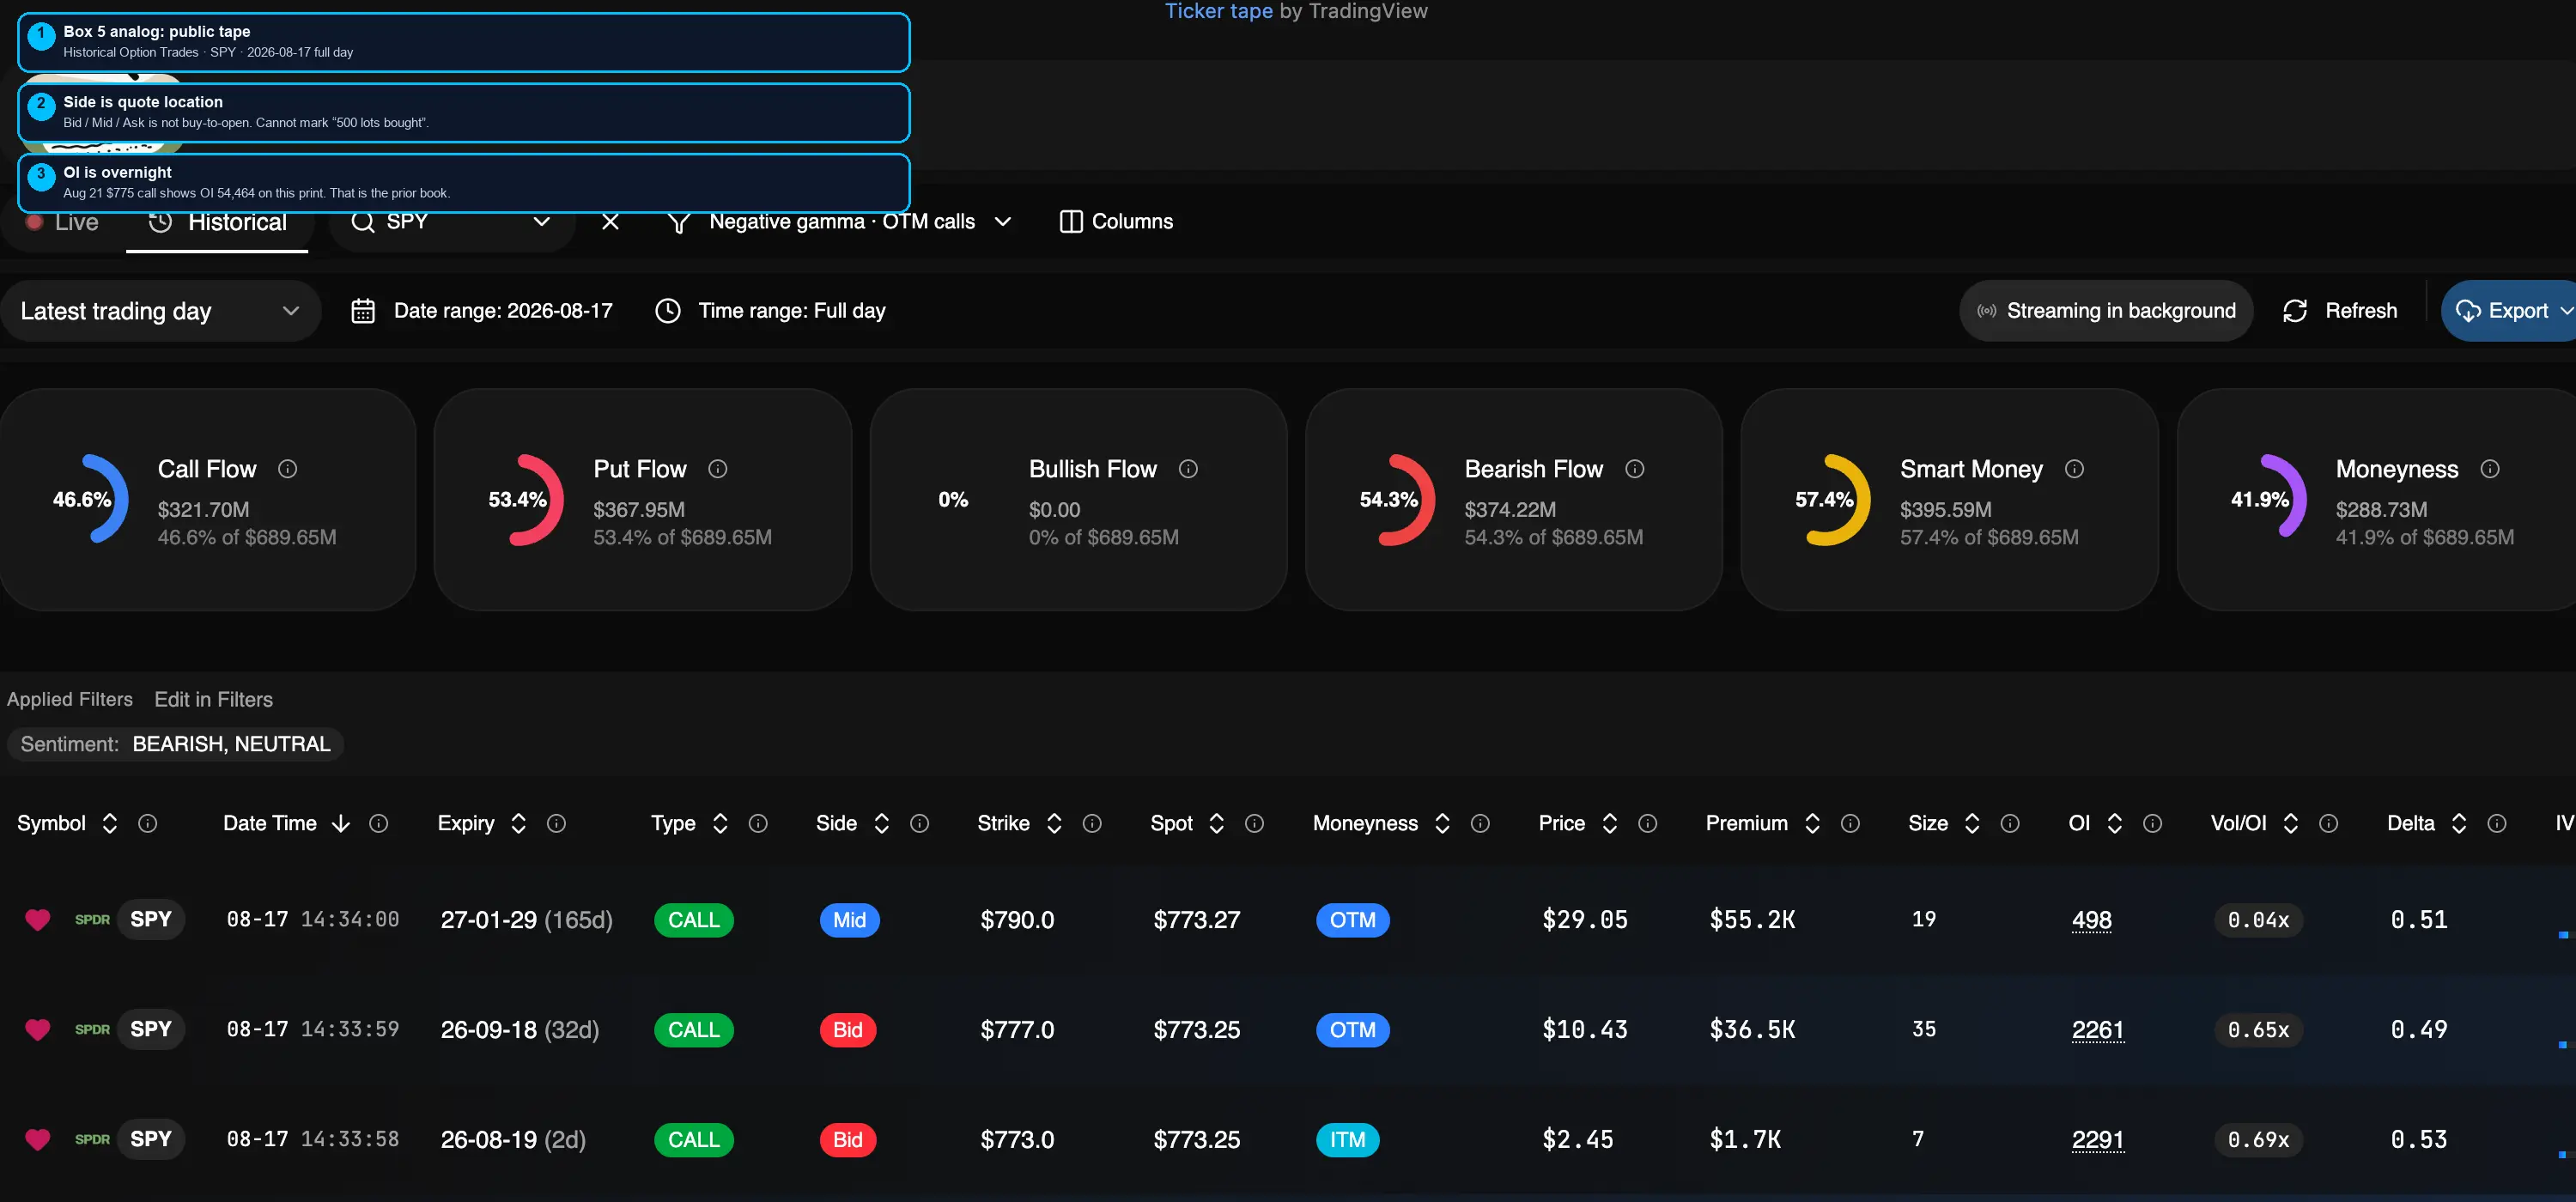
Authenticated test-environment capture. Historical mode, SPY, date 2026-08-17, full day. A saved view on this account still excluded BULLISH sentiment, so the KPI mix is not a complete-session put/call census. Use the rows, not the header percentages. Side is quote location. Open Historical Option Trades and set Symbol = SPY, date = 2026-08-17 yourself.
What the SPY tape can say on this snapshot:
- Visible option flow size on the rows is mostly 1-35 lots, not a 500-lot ETH call.
- Side is Bid / Mid / Ask. That is quote location.
What it cannot say: that anyone "bought" those contracts, that they opened, or that they belong to one book. That is the same evidence-boundary we use on every tape post.
His public US buyer scanner uses a related gate (IV percentile, VRP, priced move versus historical earnings move) and then emits Long Call / Long Put / Long Straddle. This article does not reproduce those buy recommendations.
"RV in the 20s, so switch to +gamma"
A few hours after the daily note, he posted: RV已经降低到2字头,大波应该不远了。调正gamma,准备迎接升波。
On this SPY snapshot the index already reads positive GEX. SPY IV30 is 12.7% with IV Rank 4.8%. The first five boxes can be filled. The sixth sentence does not travel: positive GEX here is structure, not a reason to flip a book, and collapsed BTC HV is not a signal that SPY vol must expand.
The same five boxes, on one snapshot
| Box in the 冰火岛 note | BTC / ETH in the original | SPY, August 17, 2026 |
|---|---|---|
| Gamma pin | BTC near 63k on 21AUG; ETH 1,950-2,000 | Positive GEX. Flip $773.59. 0DTE top $777. Put wall $765 |
| Skew | BTC +5.9% call premium; ETH −0.7% | 25Δ skew +4.1 pts put premium |
| VRP | BTC IV 24.7% vs HV 20.7% (+4%); ETH +5.1% | IV30 12.66%, RV20 13.34%, spread −0.7 pts |
| Expiry OI | BTC 21AUG 18,068 / 28AUG 62,487 | Weekly GEX 34.6%. Aug 21 $775 call OI 54,464 |
| Named print | ETH 1,900C 500 lots, labelled a buy | Many small SPY prints. Side = Bid/Mid/Ask |
Reproduce the checklist
- Open Rank Symbols → Vol → symbol SPY → session August 17, 2026.
- Record IV30, RV20, IV30−RV20, IV Rank, 25Δ skew, term slope. Confirm the IV snapshot date and the RV through-date in the Vol drawer.
- Open Gamma Exposure. Record environment, flip, walls, and the 0DTE / weekly / monthly mix.
- Open Historical Option Trades. Mode Historical, symbol SPY, date 2026-08-17, time range Full day. Clear extra sentiment filters if a saved view is active.
- Write five lines. Stop before "therefore buy/sell."
Related reading
- IV30 vs RV20: see implied and realized volatility side by side
- Direction can be right and calls still lose: the July-August single-name IV crush
- SPY / SPX / QQQ 0DTE evidence loop
Learn more
Open the app
TradingFlow App Home → Rank Symbols for the dated IV / RV / GEX boxes → Historical Option Trades for the tape box.
Educational market-structure research only, not investment advice. Options involve substantial risk of loss.
Related Articles
Direction Can Be Right and Calls Still Lose: The July-August Single-Name IV Crush
Frank trading's August 17 note said mid-July to mid-August was a crowded dispersion unwind, not a routine earnings crush. Rank Symbols shows the same regime on SPY, MSFT, AMZN, and NVDA.
Call Walls, Put Walls, and Pin Days: Evidence Before the Magnet Story
Dual walls and pin narratives dominate social feeds. TradingFlow maps Call/Put GEX Walls, then places same-session flow beside them—without predicting a pin.
IV30 vs RV20: See Implied and Realized Volatility Side by Side
TradingFlow Rank Symbols now compares IV30 with RV20 and RV30, adds a signed IV30−RV20 spread, and preserves the separate dates behind each measure.