
Rank Symbols: GEX Level Map, Option Flow, Call/Put Walls & Volatility Rank
Scan ranked symbols by options flow, GEX, the Level Map, call/put walls, IV vs realized volatility, and inspect chain in drawer. The live GEX screener and flow leaderboard.
The Symbols view of the Rank workbench is a ranked leaderboard of underlying names — stocks, ETFs, and indices. Where the Contracts view answers "which exact option contracts are hot?", Symbols answers a higher-level question: "which names are seeing the most interesting flow right now, and how is each one structurally positioned?"
Both views are built from the same session snapshot of the day's flow, so they stay consistent and connected. You can scan symbols, drill into a name, and continue into its contracts without losing your place. Open it live at Rank Symbols.
Note: The old standalone Option Chain Analysis tool now lives inside this Symbols view and its drawer (the GEX, Vol, Positioning, and Chain tabs). There is no separate page to find — it's all here.
The Symbols view at a glance
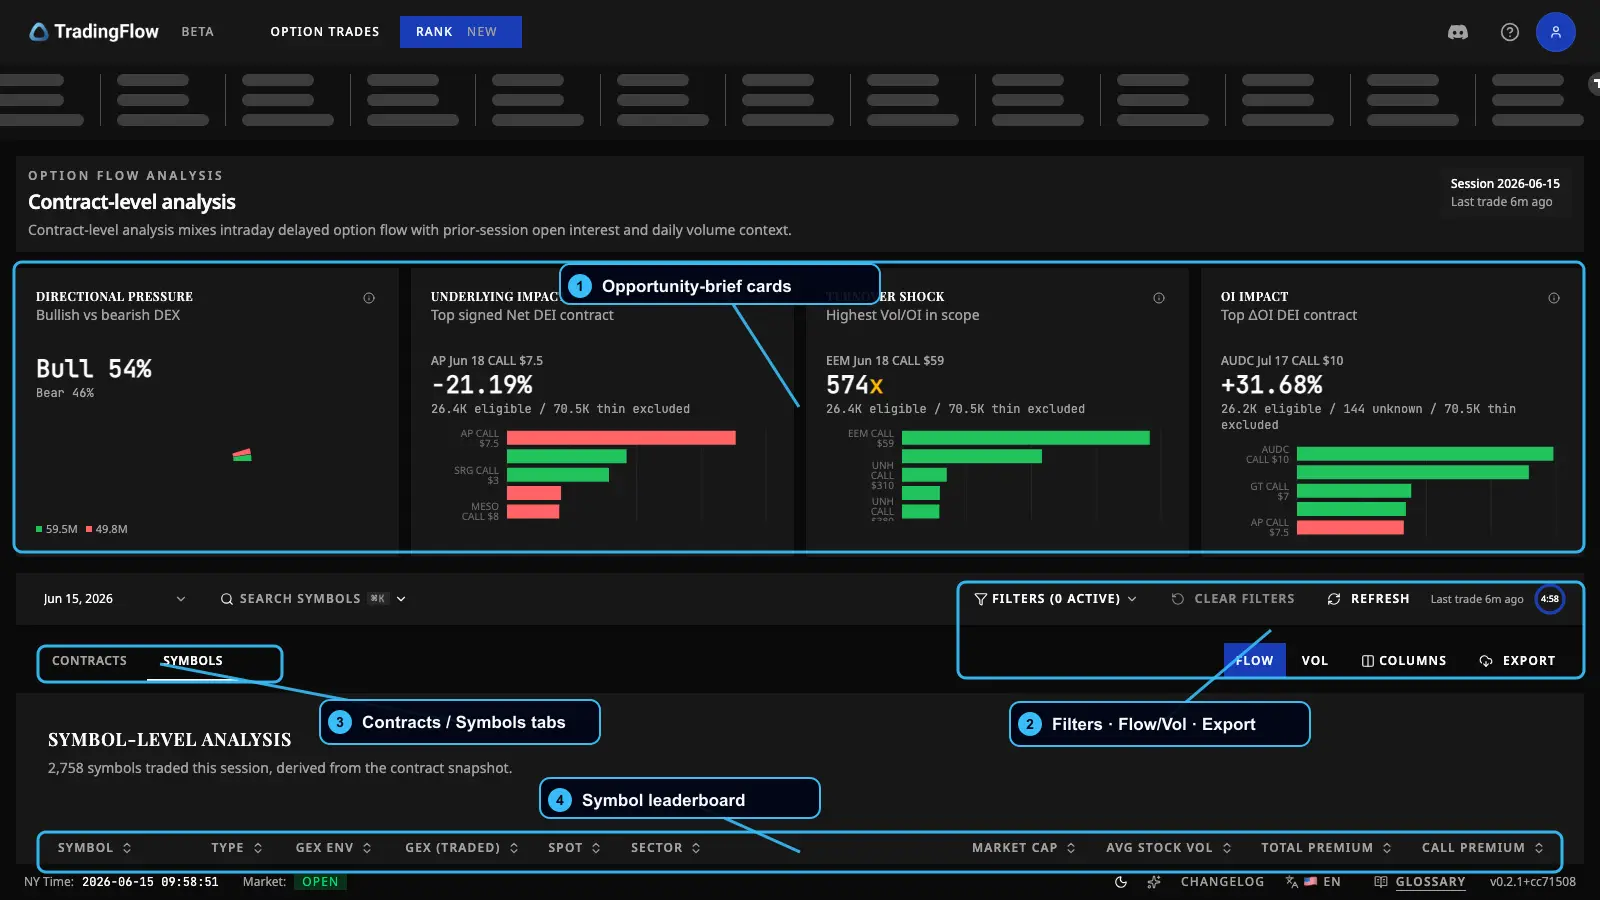 The Symbols leaderboard: session controls and Saved Views on top, the ranked table below, with filters, the Vol toggle, and export in the toolbar.
- Session & Saved Views — which trading session you're looking at (
__latest__or a historical date), plus the saved filter/column view driving the screen (this control is also where filters live — see below). - Contracts / Symbols tabs — switch between contract-level and symbol-level ranking. You're on Symbols.
- Vol toggle, Columns, Export — switch to the volatility-only column preset, manage columns, and export what you see (paid).
- Symbol leaderboard — the ranked table of names, flow signal leading from the left.
Unlike the Contracts view, Symbols does not carry a row of "opportunity brief" summary cards above the table — its headline surface is the ranked table itself. Because Symbols and Contracts share one picture of the day, any watchlist or single-symbol scope you apply here also flows through to the Contracts view. (For watchlists and filters in depth, see Watchlists and Filters.)
Use Symbols when you do not yet know what to study. It is the "start wide" screen: find the names where flow, volatility, and structure are most worth investigating, then narrow down into contracts and individual prints.
Reading the symbol leaderboard
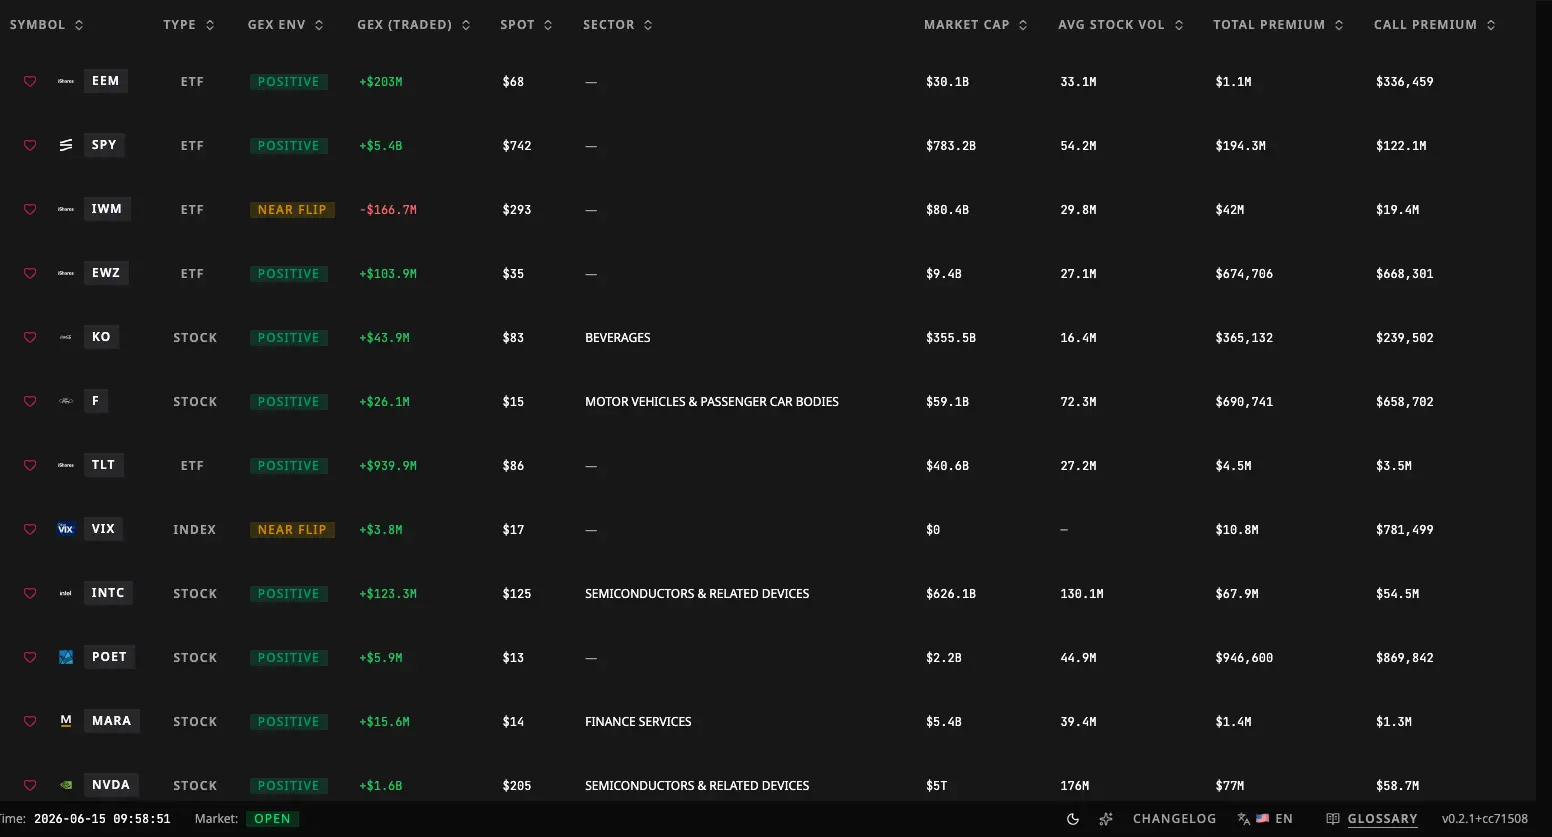 The table is ordered "trader-first": flow signal leads from the left, structure and reference data trail to the right. The four small Inspect icons on each row jump straight into a drawer tab.
The symbol leaderboardRank names by net flow — an emerald DEX signal stacked beneath its blue gamma structure. The tallest tower leads.
The columns are grouped, roughly left to right:
Identity and Inspect
- Symbol and asset type (stock / ETF / index).
- Inspect — four small per-row icons that jump directly into the symbol drawer's Flow, Positioning, Gamma Exposure, or Vol tab, without first landing on Overview.
Flow headline (the signal)
- Premium — total and net premium traded in the name's options. Big premium = big money at work.
- Net DEX — the net directional lean of the flow (bullish positive, bearish negative). See Delta Exposure (DEX).
- Net DEI — how large that directional flow is relative to the name's typical volume, shown as a size. It lets you compare a mega-cap and a small-cap fairly. (DEI is always read as a magnitude; direction comes from Net DEX and Sentiment.)
- Sentiment — a simple bullish / bearish label from the sign of the net flow. A balanced name shows no side.
- Call % — the share of premium spent on calls. High Call % leans bullish; low leans bearish.
You'll also find bullish DEI, bearish DEI, call/put premium, and trade counts here for a fuller read of how the day split.
Beginner reading order:
- Start with Premium and Net DEX to understand size and direction.
- Check Net DEI to ask whether that direction matters relative to normal volume.
- Use Sentiment and Call % to see whether the flow is one-sided or mixed.
- Only then read GEX, IV, sector, earnings, and market cap as context.
Structure (the backdrop)
- GEX Environment — a regime badge describing the name's gamma backdrop (more on this below). This is the only GEX column on the leaderboard; the fuller picture lives in the drawer's GEX tab.
Volatility (where IV is rich or cheap)
- IV30 (30-day implied volatility), IV Rank, IV percentile, skew, term-structure slope, and butterfly.
- RV20 / RV30 — trailing realized (historical) volatility over the last 20 or 30 completed sessions, shown beside IV30 so you can compare what the market is pricing forward against what actually happened.
- IV30 − RV20 — the spread between the two, shown as descriptive context. It is not a mispricing signal or a trade trigger by itself — it is a starting point for asking why implied and realized volatility disagree.
Reference (context)
- Sector, market cap, average stock volume, and earnings — static context to frame the name.
The list mixes recent intraday flow (which drives the ranking) with prior-period structure (open interest, daily volume from the latest snapshot). It's not purely real-time or purely end-of-day, and the app says so — don't misread either part.
Flow vs Vol column presets
The toolbar has a Vol view toggle:
- Flow preset (default) leads with the flow-headline columns above.
- Vol preset hides the flow columns and surfaces symbol, type, spot, sector, earnings, IV30, RV20, RV30, IV30 − RV20, IV Rank, IV Percentile, skew, term slope, and butterfly — sorted by IV30 − RV20 descending. Handy when you're screening purely for volatility.
Column layout, Vol/Flow preset, and sort order can be saved as part of a Rank Saved View (see below) — otherwise they reset on your next visit.
Inspecting a symbol: the drawer
Click any row (or use an Inspect icon) to open the symbol inspection drawer — a detail panel for that one name.
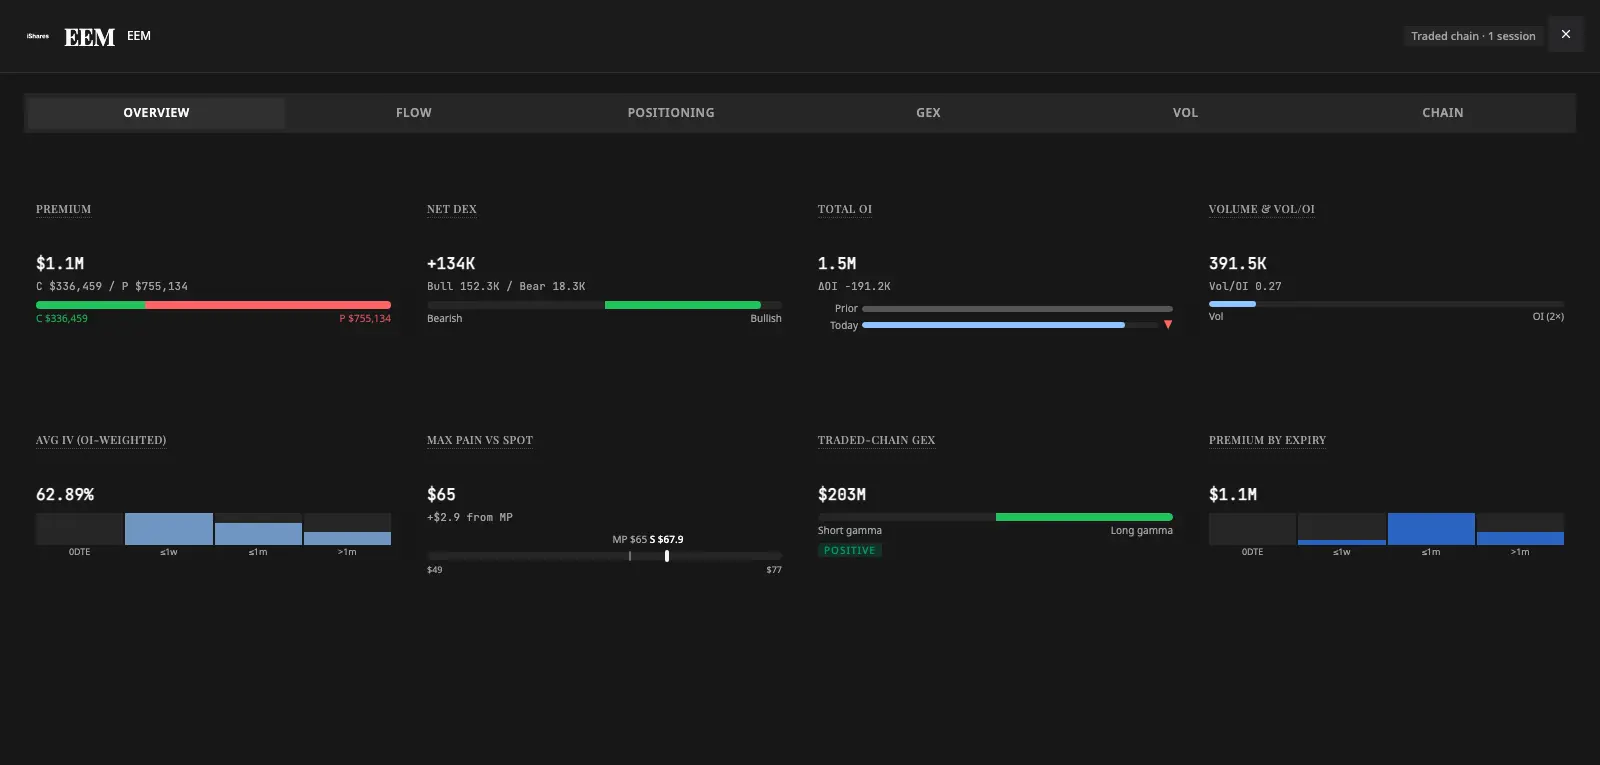 The symbol drawer opens to Overview: premium, Net DEX, open interest, volume/Vol-OI, average IV, max pain, and the GEX Environment badge, all for the selected session.
The header carries the symbol's live price, a Change control to switch names without closing the drawer, an Ask AI control (opens TradingFlow AI grounded in whatever tab you're looking at), a Select control (a crosshair tool for pointing at one card or chart and asking about it directly), and Open in Option Trades. Six tabs:
- Overview — the headline read for the selected symbol and date. (Structural — instant, free.)
- Positioning — open-interest context for the name. (Structural — instant, free.) For more on OI, see Option Chain and OI.
- Gamma Exposure (GEX) — the full-chain dealer-gamma detail, described below. (Structural — instant, free.)
- Vol — the volatility surface, described below. (Structural — instant, free.)
- Chain — the traded-chain structure for the name, which then auto-loads live bid/ask quotes. (The quotes here are intentionally public — guests and free users see them too.)
- Flow — mapped-wall session flow, described below. (This is a paid tab: it sits behind a "Load flow evidence" action and is fetched only when you choose to.)
So the structure side of the drawer (Overview, Positioning, GEX, Vol) is instant and mostly free; the Chain quotes are public; and the deep Flow tab is the paid piece. The drawer and its open tab are shareable by link (for example ?selectedSymbol=SPY&drawerTab=gex), so you can send a colleague straight to a symbol opened to, say, its GEX view.
GEX: the Level Map
Open the Gamma Exposure (GEX) tab for the full structural picture behind the leaderboard's regime badge. Its summary surface is the GEX Level Map: the selected scope's chain-backed levels organized into one actionable read —
- the nearest structural level above spot,
- an exact at-spot node when one exists,
- the nearest level below,
- and the continuous gamma-regime transition (the Flip), reported separately since it's a repriced price level rather than a strike.
Levels that land on the same exact strike merge into a labeled node — Call Wall, Put Wall, Gamma Magnet, 0DTE Top, or Max Pain — each shown with its dollar distance, percent distance, and distance in Daily-ATR terms, plus its share of gross GEX in the selected scope. A Price & GEX Levels chart sits beside the map: real candles (interval selector from 1m up to daily), with optional VWAP and prior-day high/low (PDH/PDL) overlays, a log-scale toggle, a chart layers control (Core / Magnet / Max Pain / 0DTE) that chooses which of the map's levels draw on the chart, a PNG screenshot export, and an external TV link that opens the same symbol on TradingView for free-form analysis.
You can scope both the Level Map and the chart to All expirations, Today · 0DTE, Weekly (1–7 days), or Monthly (8–31 days) — the same scope control drives the Flow tab below.
For how positive and negative gamma shape the tape in the first place, see Greeks & GEX. A couple of things to know: GEX Environment is a paid overlay, it's left out of the free preview, and it only applies to the latest available trading date (for older dates it's cleared with an explanation, since a stale gamma label would be misleading). The same GEX vocabulary is used in Option Trades, so the read stays consistent across the product.
Flow: session flow at the GEX walls
The paid Flow tab answers a specific question: did today's flow actually push toward the Call Wall, toward the Put Wall, or nowhere in particular? Press Load flow evidence once to unlock it.
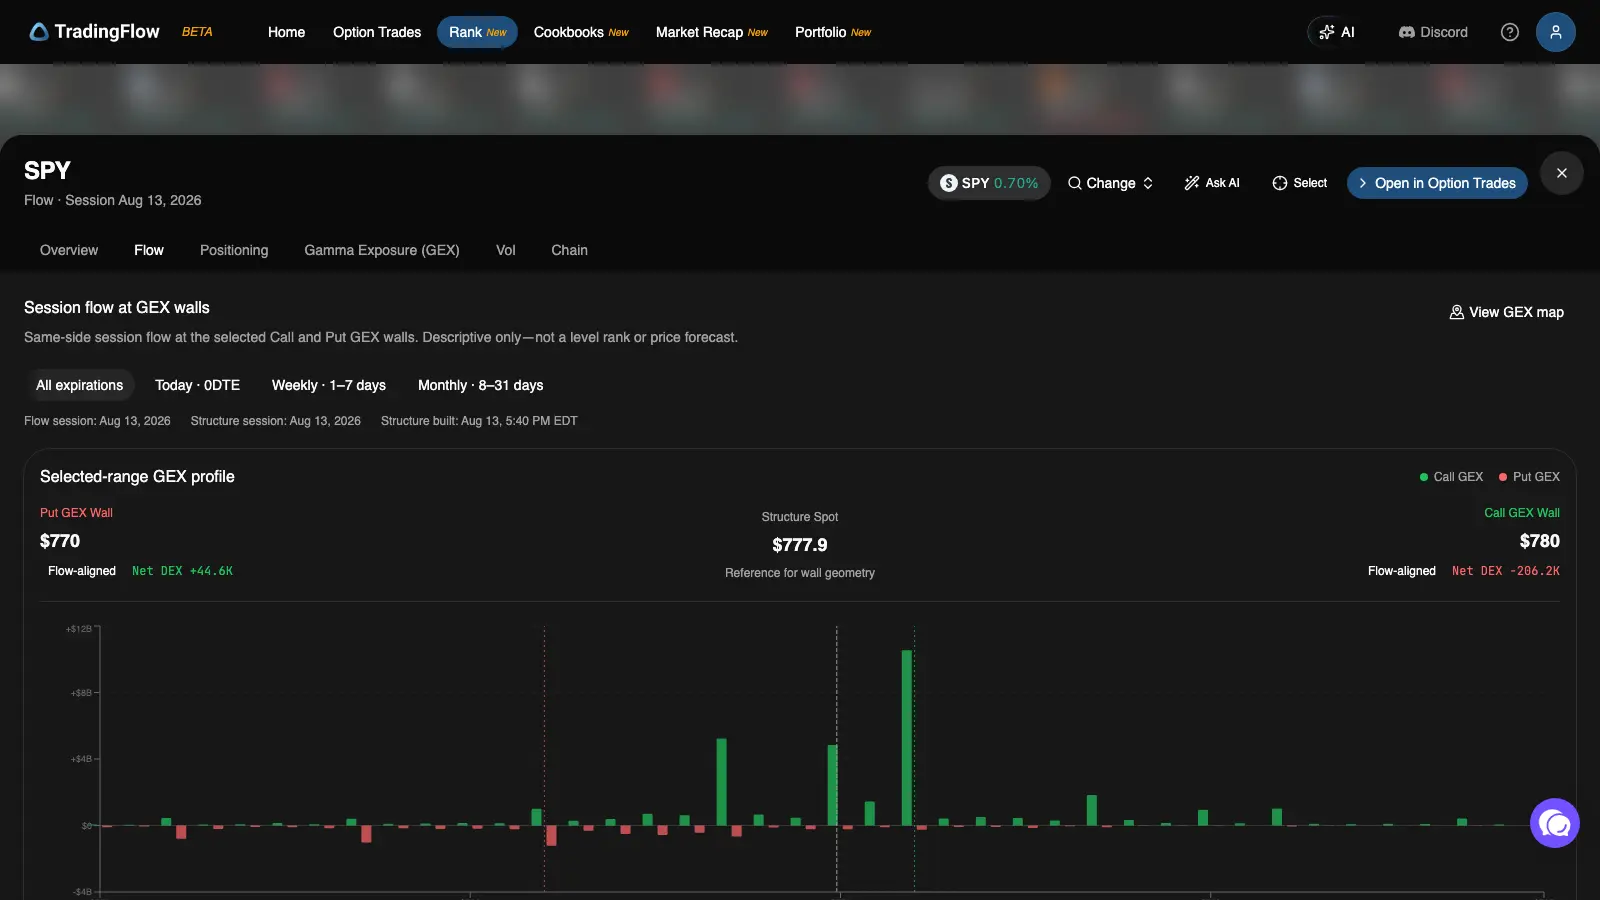 Session flow at GEX walls. Each wall gets its own Net DEX and a transparent Flow-aligned / Flow-against / Mixed status.
- Selected-range GEX profile — a chart-first view of Call and Put GEX by strike, with the Put Wall, Structure Spot, and Call Wall called out and their exact levels.
- Wall audit cards — one for the Put Wall, one for the Call Wall, each stating whether that session's flow was Flow-aligned, Flow-against, or Mixed relative to the wall, along with the Net DEX behind that read, matched contracts, observed prints, and open-interest coverage. Every card explains why through a "Why this status?" link — this is descriptive evidence, never a hold/break forecast or a probability.
- 30-session flow history — the existing symbol-wide daily trend, collapsed by default; it appears once there's enough history to be useful and isn't filtered by the wall scope above.
Use the same All / 0DTE / Weekly / Monthly scope switch here as on the GEX tab — changing it updates the wall map, the audit cards, and the GEX tab together, so you're always reading the same window of the chain.
Vol: implied vs. realized, and the surface
The Vol tab separates two different questions: is volatility rich or cheap right now (this session), and what does the full volatility surface look like (a standing snapshot of the chain).
- IV Rank and IV Percentile are labeled as one-year context; the session's skew and term slope are labeled with their own date, so you never mistake a longer-horizon stat for a same-day one.
- The IV30 vs. RV20/RV30 comparison from the leaderboard reappears here with more room, alongside the spread.
- The implied-volatility surface is built from contracts actually observed trading in the session, and every cell is honestly classified as Measured, Interpolated (a small, well-supported gap), or Unsupported (a gap too wide, or too far out, to estimate responsibly) — a public flat heatmap shows this classification, and paid users additionally see a 3D surface that can be expanded to full screen. This is descriptive structure, not a forecast or an event detector.
Saved Views and historical sessions
Two capabilities carry across both Rank tabs at once, saved from a single Rank saved views dialog (opened from the session/view control in the toolbar):
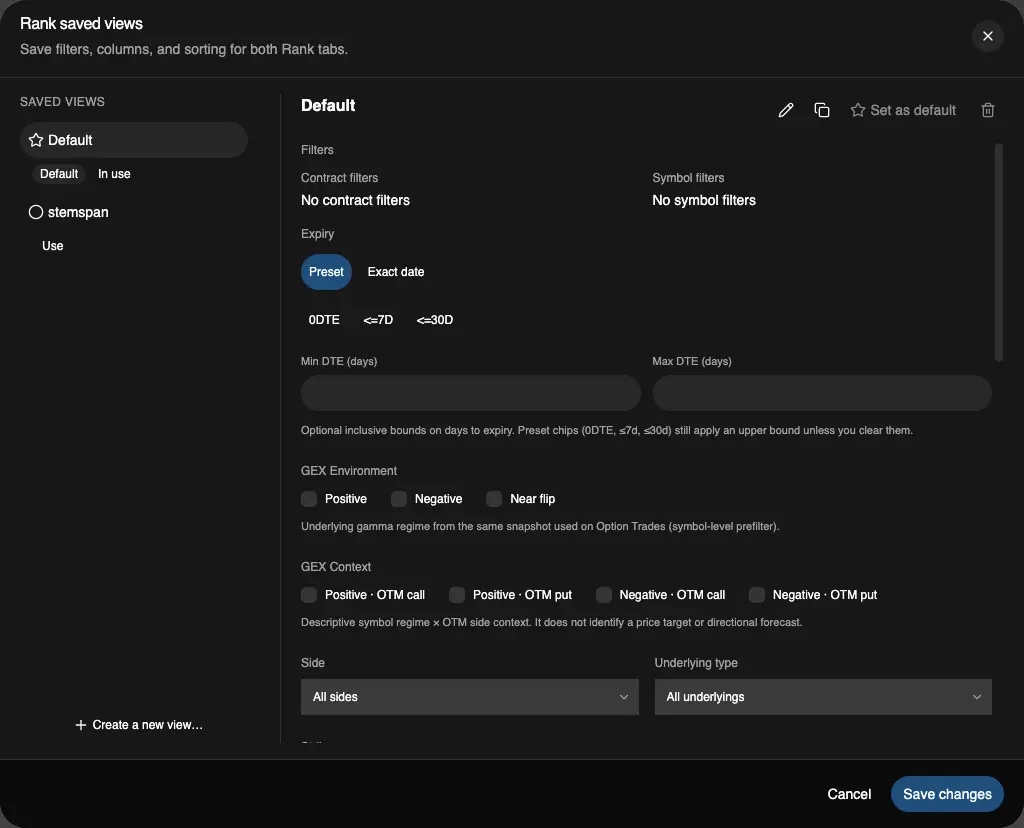 Saved Views cover filters, column layout, and sort order for both Contracts and Symbols in one payload — including the GEX Environment and GEX Context filters shown here.
- Saved Views — a paid, account-owned way to store your filters plus each tab's column layout and sorter together, with one view marked Default (loads automatically) and one marked In use (the active session). Rank Contracts covers the full mechanics — creating, renaming, and reverting a view — in depth; everything there applies here too, since one view always covers both tabs.
- Historical sessions — instead of only
__latest__, a paid user can pick any date retained by both Rank data sources. A historical session is settled: it stays fixed and does not auto-refresh, and it stays selected as you move between Contracts and Symbols. If a requested date stops being available, Rank keeps showing the date you asked for along with Retry and Go to Latest — it never silently substitutes a different day.
Free preview vs paid
The boundary is the same as the Contracts view — the look is free; changing and going deep is paid:
Everyone (guests and free users) can:
- Browse the default ranked symbol leaderboard and page through it.
- Open the symbol drawer shell and its structural tabs (Overview, Positioning, GEX, Vol, Chain).
- See live bid/ask quotes in the Chain tab — a deliberate public exception.
Paid users additionally can:
- Change the sort and apply filters (including the advanced filter panel and watchlist/symbol scope).
- Load the drawer's Flow tab, including the mapped Call/Put wall evidence.
- Save and reuse Saved Views, and select a historical session instead of the latest one.
- Export the cross-filtered symbol cohort.
- Use the Open in Option Trades handoff.
Any paid-only action you attempt as a free user routes through a single prompt to sign in or upgrade — it never silently fails.
The preview is still useful for learning: scan the default list, open drawers, and practice writing the "what stands out / what confirms it / what could weaken it" note before you use paid controls to reshape the cohort.
Handoff to Option Trades
When a name stands out and you want the trade-by-trade tape, the drawer header has an Open in Option Trades control. For paid users it carries the symbol forward into Option Trades — already scoped to that name, in the right live or historical mode, using the same effective session (a historical drawer opens Historical on that exact date). Guests land on the public Option Trades preview. Only the symbol identity is carried forward; nothing is duplicated onto the rank rows.
What to do next
You now know how to scan names, read each one's flow and gamma backdrop, and inspect any symbol before acting. Next, learn to shape the leaderboard to exactly what you care about in Watchlists and Filters — see the same GEX picture packaged as a guided narrative report in Cookbooks & Market Recap — or jump straight to the tape with Option Trades.