
We Verified the Viral $7M Memory Put Trade. The Tape Needs Context.
TradingFlow’s historical option tape matches the six contracts and $422,135 gross premium in a viral memory-stock put post—but not its one-month, 40%-drop narrative.
On July 29, 2026, 0xKevin00 posted a long note about a basket of memory-stock puts. This article follows that post's six contracts, then puts them on TradingFlow's historical option flow tape.
这次他一口气卖了 $700 万的存储板块 PUT,他在赌一个月后存储价格再跌 40%。跌不到,他白赚 $42 万「利息」;真跌到了,他就用骨折价接货。

Original post from 0xKevin00, July 29, 2026. This establishes the claims being followed: about $7 million of puts, a one-month 40% drop framing, $422,000 called "interest," and the MU $660 example. It does not authenticate the trader, prove execution, or identify whether the contracts were opened or closed.
The original then walks three endings (expire worthless and keep $422k; get assigned MU at an effective $627; worst case about $6.63 million of stock) and says the 248 contracts filled across 21 prints. The image listed six series. Those quantities and gross premiums match the tape. The 40% framing does not.
The tape supports a large basket of put prints. It does not independently prove the trader's identity, that every contract was sold to open, or the trader's intent. The basket is also neither entirely memory-stock exposure nor entirely one-month exposure. Selling a put is not a direct bet that the stock will fall.
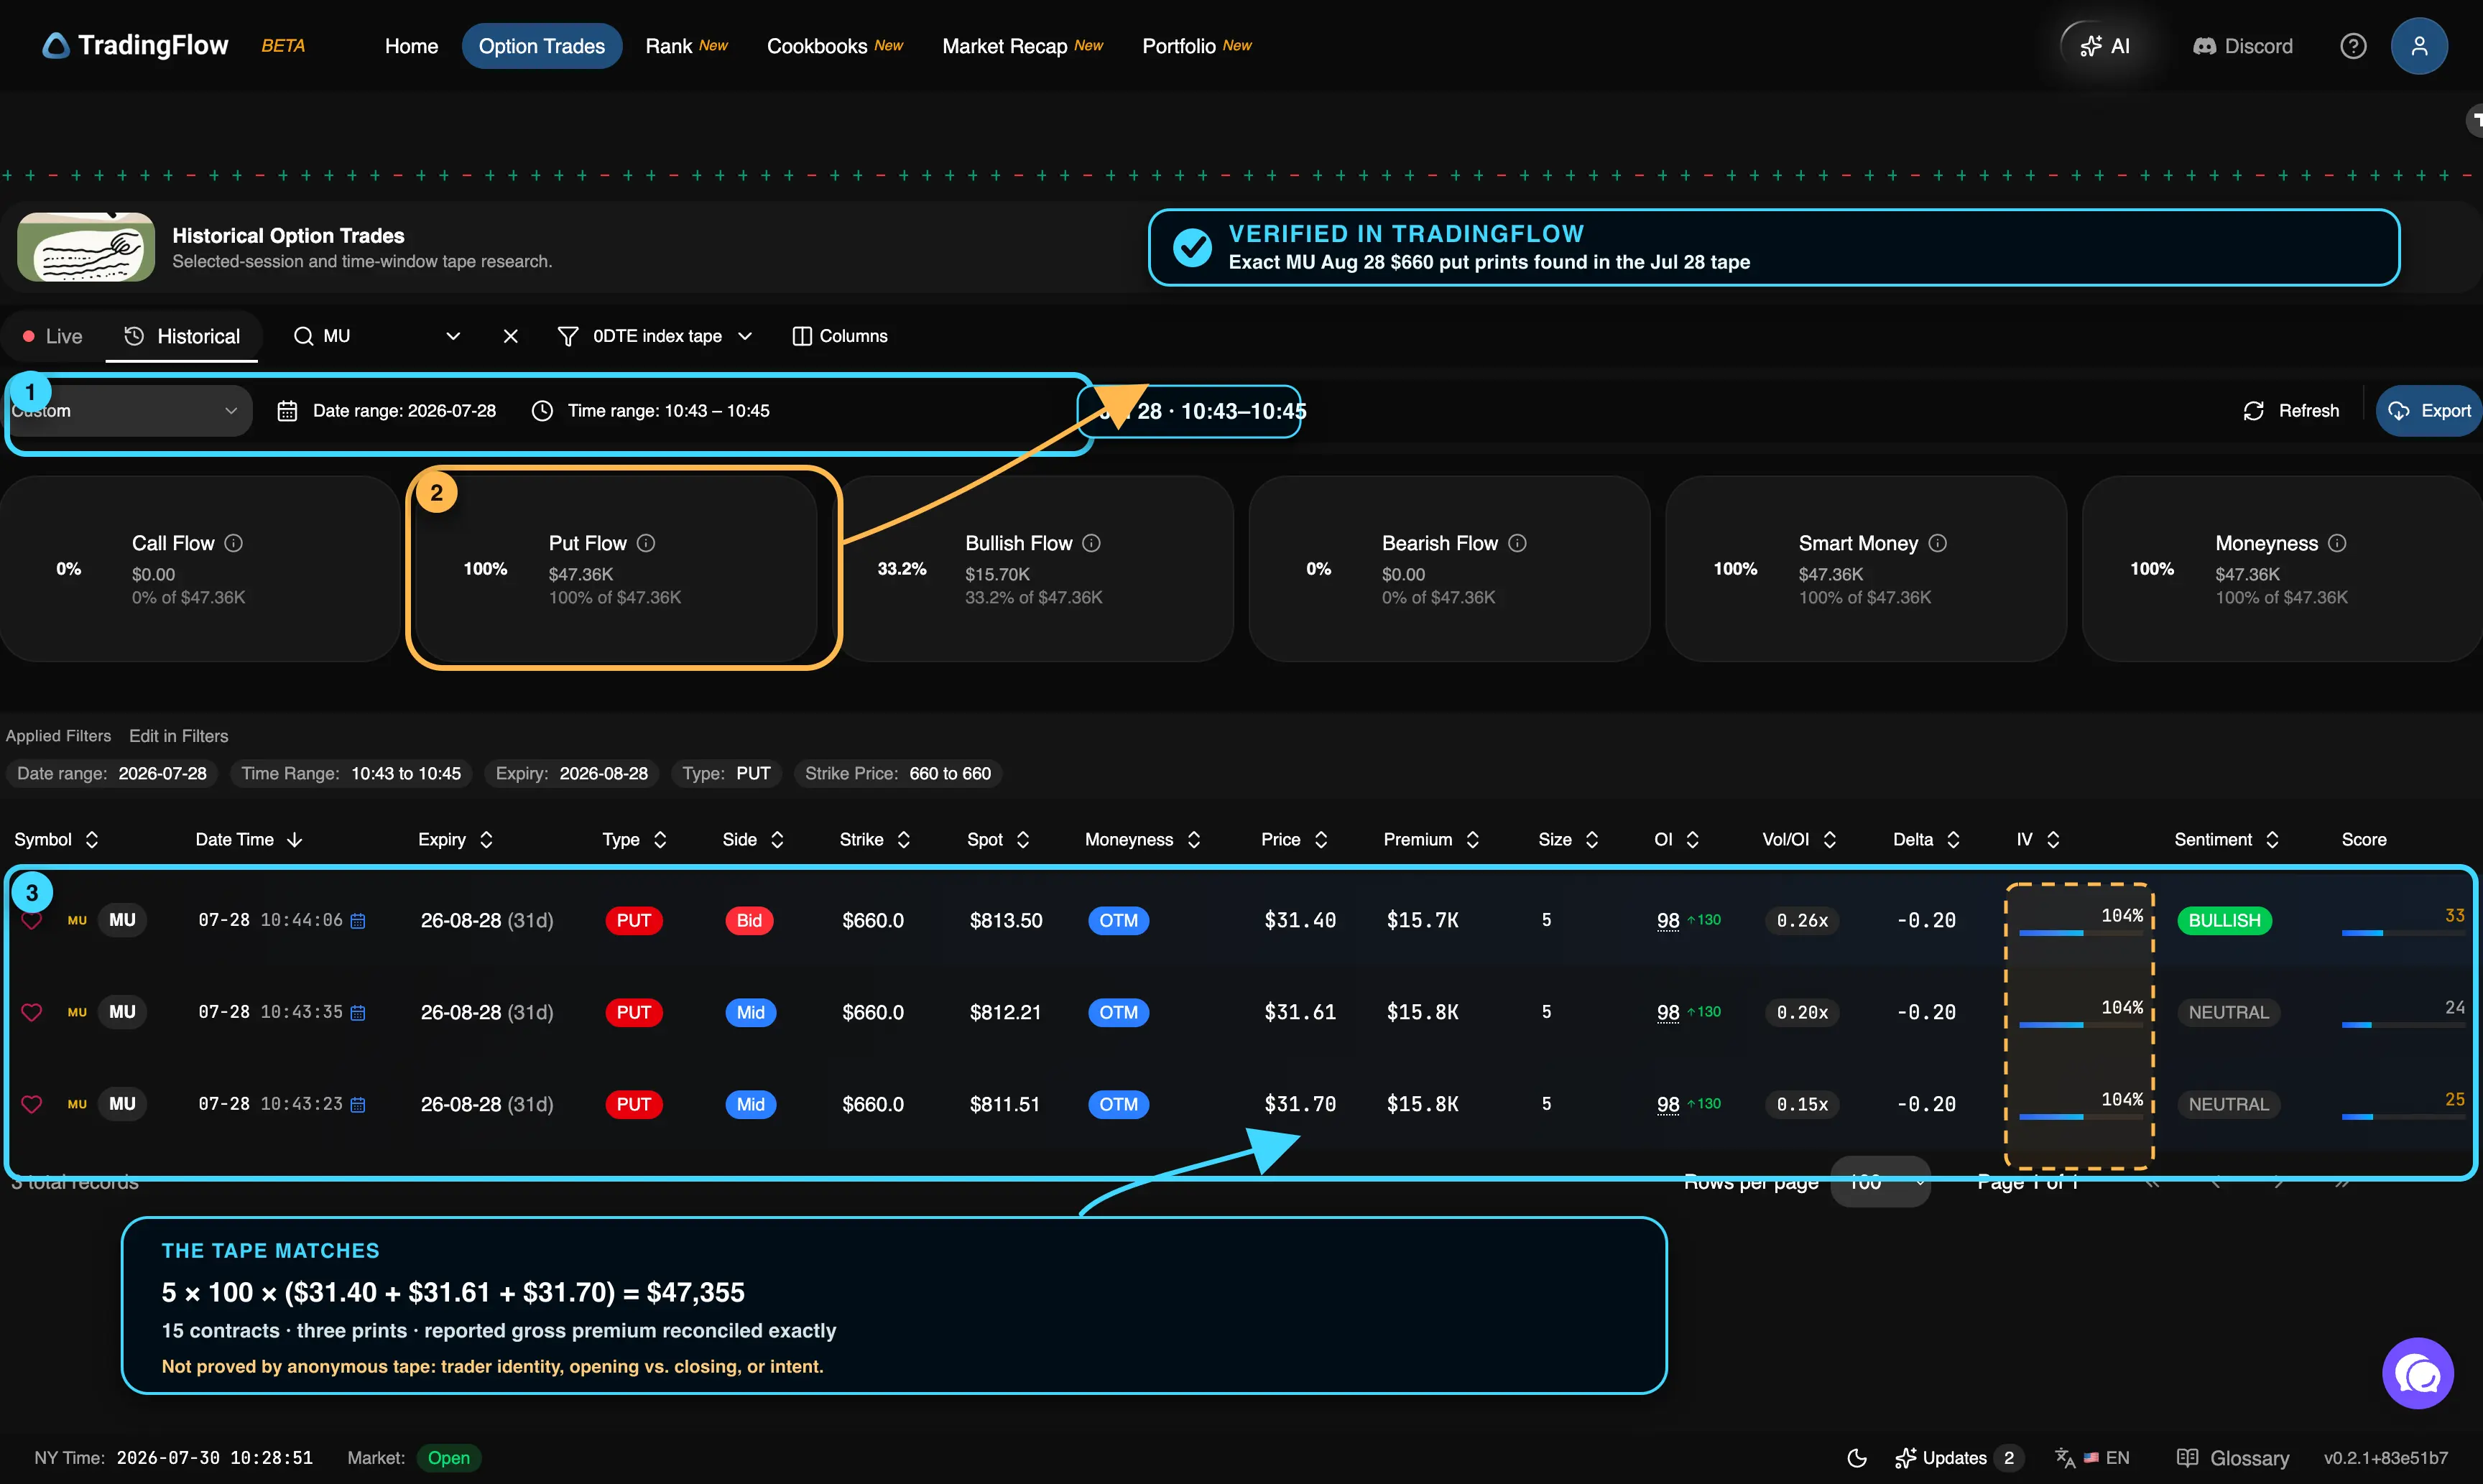
Evidence from TradingFlow Historical Option Trades. The three MU Aug. 28, 2026 $660 put prints total 15 contracts and $47,355 in gross premium. The annotations identify the filters and arithmetic; the underlying screenshot is otherwise unchanged.
What matched
The source image listed six option series. Filtering the July 28, 2026 tape by symbol, expiration, and strike produced the same quantities and gross premiums:
| Underlying | Expiration | Put strike | Contracts | Gross premium | Exercise obligation |
|---|---|---|---|---|---|
| EWY | Aug. 28, 2026 | $135 | 150 | $89,860 | $2,025,000 |
| MU | Aug. 28, 2026 | $655 | 15 | $43,230 | $982,500 |
| MU | Aug. 28, 2026 | $660 | 15 | $47,355 | $990,000 |
| MU | Mar. 19, 2027 | $400 | 25 | $80,725 | $1,000,000 |
| SNDK | Aug. 28, 2026 | $750 | 13 | $64,285 | $975,000 |
| SNDK | Feb. 19, 2027 | $360 | 30 | $96,680 | $1,080,000 |
| Total | 248 | $422,135 | $7,052,500 |
The exercise obligation is straightforward:
strike × 100 shares × contracts
If all six positions were short puts and every contract were assigned, the gross cash required to buy the shares would be $7,052,500.
The source image also reported $168.50 in fees. That figure is not observable in public market data, but its arithmetic checks:
- Gross premium: $422,135
- Reported fees: $168.50
- Net premium: $421,966.50
- Exercise obligation minus net premium: $6,630,533.50
That is where the viral post’s “about $6.63 million” figure comes from.
The clearest match: MU $660 puts
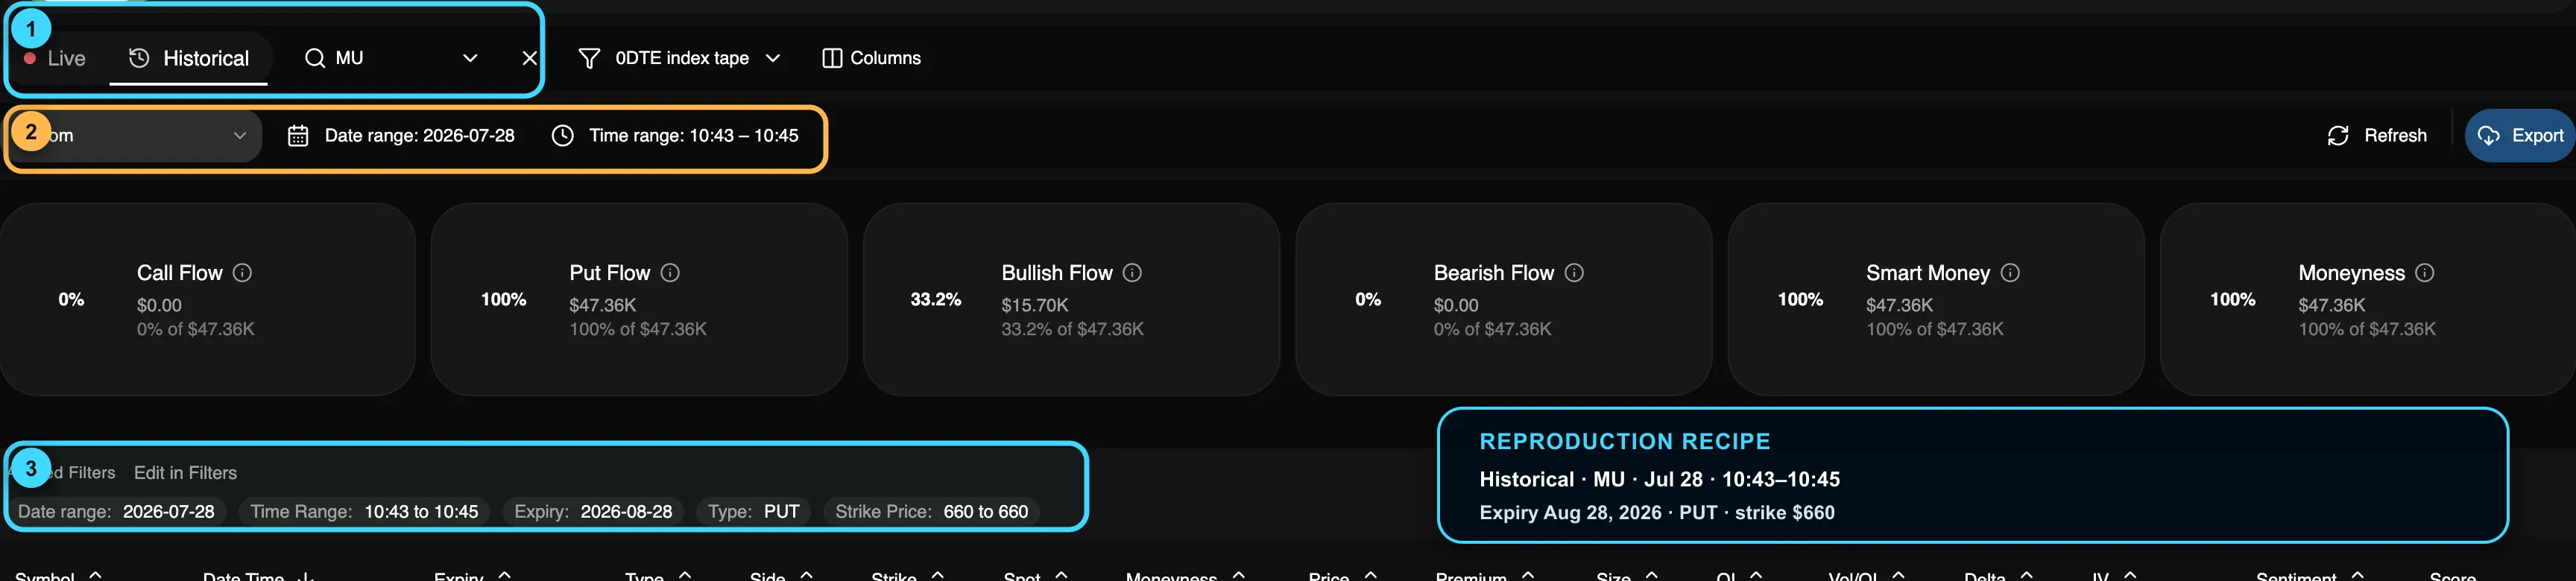
The exact filter recipe used in the authenticated test-app verification. To reproduce it publicly, open Historical Option Trades in TradingFlow, sign in, select Historical, and apply the same controls shown above.
Use these settings:
- Symbol: MU
- Date range: July 28, 2026
- Time range: 10:43–10:45 New York time
- Expiration: August 28, 2026
- Type: PUT
- Strike price: 660 to 660
The annotated screenshot isolates the MU Aug. 28 $660 puts between 10:43 and 10:45:
| Time | Contracts | Option price | Gross premium | Tape side | IV |
|---|---|---|---|---|---|
| 10:43:23 | 5 | $31.70 | $15,850 | Mid | 104% |
| 10:43:35 | 5 | $31.61 | $15,805 | Mid | 104% |
| 10:44:06 | 5 | $31.40 | $15,700 | Bid | 104% |
| Total | 15 | $31.57 weighted average | $47,355 |
The reconciliation is exact:
5 × 100 × ($31.70 + $31.61 + $31.40) = $47,355
The same process reconciled the other five reported series. This is strong evidence that the source image was built from real market prints rather than invented numbers.
It is not a broker confirmation. Public tape is anonymous, and a Bid or Mid label describes where a print occurred relative to the quoted spread. It does not reveal the account, prove sale-to-open, or tell us whether another leg existed elsewhere.
What open interest adds—and what it cannot prove
The same TradingFlow view adds a useful second layer. Each MU $660 row shows OI 98 with a green ↑130 comparison. In other words, the app found a positive open-interest change after the trade-time snapshot. TradingFlow’s own glossary describes OI as an overnight-updated measure, so this is a next-session confirmation of net contract creation—not an intraday open/close flag.
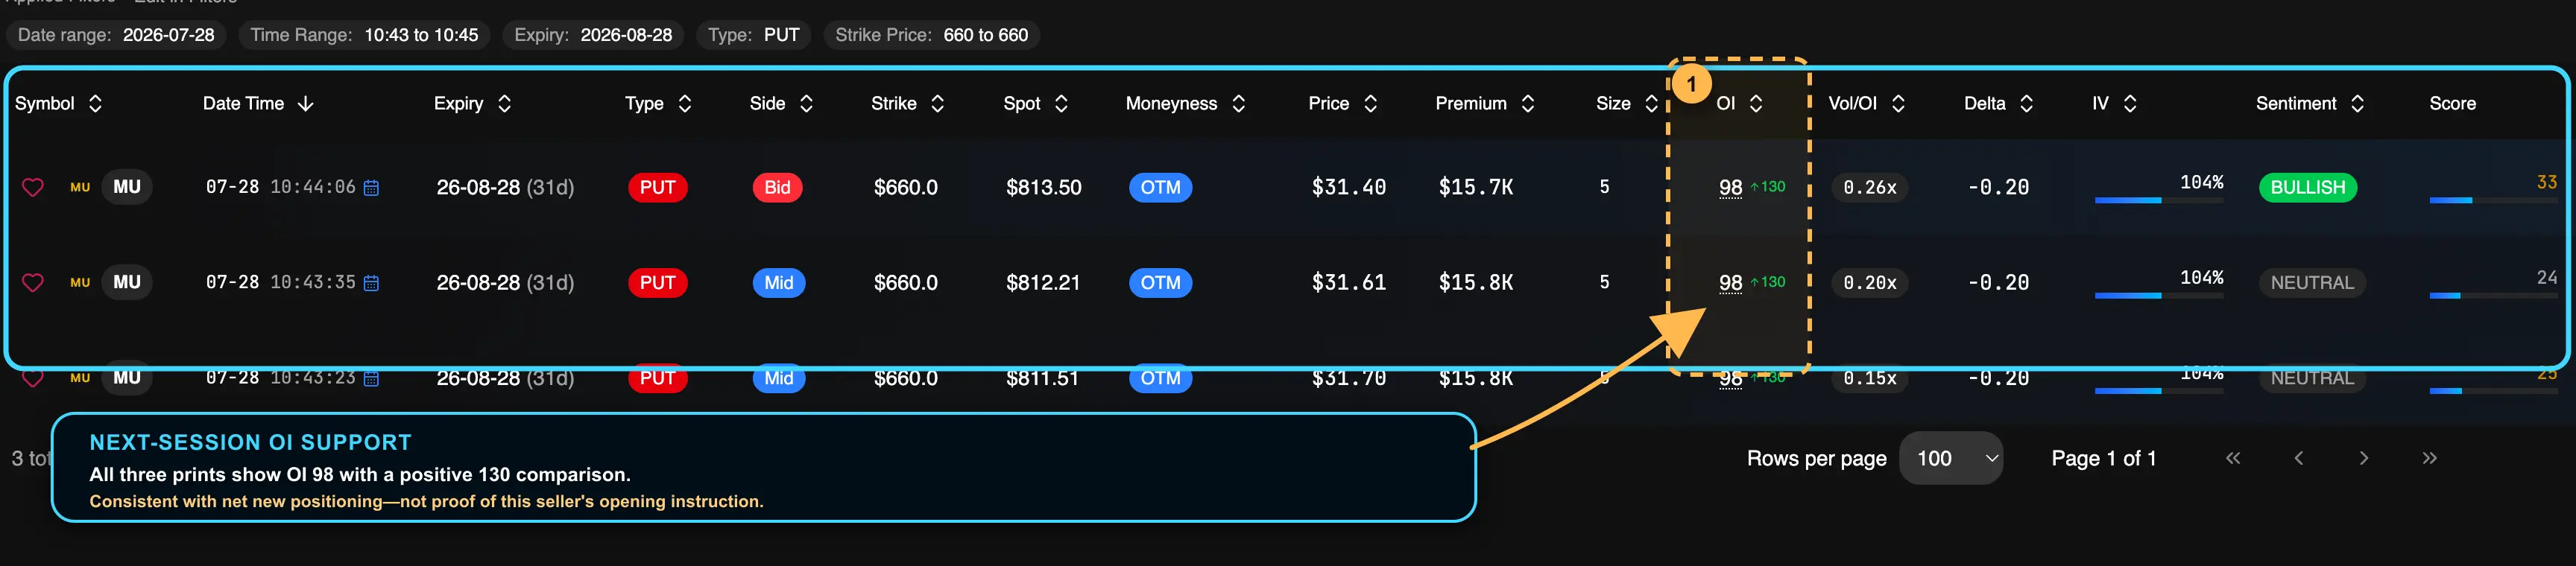
The close-up makes the OI evidence readable at article width: all three prints carry the same positive comparison. That supports net new positioning at the contract level; it does not identify the account or its order instruction.
That makes the prints OI-supported and opening-like, not proven sale-to-open trades. Open interest is an aggregate number: if one participant opens while another closes, OI can stay flat; if both sides open, it rises; if both sides close, it falls. None of those outcomes identifies the anonymous seller’s account or side. The app also exposes an “Opening Position” filter, but that is a flow/OI classification heuristic, not a broker-supplied order instruction.
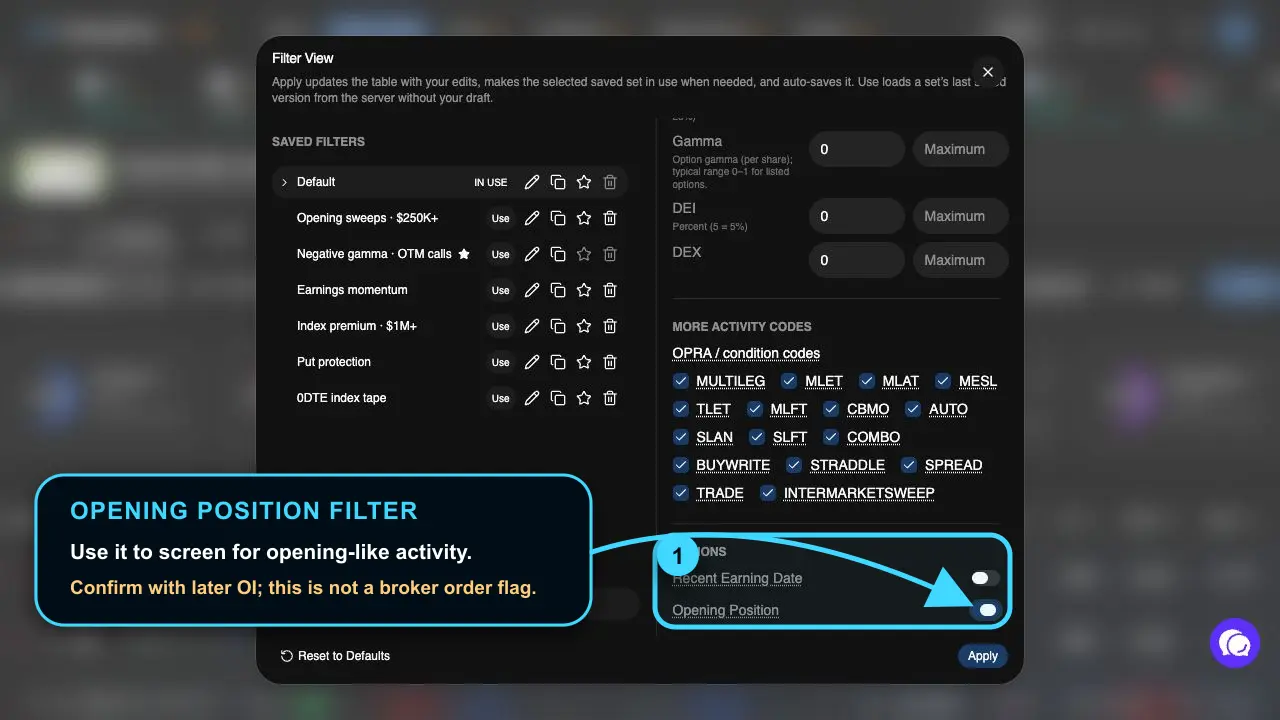
The Opening Position control was rechecked in the authenticated test app on July 31, 2026. Readers can find the same control from TradingFlow Historical Option Trades by opening Filters, scrolling to Options, and enabling Opening Position.
The strongest defensible wording is therefore: the tape matches the prints, and the subsequent OI increase is consistent with new positioning; the public data still cannot confirm that the trader sold these puts to open.
Where the viral interpretation breaks down
1. Selling puts is not a bet that the stocks will fall
A short put is generally a neutral-to-bullish position at expiry.
- The maximum gain is the premium received.
- The seller keeps that maximum only if the option expires worthless.
- Below the strike, assignment becomes possible.
- Below the strike minus premium, the position loses money at expiry.
- The loss grows as the underlying falls.
The seller may be willing to acquire shares at a lower effective price. That is different from profiting because the shares fell. A 40% collapse would be favorable to a long put buyer, not automatically to the put seller.
2. Only part of the basket expires in one month
Four series expire on Aug. 28, 2026:
- 193 of 248 contracts, or 77.8%
- $4,972,500 of the exercise obligation, or 70.5%
- $244,730 of gross premium, or 58.0%
The remaining two series—$2.08 million of exercise obligation and $177,405 of gross premium—expire in February and March 2027.
Calling the entire $422,135 a one-month return mixes short-dated premium with capital committed to long-dated options.
3. The one-month strikes were not 40% below the tape
At the observed underlying prices, the August strikes were approximately:
| Series | Approx. spot at the print | Strike | Strike below spot |
|---|---|---|---|
| EWY Aug. $135 put | $152.60 | $135 | 11.5% |
| MU Aug. $655 put | $819.52 | $655 | 20.1% |
| MU Aug. $660 put | about $812 | $660 | about 18.7% |
| SNDK Aug. $750 put | $1,065.59 | $750 | 29.6% |
The much lower strikes were the 2027 contracts: MU $400 and SNDK $360. Combining those long-dated crash strikes with the August expirations creates the misleading “40% in one month” summary.
4. EWY is not a pure memory stock
MU and SNDK are direct memory and storage equities. EWY is a broad South Korea ETF. It can carry substantial semiconductor and memory-industry exposure through its holdings, but it is not a single memory company.
MU and SNDK account for $5,027,500, or about 71.3%, of the basket’s exercise obligation. EWY accounts for the other 28.7%.
“Memory-heavy basket” is fair. “$7 million of memory stocks” is too neat.
5. Premium is not interest
Option premium is compensation for taking an obligation and its risk. It is not a fixed-interest payment.
Before expiration, a short put can move sharply against the seller as the stock falls or implied volatility rises. American-style equity and ETF options can also be assigned early. Closing or rolling the position may cost more than the original credit.
The 104% IV visible in the MU screenshot is especially important. It is annualized implied volatility—not a 104% probability and not a forecast that MU will fall 104%. It signals that the option market was charging a high price for uncertainty.
What the effective entries would be
If these were short puts, if the premium were fully retained, and if assignment occurred, the gross-premium-adjusted entry price would be:
| Underlying | Put strike | Premium per share | Effective entry before fees |
|---|---|---|---|
| EWY Aug. 2026 | $135 | $5.9907 | $129.01 |
| MU Aug. 2026 | $655 | $28.82 | $626.18 |
| MU Aug. 2026 | $660 | $31.57 | $628.43 |
| MU Mar. 2027 | $400 | $32.29 | $367.71 |
| SNDK Aug. 2026 | $750 | $49.45 | $700.55 |
| SNDK Feb. 2027 | $360 | $32.2267 | $327.77 |
The two August MU positions together cover 3,000 shares. Their combined effective entry is about $627.31 per share, consistent with the approximately $627 figure in the viral post.
That does not make the risk disappear. If MU were far below $627.31 at August expiration, the assigned position would carry an unrealized loss. “I am happy to own it there” must still survive position sizing, drawdowns, news gaps, and the possibility that the original thesis is wrong.
A better way to read the trade
The most defensible description is:
A large, memory-heavy basket of short-put-like prints split between high-IV August exposure and much lower 2027 strikes, with roughly $7.05 million of potential exercise obligation.
That description separates three different claims:
- What traded: contract, expiration, strike, size, price, premium, and IV.
- What the position could mean: premium selling, conditional share acquisition, downside underwriting, or a multi-leg strategy.
- What the trader intended: unknowable from anonymous tape alone.
This separation matters whenever you use an options-flow scanner. A print can be real while the story attached to it is wrong.
Before copying a trade like this
Ask questions the viral summary skips:
- Is the position cash-secured, margined, or part of a spread?
- Can the account fund assignment across every expiration?
- Is the effective entry still attractive after a large fundamental change?
- How much of the premium comes from unusually high IV?
- What is the plan for early assignment, closing, or rolling?
- How concentrated is the risk across correlated underlyings?
- Would a gap below breakeven make the position unmanageable?
The premium is visible immediately. The obligation is what needs underwriting.
How we verified it
We preserved a clean capture of the source post, annotated the four claims that drive its narrative, transcribed the six reported option series, and then used an authenticated TradingFlow historical Option Trades session to search the July 28, 2026 tape.
For each series, we matched:
- underlying
- expiration
- put strike
- contract quantity
- execution price
- gross premium
We captured the MU $660 evidence view after applying the exact date, time, expiration, type, and strike filters. The screenshot annotation marks the selected scope, the $47.36K Put Flow total, the three matching rows, and the repeated 104% IV.
We also checked the OI comparison in that view and the app’s Opening Position filter. The three rows show the same positive ↑130 OI comparison. That is useful T+1 evidence for net new positioning, but it remains an inference about the contract’s aggregate open interest—not proof of an individual account’s sell-to-open instruction.
The check has limits. Market tape is anonymous. It cannot authenticate the source account, observe private broker fees, prove opening versus closing, or reveal a hedge executed in another instrument. The source image remains the attribution for the trader identity and the claimed sell-to-open direction.
Bottom line
The trade data is credible: six series, 248 contracts, $422,135 in gross premium, and $7,052,500 in potential exercise obligation all reconcile.
The viral explanation is not: this was not simply a $7 million bet that memory stocks would drop 40% in one month, and $422,000 was not guaranteed interest.
The useful lesson is bigger than this one post. Verify the prints first, then challenge the narrative. Open TradingFlow Historical Option Trades to repeat the workflow, or read the Option Trades tutorial for more context. Sound analysis begins by respecting what the tape still cannot tell you.
This article is for research and education only. It is not investment advice or a recommendation to copy the position.
Related Articles
Duan Yongping's SpaceX (SPCX) Put Strategy: Buy at $91.80?
Did Duan Yongping use SPCX put options to buy SpaceX at $91.80? TradingFlow checks the $2.32M premium, 1,000-contract claim, and tape evidence.
IV30 vs RV20: See Implied and Realized Volatility Side by Side
TradingFlow Rank Symbols now compares IV30 with RV20 and RV30, adds a signed IV30−RV20 spread, and preserves the separate dates behind each measure.
Option Trades: Options Flow Scanner Tape, UOA & Block Trades
Live options flow tracker in TradingFlow: real-time tape, unusual options activity filters, sentiment, DEX, blocks, and premium flow after Rank shortlists.