GEX Screener: Live Gamma Exposure, Call Walls & Put Walls
Use TradingFlow's GEX screener inside Rank Symbols to inspect gamma exposure, call walls, put walls, volatility, OI positioning and option-chain context in real time.
TradingFlow's GEX screener helps you inspect market-wide gamma exposure, call walls, put walls, and dealer-positioning context. The earlier product name was Gamma Exposure Screener; today the same GEX feature set lives inside Option Chain Analysis as part of Rank Symbols at /app/rank/symbols. The legacy path /app/gamma-exposure-screener should land users on the current Rank Symbols experience—bookmark and share the new URL.
What Is the GEX Screener?
The GEX Screener (now part of Rank Symbols) shows gamma exposure, call walls, put walls, and related metrics across symbols so you can quickly find where dealer positioning may pin or accelerate price.
Screenshots below are captured from the current Rank Symbols / Option Chain Analysis feature set.
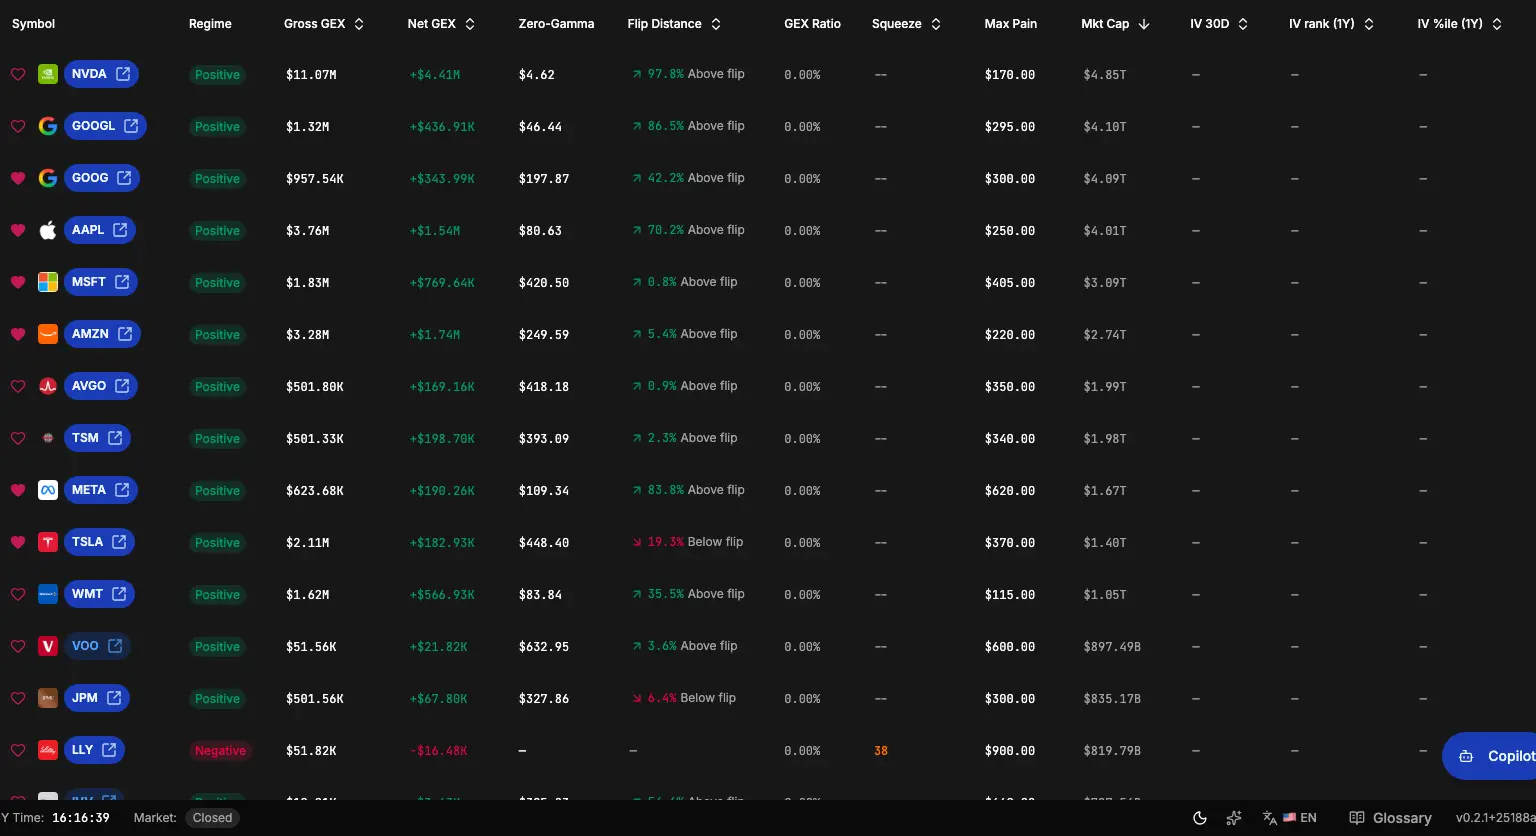
Ranked universe table (cropped):
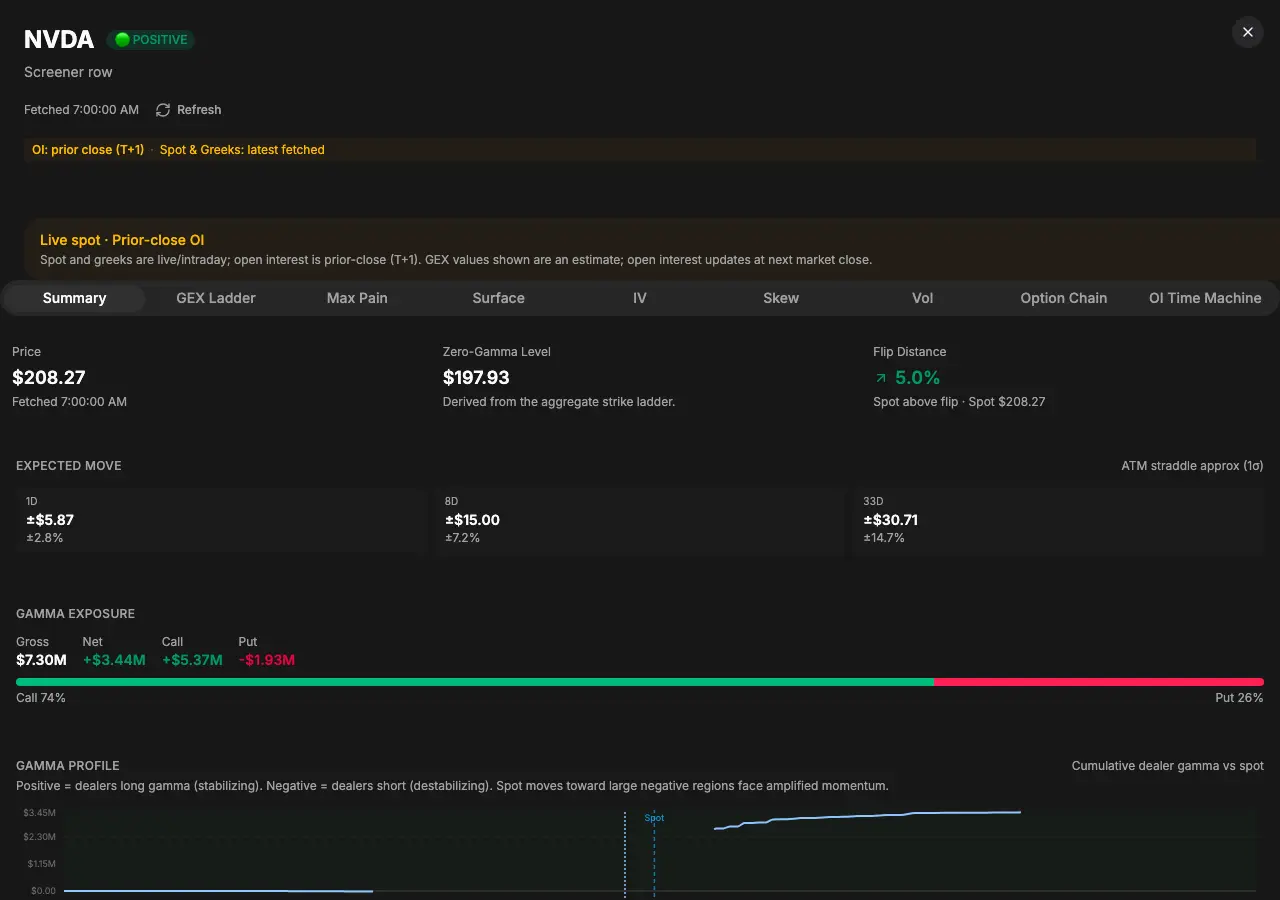
Symbol drawer (opened from a row):
What stayed the same (GEX side)
- Snapshot-first universe — Core GEX rankings and columns come from a cached prior-close style snapshot; the UI stays explicit about snapshot timing.
- Read GEX context inside the Symbols table and inspection drawer, alongside flow, positioning, volatility, and chain context.
- KPI-style context at the top of the table for regime counts and market-wide gamma scale (exact cards evolve with the product).
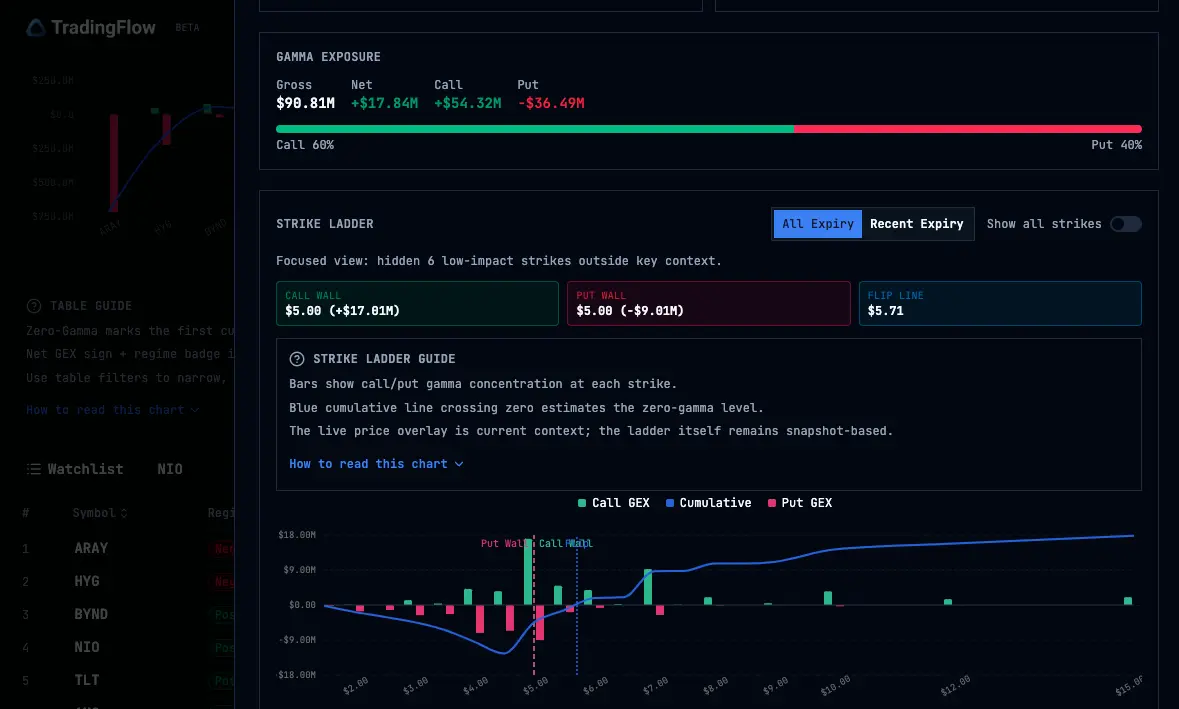
- Symbol drawer — Call wall, put wall, flip context, strike ladder, surfaces, and related inspection tabs—still one coherent inspection story per symbol when
rankis a GEX sort. - Live spot — Best-effort live quotes can overlay for distance and display context; they do not replace snapshot-era gamma math.
What changed (naming, URL, and vol)
- Canonical URL — Use
/app/rank/symbols, not/app/gamma-exposure-screeneror the retired/app/option-chain-analysis. - Cross-sectional volatility — IV 30D, IV rank, IV percentile, and related columns sit beside GEX and flow context. Use the Symbols table and Vol drawer tab to answer “where is vol rich or cheap?” without leaving Rank. See Ranked IV and vol context for how the old “Volatility Desk” concept maps here.
- OI positioning — OI context for a selected symbol lives in the drawer's Positioning tab, not a separate cross-symbol OI rank app. See OI Change Rank (retired).
Toolbar, filters, and table
Behavior is owned by Rank Symbols today: symbol lookup, table navigation into the drawer, and entitlement-aware controls for server-backed sorts, filters, premium drawer details, and export. Prefer the in-app copy for the exact control set.
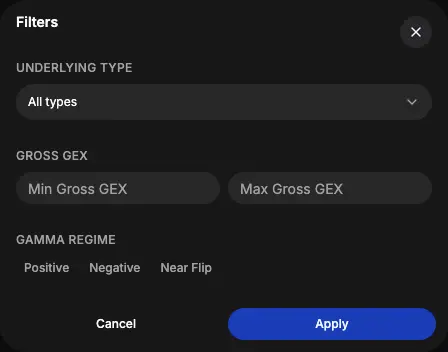
Filters dialog or Rank controls (current controls depend on the Symbols surface and account access):
Watchlist
Where the app exposes a watchlist heart on this surface, symbols you save still integrate with other TradingFlow tools that consume the shared watchlist (for example Option Trades). Do not assume parity with removed apps—cross-symbol OI Change Rank is retired.
Where to open it
In TradingFlow, open Rank → Symbols, or go directly to /app/rank/symbols. If you follow an old Gamma Exposure Screener link, you should land on the same current surface after redirect.
See call walls, put walls and full GEX live
Open Rank Symbols → GEX view in TradingFlow
Learn the concepts behind the numbers
For a plain-English reference on what the walls actually mean for price action, read the companion guide:
→ What Is a Call Wall and Put Wall in Options Trading? GEX, OI & Max Pain
→ Gamma Exposure (GEX) Explained: Greeks, Positive vs Negative Gamma, IV Rank
Also read
- Option Chain Analysis — current GEX, volatility, positioning, and chain feature overview.
- Symbol-level analysis —
/app/rank/symbolsfor flow-ranked symbols.
FAQ: GEX Screener Questions
What is the GEX Screener? The GEX Screener (now in Rank Symbols) lets you rank symbols by gamma exposure, see call and put walls, and inspect the full chain and vol context in one view.
How to use GEX Screener for trading? Look for symbols with extreme GEX or walls near price for potential pinning or breakout setups. Combine with flow from Option Trades.
See it live in Rank Symbols.
Related Articles
Option Chain Analysis inside Rank Symbols
Option Chain Analysis is now a feature set inside Rank Symbols (`/app/rank/symbols`): GEX, volatility, OI positioning, and chain tabs live in the symbol inspection drawer alongside flow-ranked discovery.
Ranked IV and vol context: shipped inside Rank Symbols
There is no separate Volatility Desk route. Cross-sectional IV rank, IV percentile, and vol-focused drawer context now live inside Rank Symbols at /app/rank/symbols.
OI Change Rank (retired): where cross-symbol OI ranking went
The standalone OI Change Rank app and /app/oi-change-rank are removed from the product (2026). Per-symbol OI context now lives in the Positioning tab of the Rank Symbols inspection drawer.