
September 2 Findings: The Bounce Sat on 765 / 7670
Rank Symbols on the completed September 2 session shows SPY closing on the $765 put wall. SPXW 0DTE tagged 7681, then sat on the 7670 top. GEX is prior-close structure (T+1); the OHLC is the session.
This is a Rank Symbols readout of the completed September 2, 2026 session. It is not a trade.
Two clocks sit on the same screen:
- Session OHLC — what printed that day.
- TradingFlow GEX — that session's prior-close structure (T+1). It does not recompute live 0DTE books.
The bounce closed on the T+1 walls. That is the finding. Labeling the clock is the rest of the work. See Greeks and GEX.
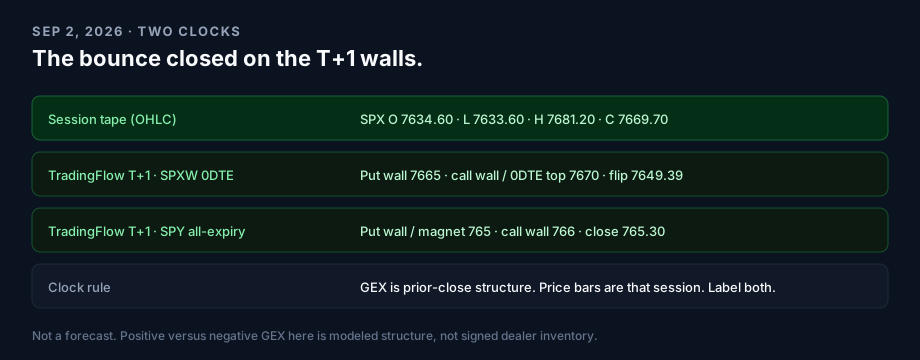
Session tape versus T+1 structure. GEX levels are prior-close. Price bars are that session. Neither row is a forecast.
Readers with access can start from SPY Gamma Exposure and SPXW, 0DTE horizon. Sign-in and a paid Rank entitlement may be required.
What printed
SPX on September 2 (Rank daily bar):
- Open 7,634.60
- Low 7,633.60
- High 7,681.20
- Close 7,669.70
SPY:
- Open 762.50
- Low 761.70
- High 766.40
- Close 765.30
The low never tagged 7600. The high tagged the 7680s and did not hold 7700. Close sat in the 7665–7670 pocket.
SPY: put wall $765, close $765.30
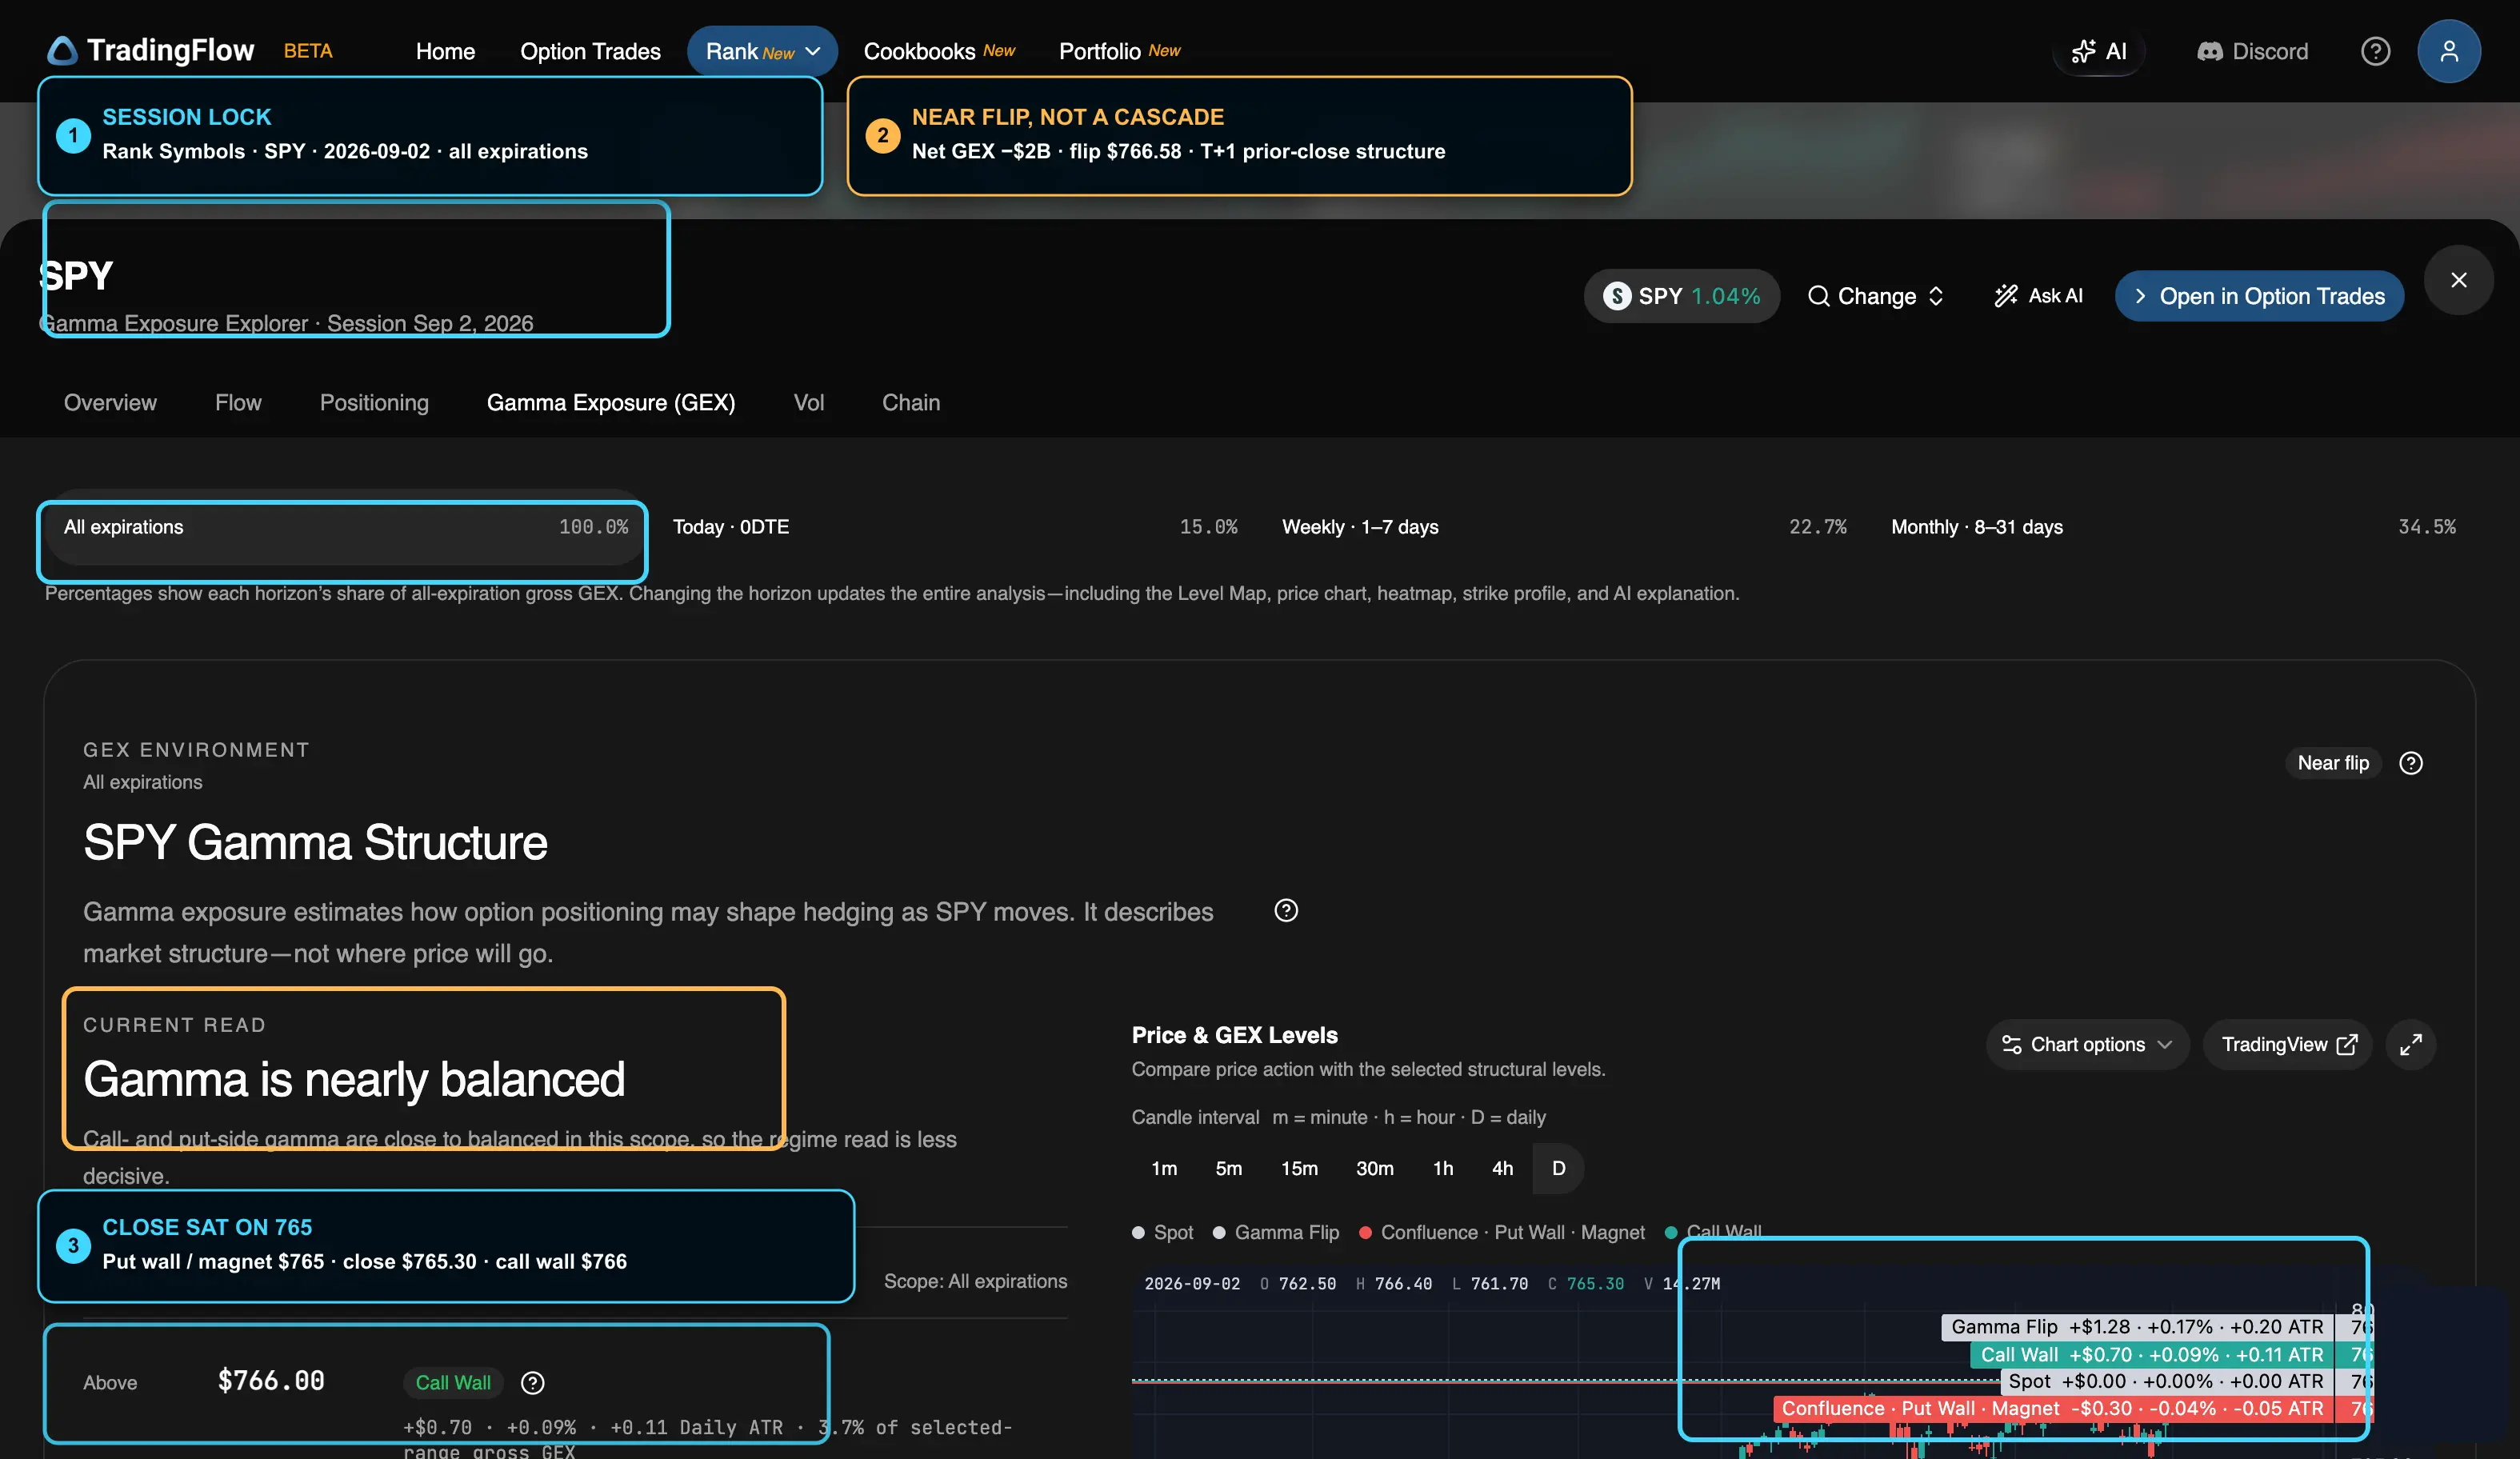
Test app, session 2026-09-02, all-expiration GEX. Callout 1 is the session lock. Callout 2 is the near-flip supporting total. Callout 3 is close versus the $765 put wall and $766 call wall. GEX levels are prior-close structure (T+1). Captured September 3, 2026.
On this snapshot:
- Environment: Near flip
- Net GEX: −$2.0B (gross $49.1B)
- Call wall: $766.00
- Put wall: $765.00 (also the magnet and the 0DTE top)
- Flip: $766.58
- Horizon mix: 0DTE 15.0%, weekly 22.7%, monthly 34.5%
- Overview max pain vs spot: $760
- Structure built 5:41 PM EDT
Spot closed thirty cents above the put wall. "Near flip" here is modeled balance, not signed dealer inventory, and it is not a cascade.
SPXW 0DTE: close sat on 7670
Cash SPX 0DTE lives on SPXW. Same session, horizon Today · 0DTE:
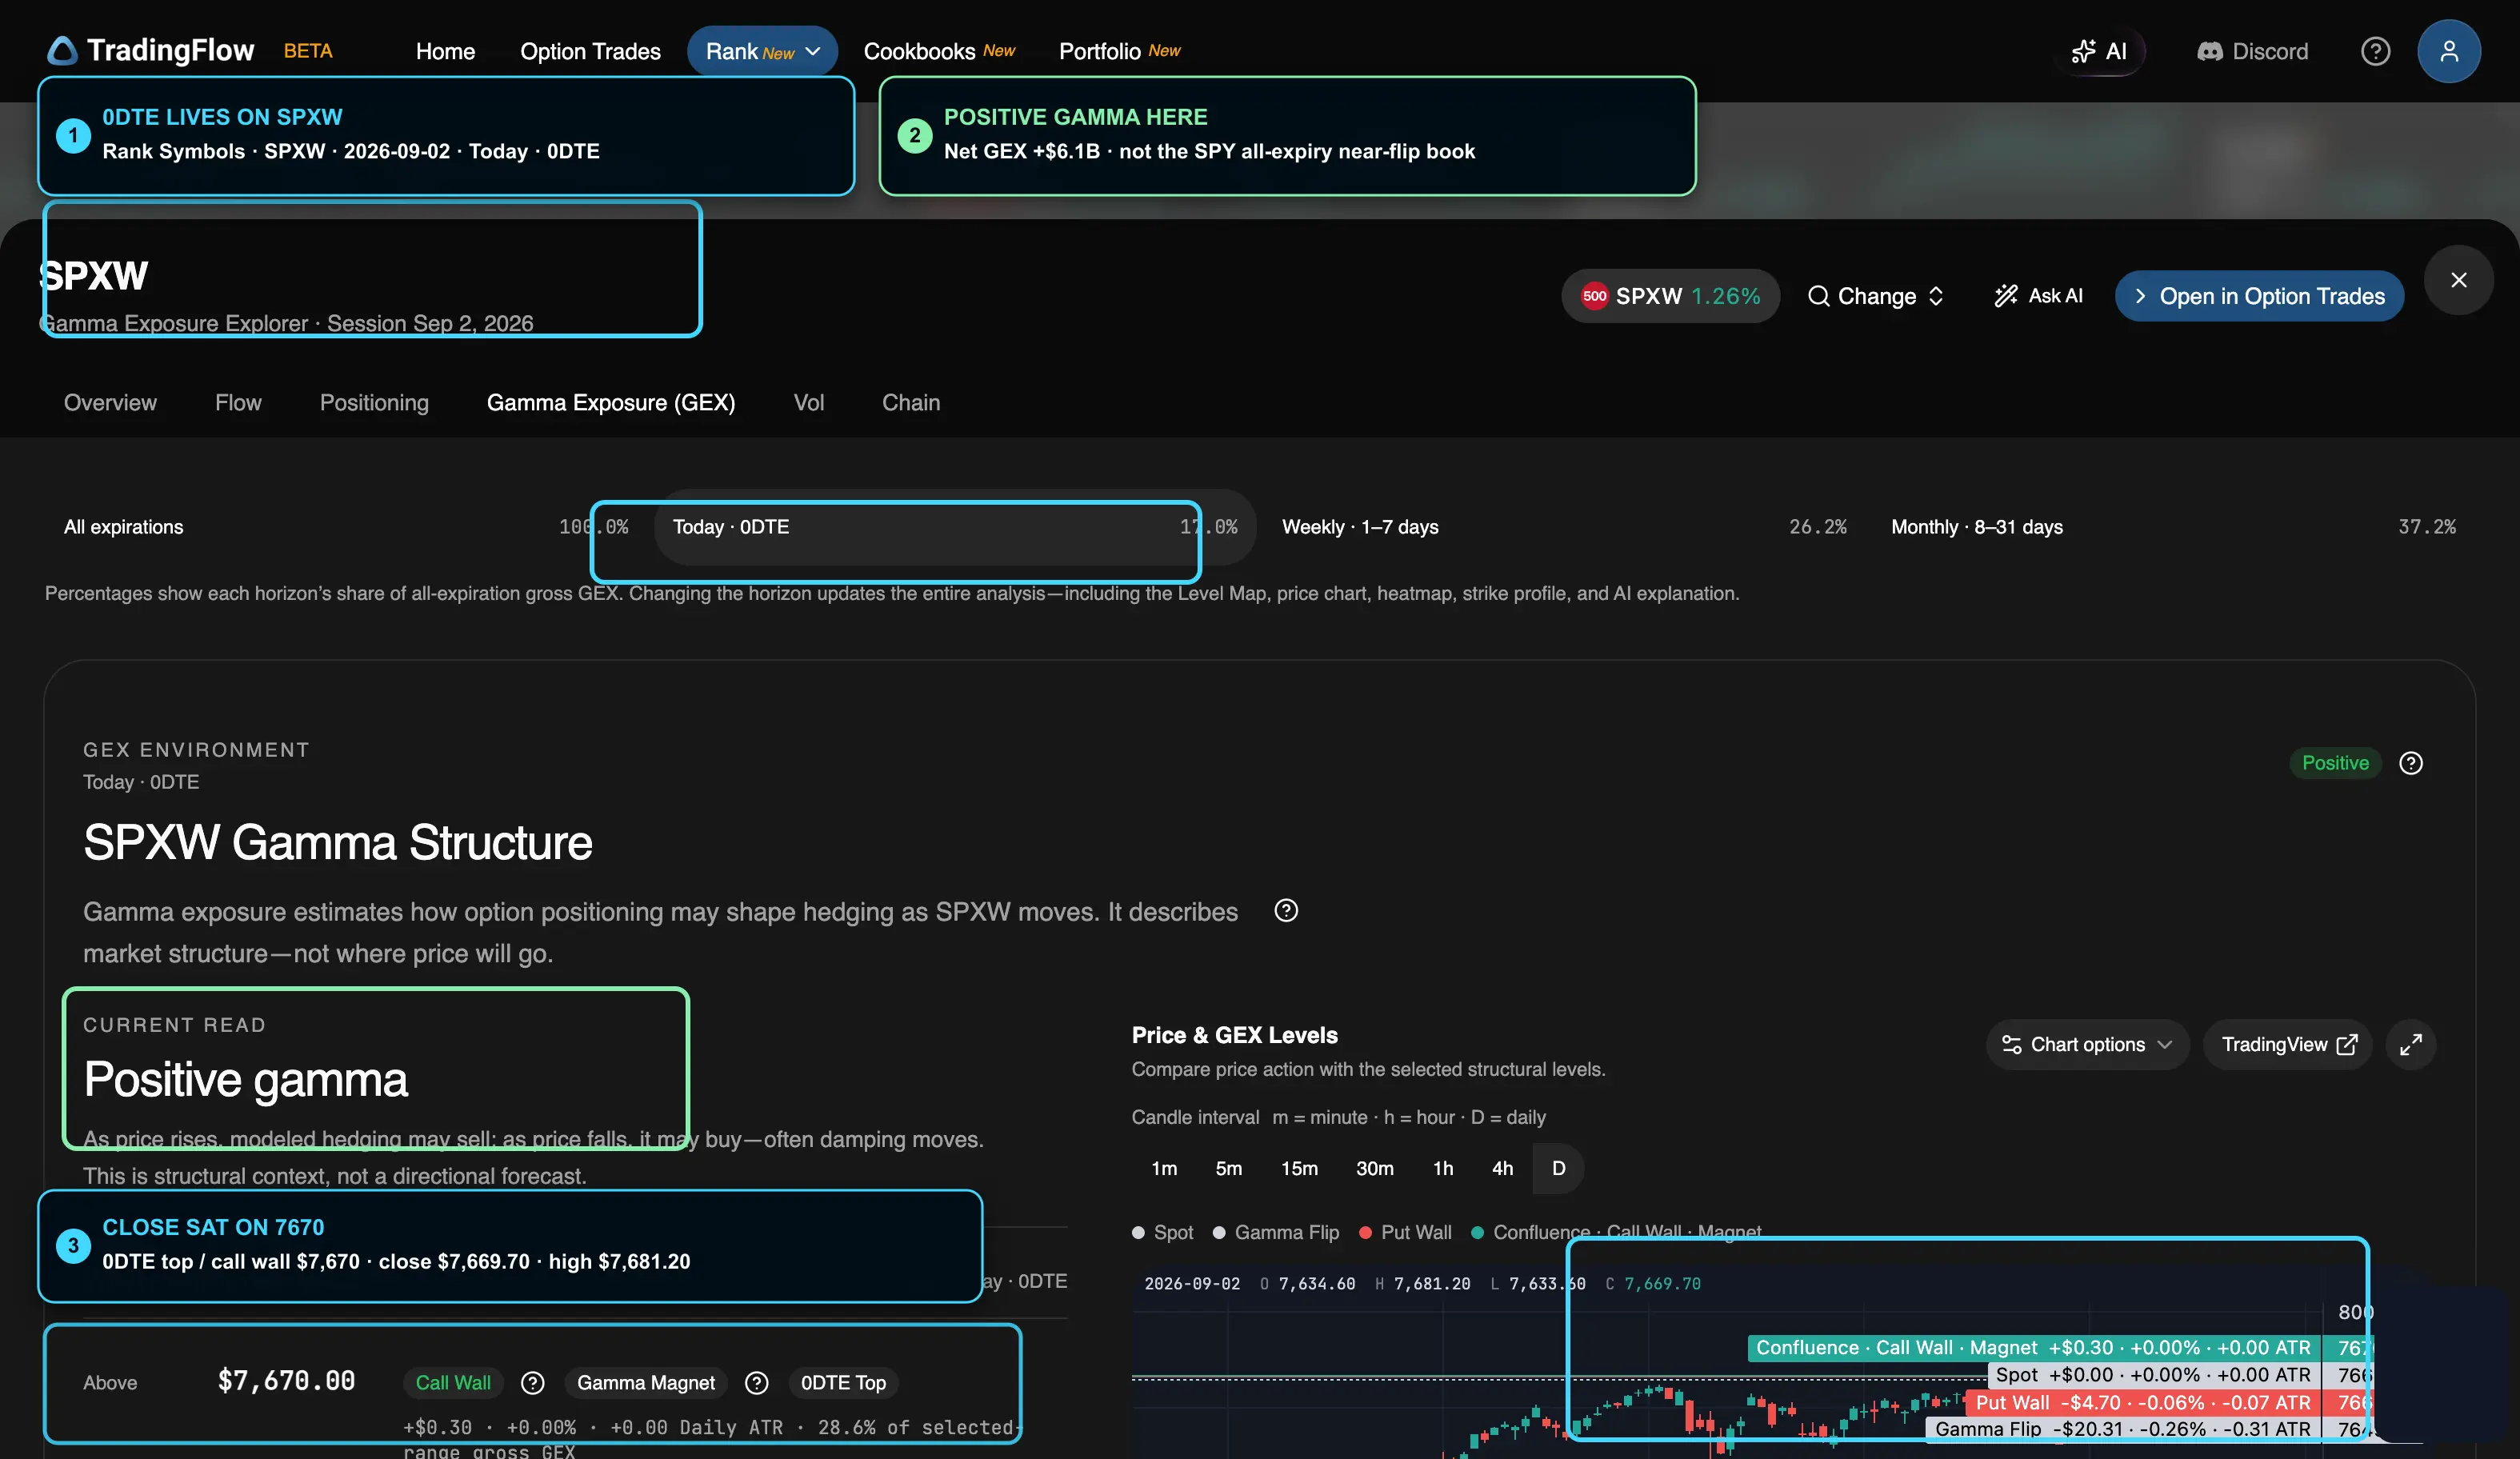
Same session, SPXW, horizon Today · 0DTE. Callout 1 is the SPXW lock. Callout 2 is the positive-gamma read on this book. Callout 3 is close versus the $7,670 0DTE top. Structure built 5:41 PM EDT. Captured in the test app on September 3, 2026.
On this snapshot:
- Environment: Positive (net GEX +$6.1B)
- Call wall / magnet / 0DTE top: $7,670
- Put wall: $7,665
- Flip: $7,649.39
- 0DTE share of all-expiration gross GEX: 17.0%
The session high ran eleven points through the T+1 top (7,681.20), then closed on it (7,669.70). That is a pin-shaped close on this clock. It is not proof that a live morning 0DTE map said the same thing.
SPY all-expiry was near flip, −$2B. SPXW 0DTE was positive, +$6.1B. Those are different books. Mixing them into one "negative gamma bounce" slogan erases the horizon.
Cash SPX all-expiry is the wrong map for a same-day wall
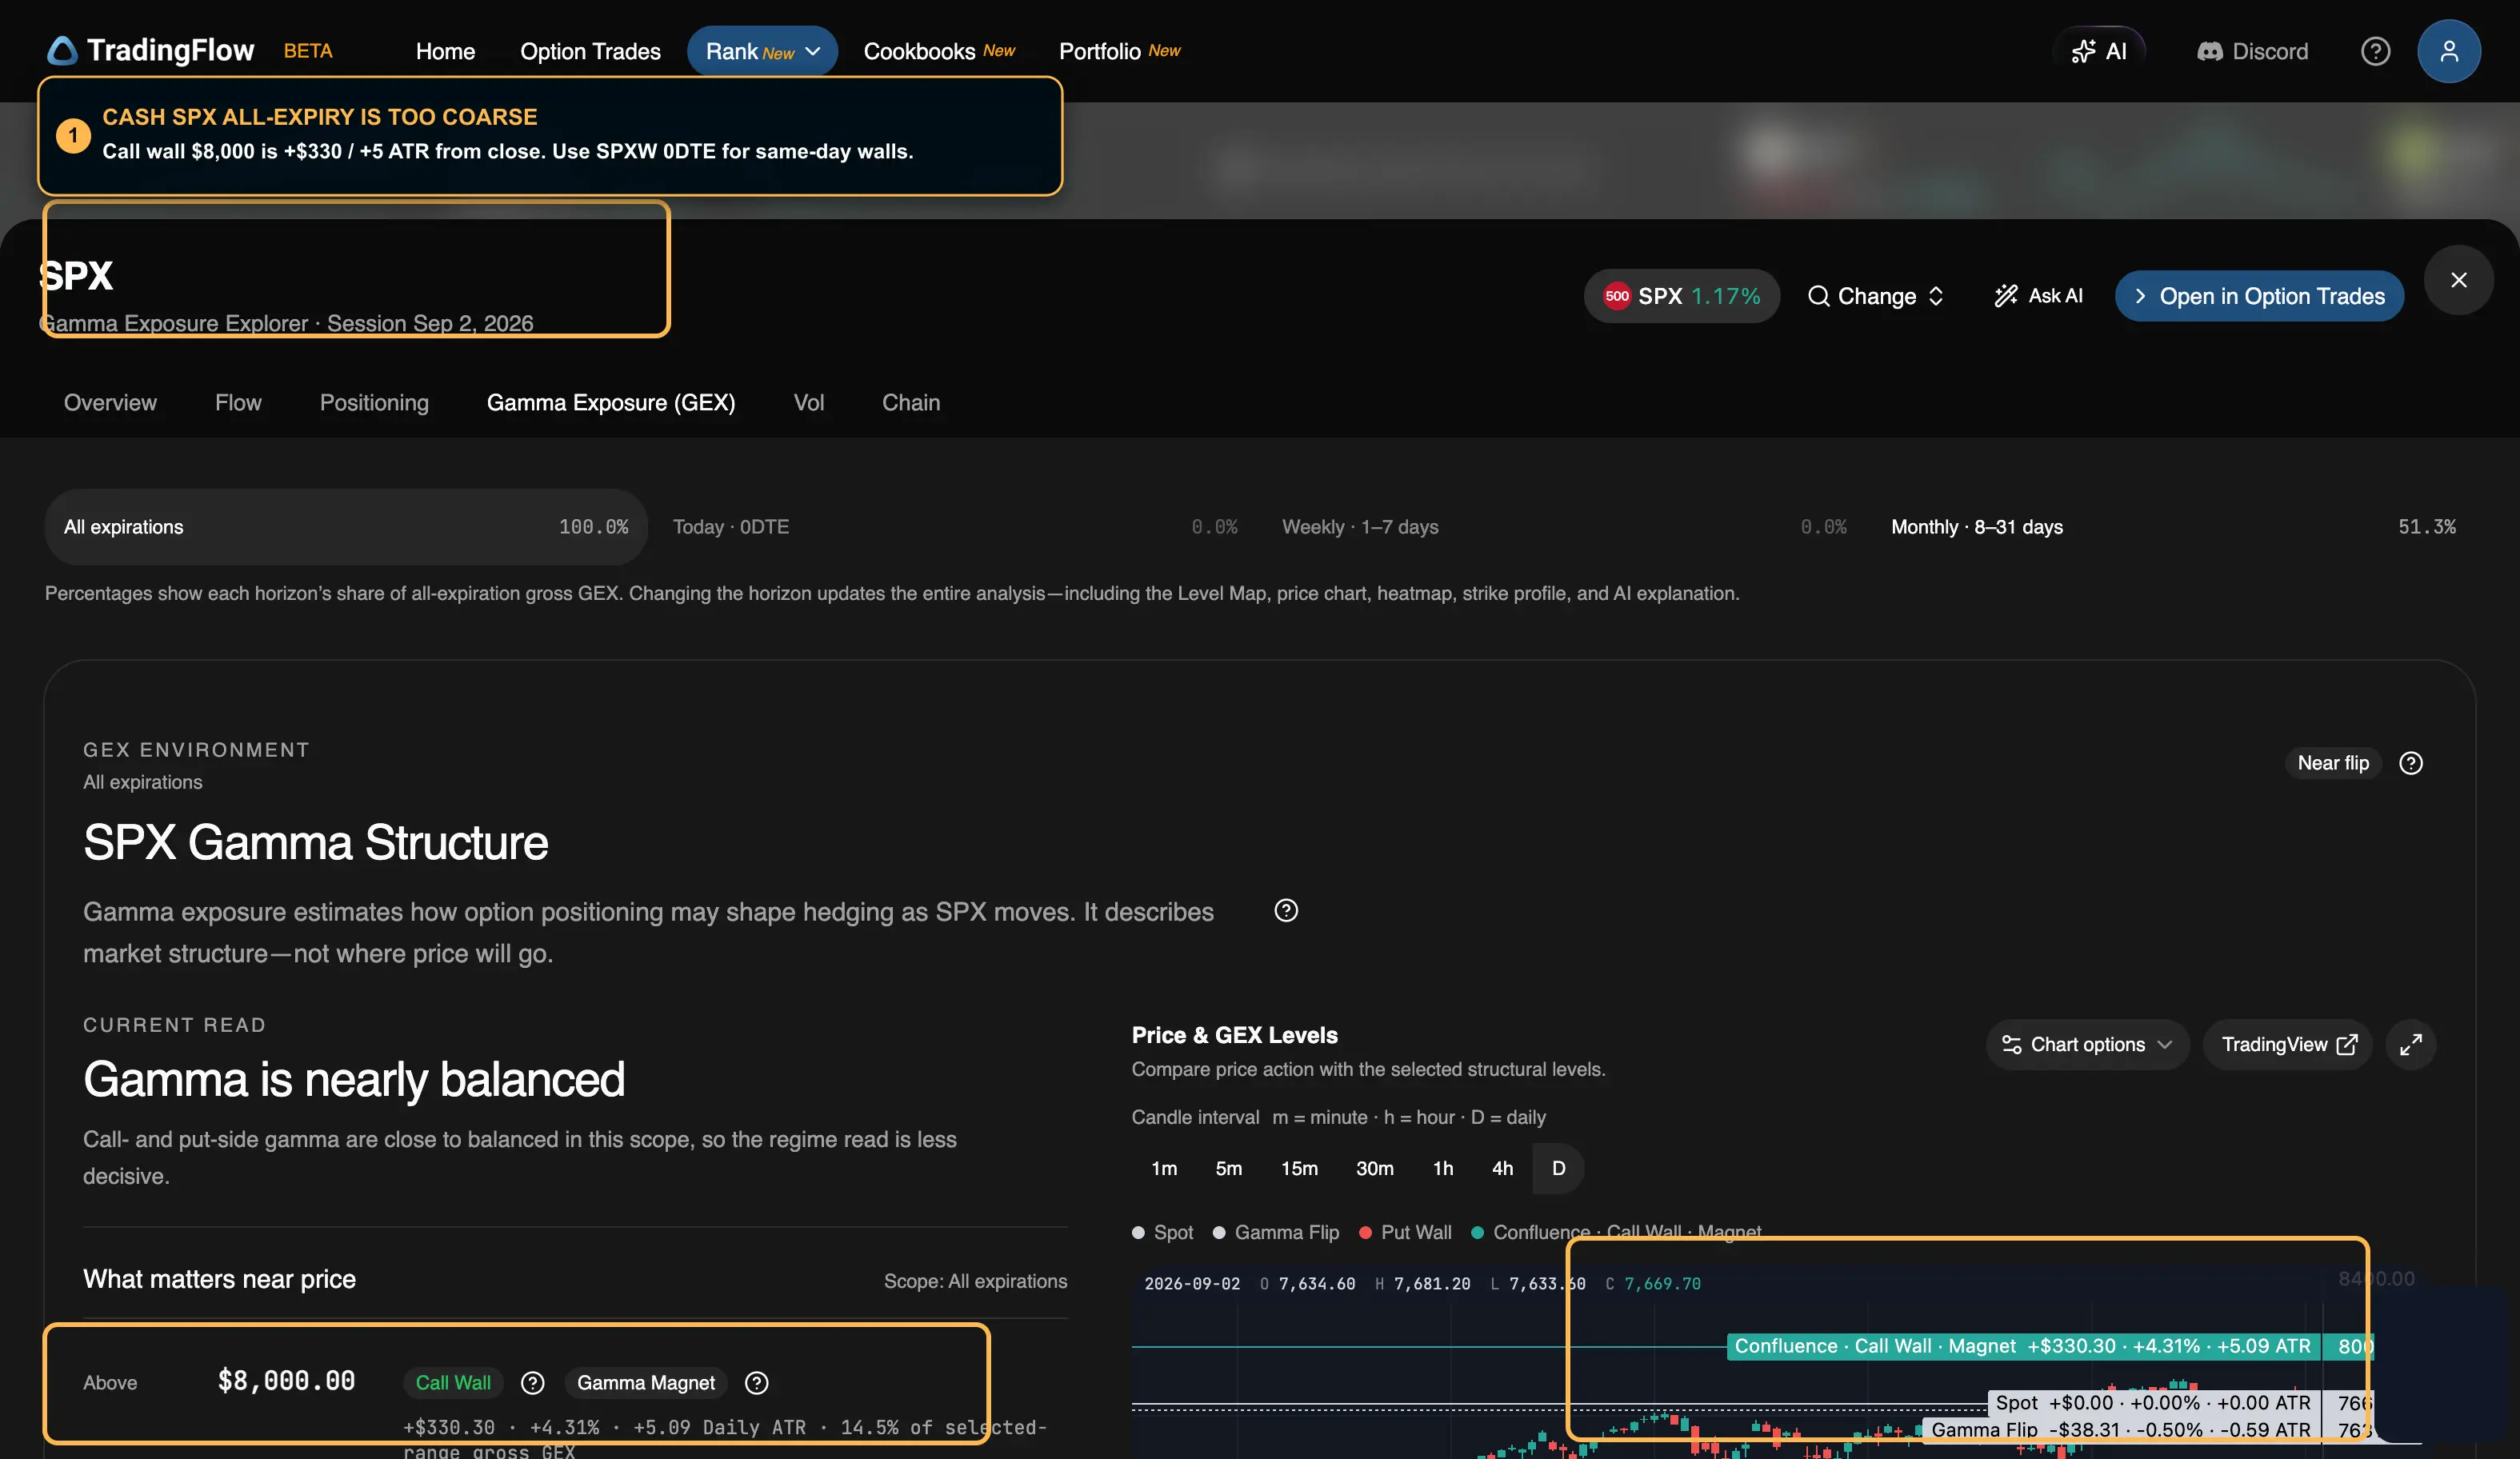
Cash SPX, all expirations, same session. 0DTE share is 0.0% on this underlier. Call wall $8,000 sits +$330 / +5 ATR above close. Use SPXW 0DTE when the question is a same-day wall.
On this snapshot:
- Environment: Near flip
- Net GEX: +$4B
- Call wall / magnet: $8,000
- Flip: $7,631.39
- Close: 7,669.70
- Horizon: 0DTE 0.0%, monthly 51.3%
If the question is "where did same-day gamma sit," this map is too coarse. The 0DTE book is on SPXW.
What this session is evidence of
| Question | TradingFlow on Sept 2 | Clock |
|---|---|---|
| Where did SPY close versus structure? | Put wall $765, close $765.30, call wall $766 | T+1 all-expiry GEX + session OHLC |
| Did the bounce hold 7600? | SPX low 7,633.60; SPY low 761.70 | Session OHLC |
| Did the high hold 7700? | SPX high 7,681.20 | Session OHLC |
| Where did same-day SPX gamma sit? | SPXW 0DTE call wall / top 7,670, close 7,669.70 | T+1 0DTE snapshot |
| Was the session "negative GEX"? | SPY all-expiry near flip, −$2B; SPXW 0DTE positive, +$6.1B | T+1 snapshot, not signed MM inventory |
| Can cash SPX all-expiry answer the 0DTE wall? | Call wall $8,000, 0DTE share 0.0% | Wrong underlier / horizon |
Positive versus negative GEX here is modeled structure, not observed dealer inventory. See Unusual options activity is not a signal until the tape checks out.
Reproduce the findings
- Open Rank Symbols → trading date Sep 2, 2026 → symbol SPY → Gamma Exposure. Record environment, walls, flip, net GEX, and the daily OHLC on the chart.
- Change symbol to SPXW. Set horizon to Today · 0DTE. Record the 0DTE top, put wall, and flip. Confirm the structure timestamp (this run: 5:41 PM EDT).
- Optionally open cash SPX on all expirations and note that 0DTE share is 0.0% and the call wall is $8,000.
- Stop before "therefore buy/sell."
TradingFlow App Home → Rank Symbols for the session lock → GEX for walls and flip.
Related reading
- September 3 findings: the rally sat on 773 / 7750
- SPY / SPX / QQQ 0DTE evidence loop
- Call/put walls on a pin day
- Negative GEX is session risk, not a trade
- Unusual options activity is not a signal until the tape checks out
Learn more
Related Articles
September 9 Findings: Close Sat on 762 / 7635
Rank Symbols on the completed September 9 session shows SPY closing 762.40 on the $762 0DTE put wall, under the $763 top. SPXW opened at the high, never retook it, and closed 7636.40 on the 7635 0DTE top. Both books were negative.
Week of September 1: The Bounce Ran 761 to 7750, Then Sat on 770 / 7720
Four Rank sessions, one corridor. SPY closed 761.60 on September 1, sat on 765 then 773, and finished the week on the $770 0DTE top. SPX tagged 7757 Thursday and closed Friday under 7720. Friday GEX was negative, and 0DTE was 42.9% of SPY gross.
September 3 Findings: The Rally Sat on 773 / 7750
Rank Symbols on the completed September 3 session shows SPY tagging the $774 0DTE call wall and closing on the $773 top. SPXW 0DTE ran to 7757, then sat under the 7750 top. GEX is prior-close structure (T+1); the OHLC is the session.