October 2 Recap: Balanced Tape, MU $1.9B, SPX GEX Positive
Daily Market Recap on the completed October 2 session printed $16.8B of single-name premium, 69% in calls, with tone balanced at 24% bullish vs 23% bearish. MU led a sixth session at $1.9B (Bearish). All six index GEX rows turned Positive, and Rank showed SPY and SPXW closing between their 0DTE put wall and 0DTE top.

This is a Daily Market Recap readout of the completed October 2, 2026 session, with a Rank check on SPY and SPXW. It is not a trade.
Two clocks sit in the same report:
- Session tape — single-name (STOCK) premium, sentiment, timing, and movers from AggregatedOptionTrades, plus the session OHLC.
- TradingFlow GEX / IV — prior-close chain and meta snapshots (T+1). They do not recompute live 0DTE books.
The session was balanced at 24% bullish vs 23% bearish, with $16.8B of single-name premium and 69% of it in calls. The heaviest name was MU ($1.9B, Bearish) for the sixth session running. Every index GEX row turned Positive, led by SPX at +$19.74B. On Rank, SPY closed 769.60 between its $769 0DTE put wall and $770 0DTE top, and SPXW closed 7,722.70 between 7,720 and 7,725. That is the finding.
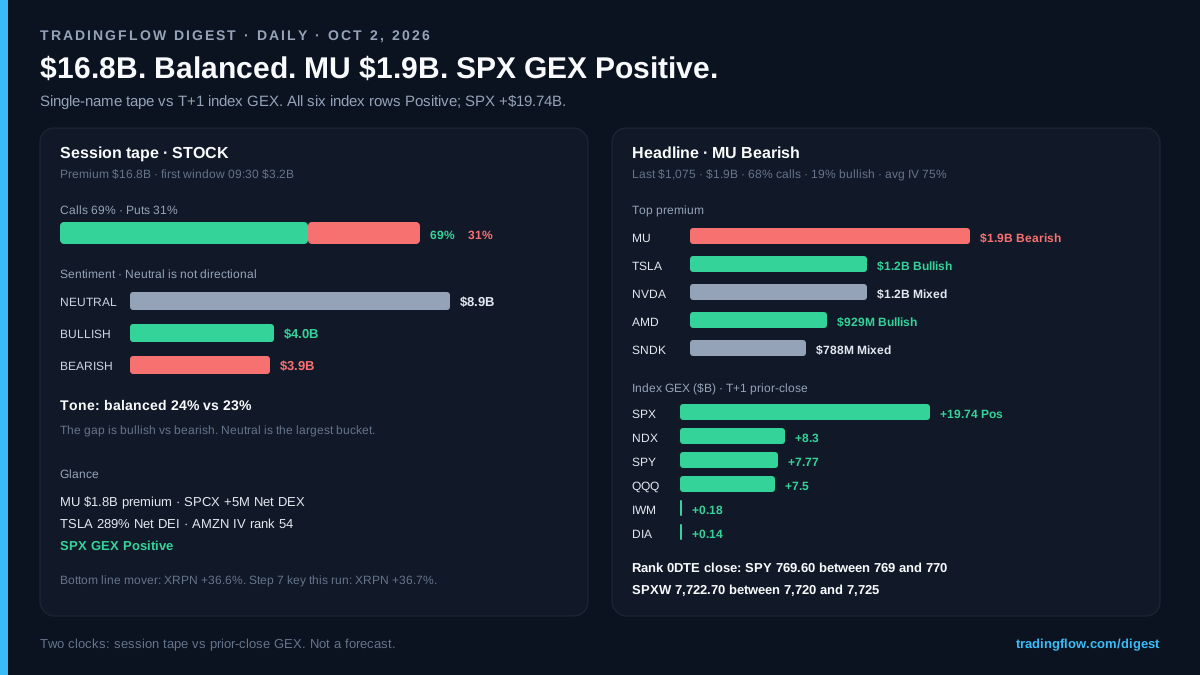
Tape versus T+1 structure. Sentiment, premium, and OHLC are the session. GEX is prior-close. Neither row is a forecast.
Readers with access can open Daily Market Recap or the dated run market-recap~2026-10-02. Sign-in and an eligible trial or subscription may be required.
What the recap printed
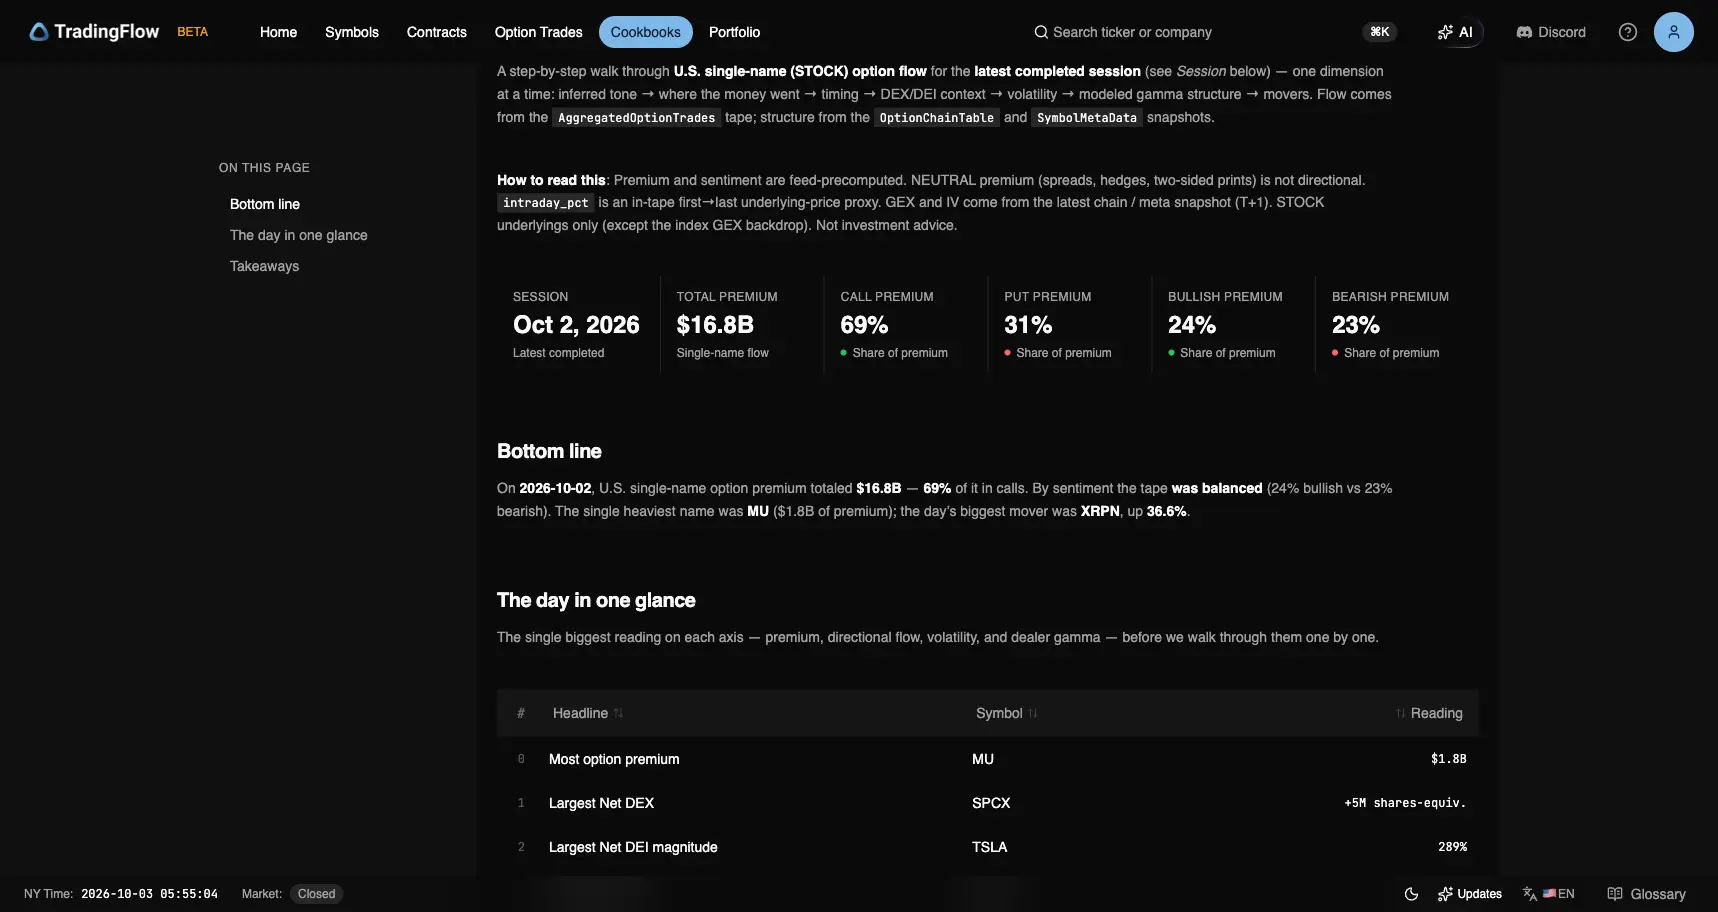
Test app, official Daily Market Recap, session 2026-10-02. KPI strip is the session tape. Captured October 3, 2026.
On this run:
- Session: Oct 2, 2026 (latest completed)
- Total premium: $16.8B (single-name)
- Call premium: 69% · put premium: 31%
- Bullish: 24% · bearish: 23%
- Tone: balanced
- Largest sentiment bucket: NEUTRAL $8.9B (bullish $4.0B, bearish $3.9B)
- Heaviest name: bottom line and glance MU $1.8B; leaders table and headline cards MU $1.9B
- Bottom-line mover: XRPN +36.6%
The prior session, October 1, printed $17.1B, 60% calls, and a balanced 23% vs 23%. This session carried about the same premium with a much higher call share. The first 30-minute window held $3.2B, the largest opening window in any daily recap edition of this digest; the previous high was $2.9B on September 14 and September 17.
Neutral premium (spreads, hedges, two-sided prints) is not directional. Tone is the bullish-versus-bearish gap, not the neutral bucket.
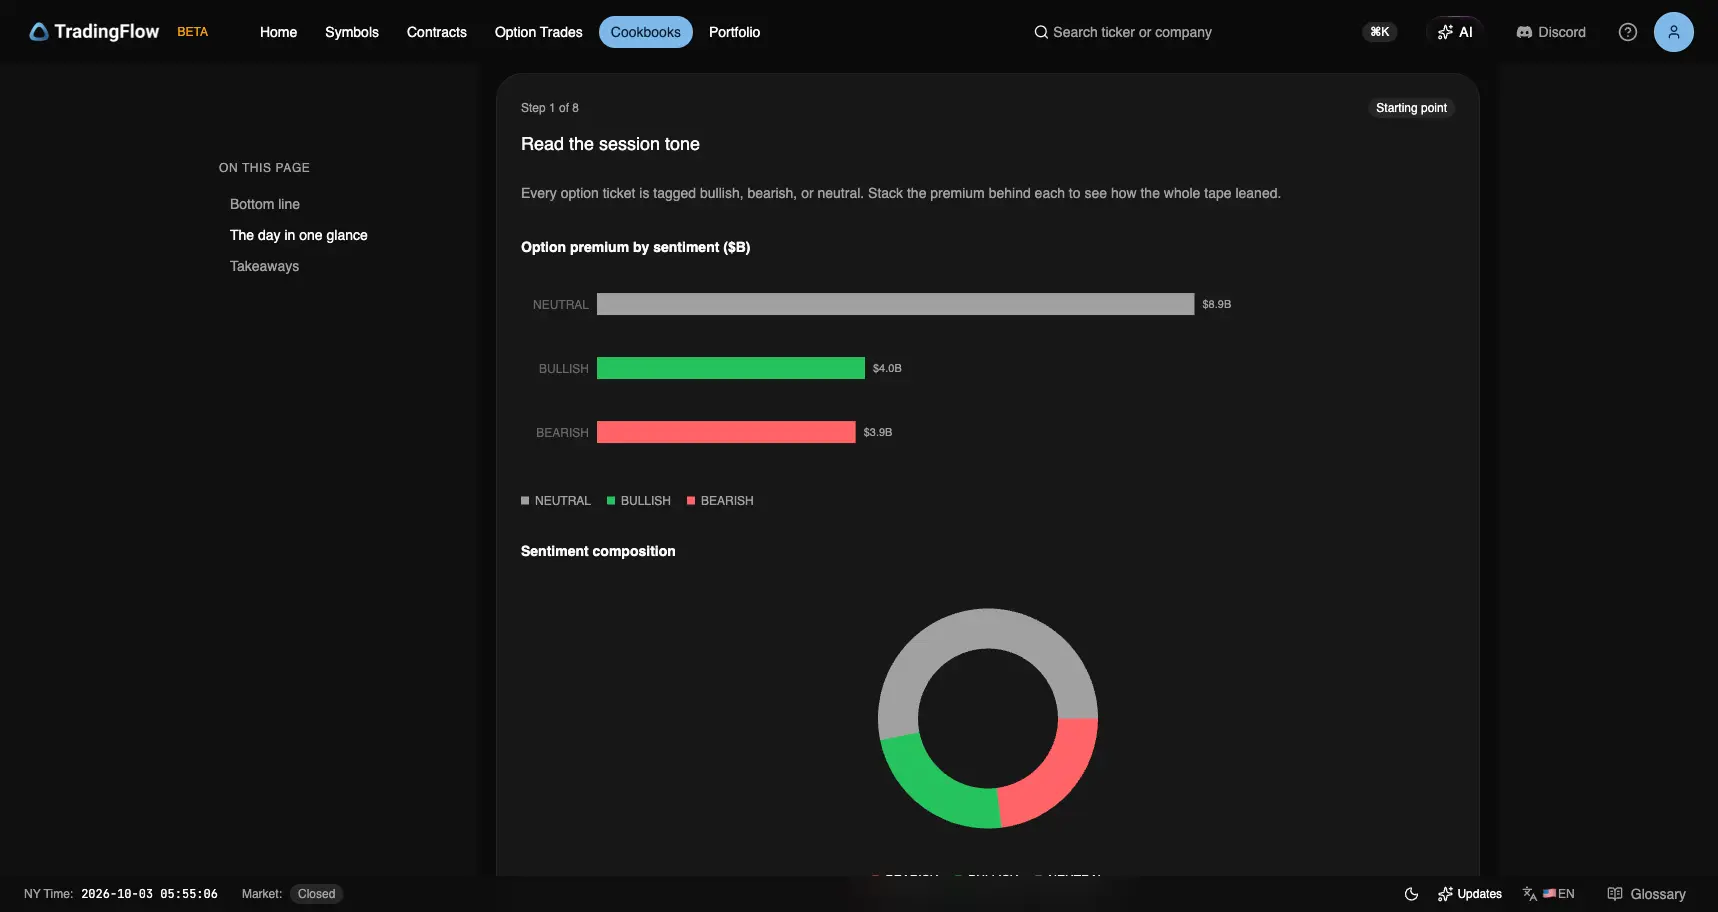
Same run, Step 1. Neutral is more than half the tape. Bullish leads bearish by $0.1B. Captured in the test app on October 3, 2026.
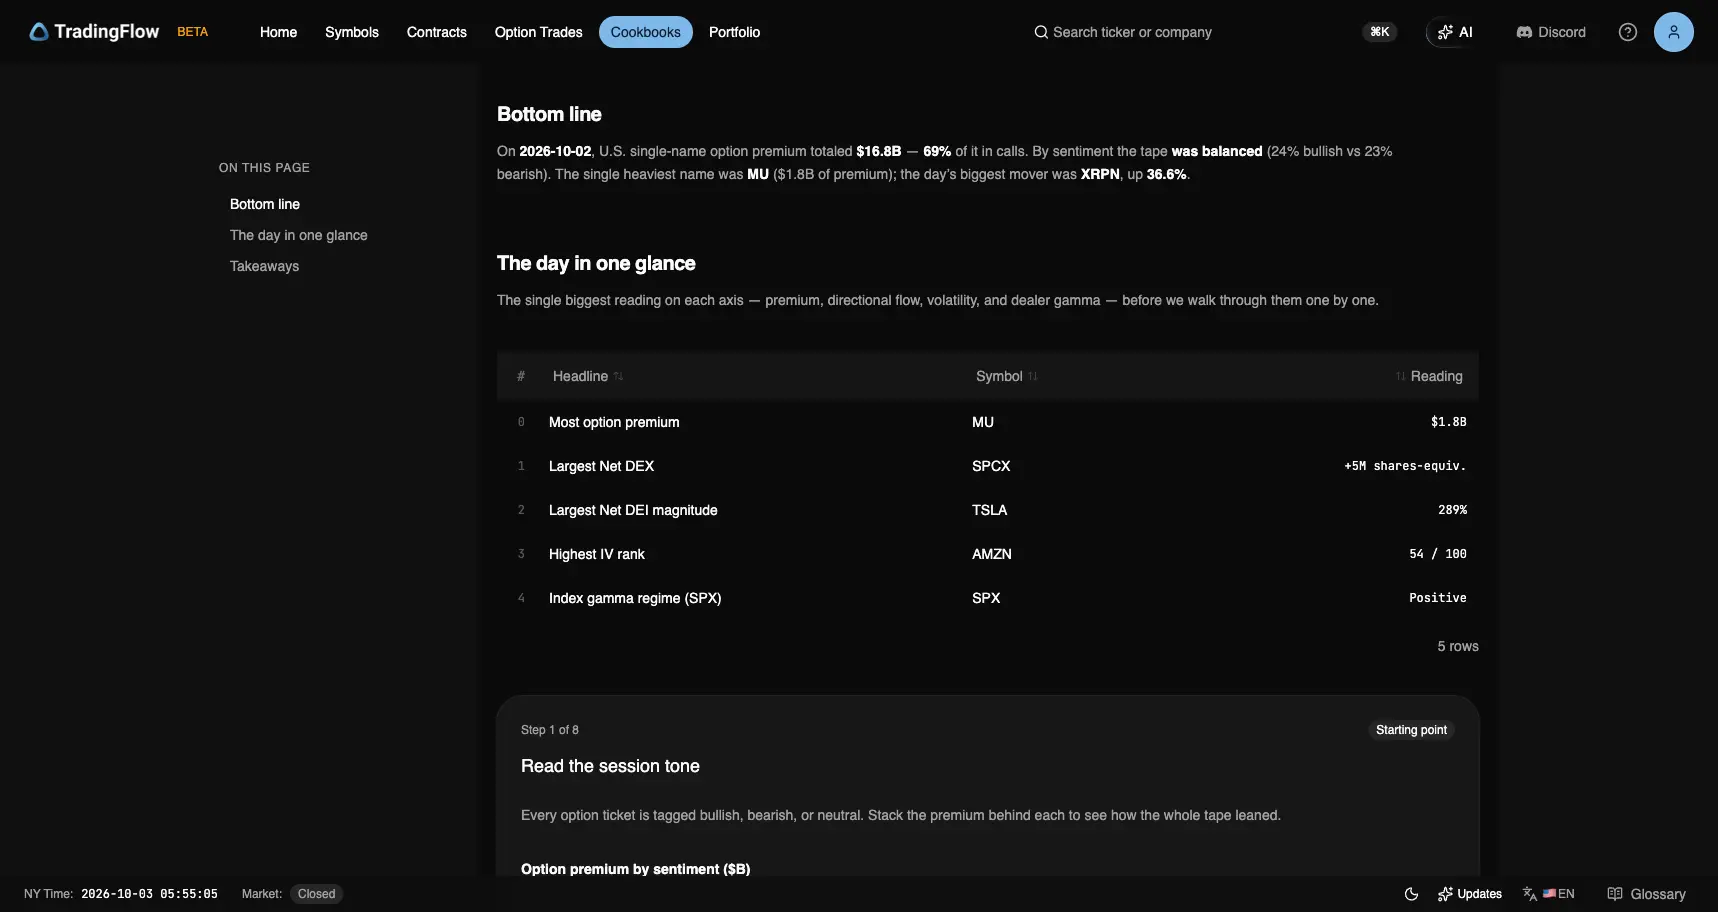
Same run, Bottom line and glance table. Captured in the test app on October 3, 2026.
Glance, one reading per axis:
| Axis | Symbol | Reading |
|---|---|---|
| Most option premium | MU | $1.8B |
| Largest Net DEX | SPCX | +5M shares-equiv. |
| Largest Net DEI magnitude | TSLA | 289% |
| Highest IV rank | AMZN | 54 / 100 |
| Index gamma regime | SPX | Positive |
Leaders: MU $1.9B Bearish
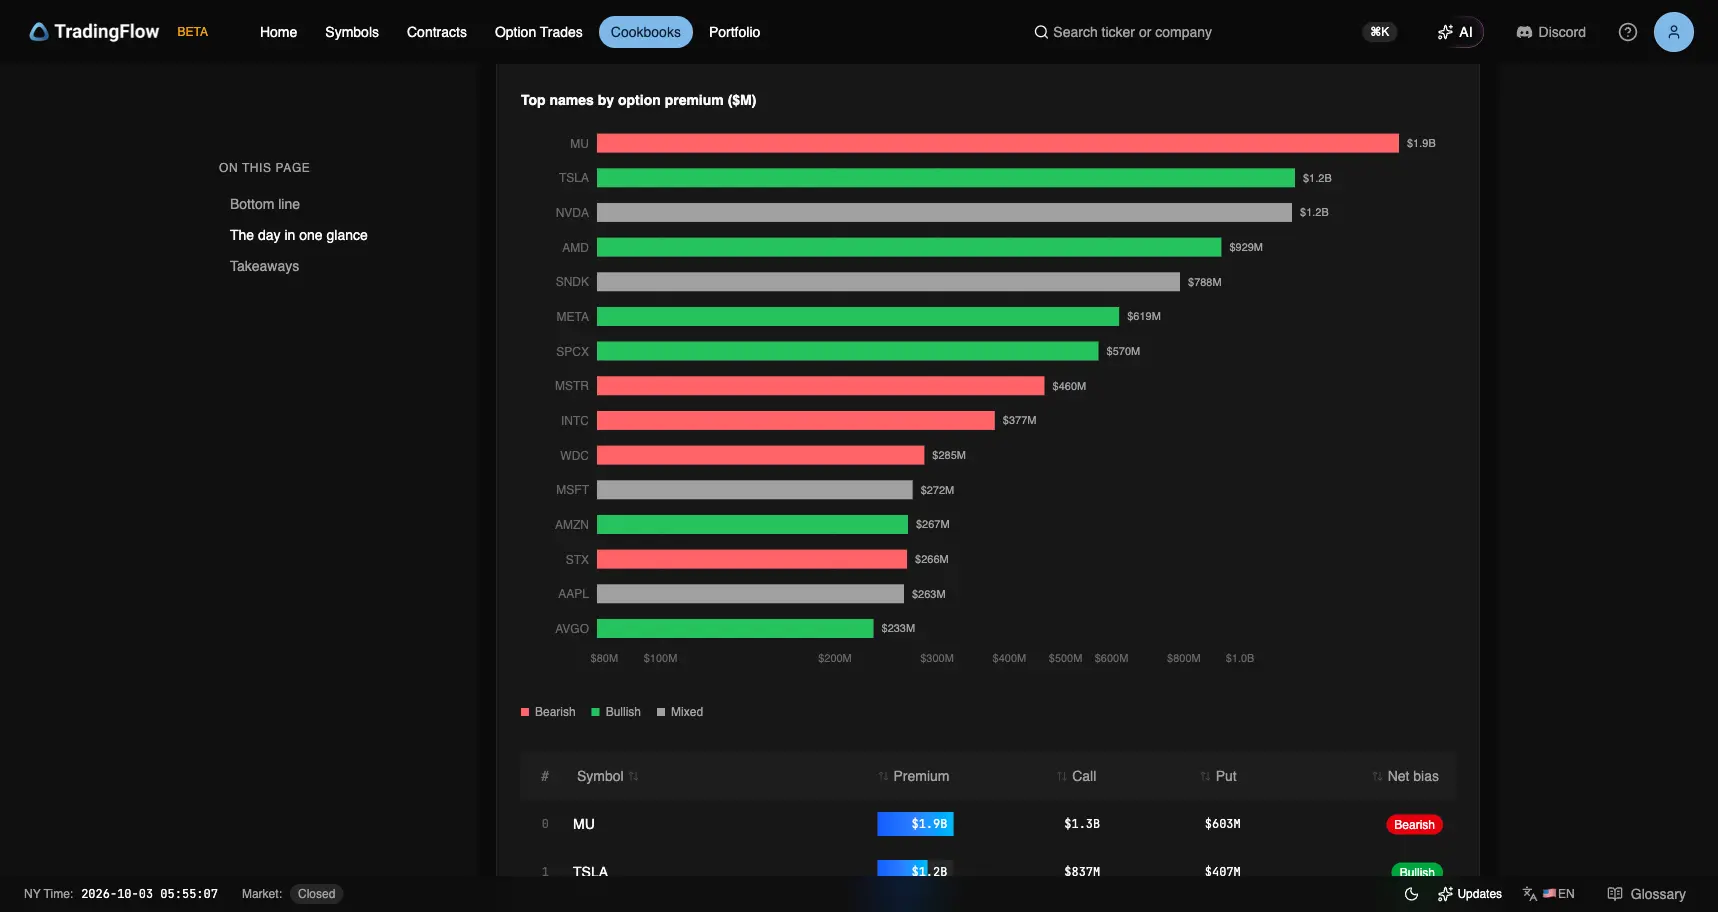
Test app, Step 2, session 2026-10-02. Color is net bias on that name, not a forecast. Captured October 3, 2026.
Top of the book:
| Symbol | Premium | Call | Put | Net bias |
|---|---|---|---|---|
| MU | $1.9B | $1.3B | $603M | Bearish |
| TSLA | $1.2B | $837M | $407M | Bullish |
| NVDA | $1.2B | $960M | $270M | Mixed |
| AMD | $929M | $690M | $238M | Bullish |
| SNDK | $788M | $435M | $353M | Mixed |
| META | $619M | $445M | $174M | Bullish |
The bottom line and glance print MU at $1.8B; the leaders table and headline cards print $1.9B. Quote both. Further down, MSTR is 87% calls ($398M of $460M) and tagged Bearish; WDC and STX are also tagged Bearish. Call share is not net bias.
First recorded window: 09:30, $3.2B. Timing alone does not prove intent.
Largest Net DEI: TSLA 289%, associated Net DEX Positive. Glance and Step 4 agree. Largest Net DEX: SPCX +5M shares-equivalent. DEI is unsigned magnitude versus typical volume; DEX is a separate signed classification. Neither proves trader identity or dealer inventory.
Highest IV rank among active names: AMZN 54, 30-day IV 39.4%. GOOG (51), AAPL (50), PANW (47), and INTC (42) follow. MU is not among the fifteen names on this chart.
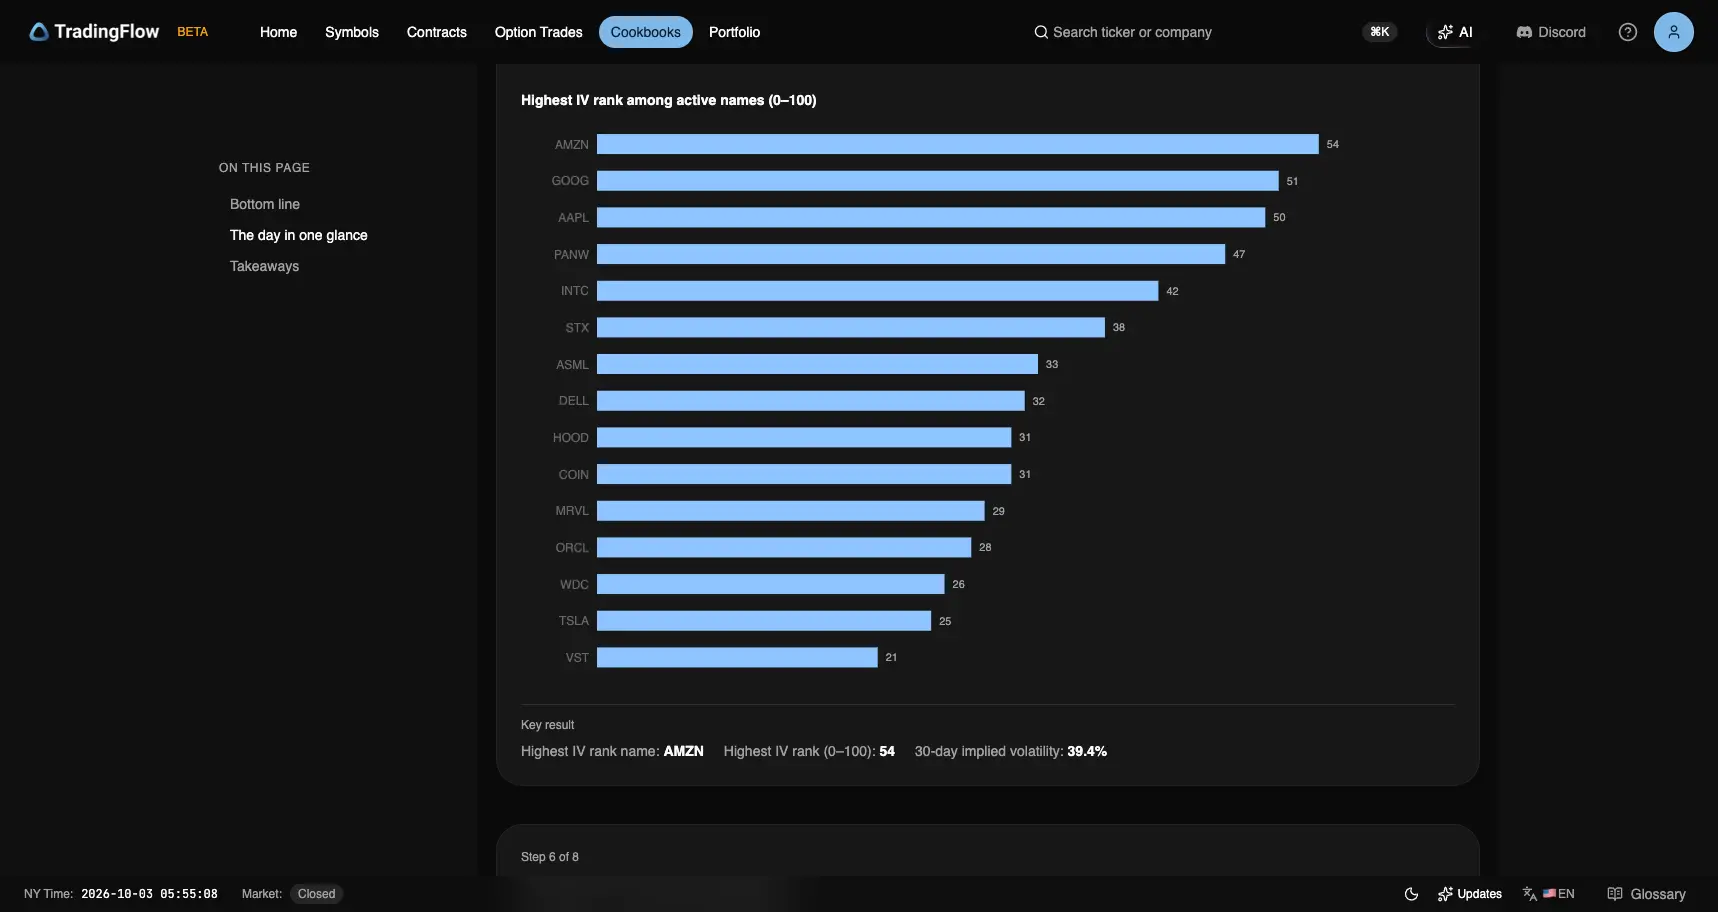
Same run, Step 5. IV rank places each name's 30-day implied vol within its own past year. Captured in the test app on October 3, 2026.
Index GEX: every row Positive
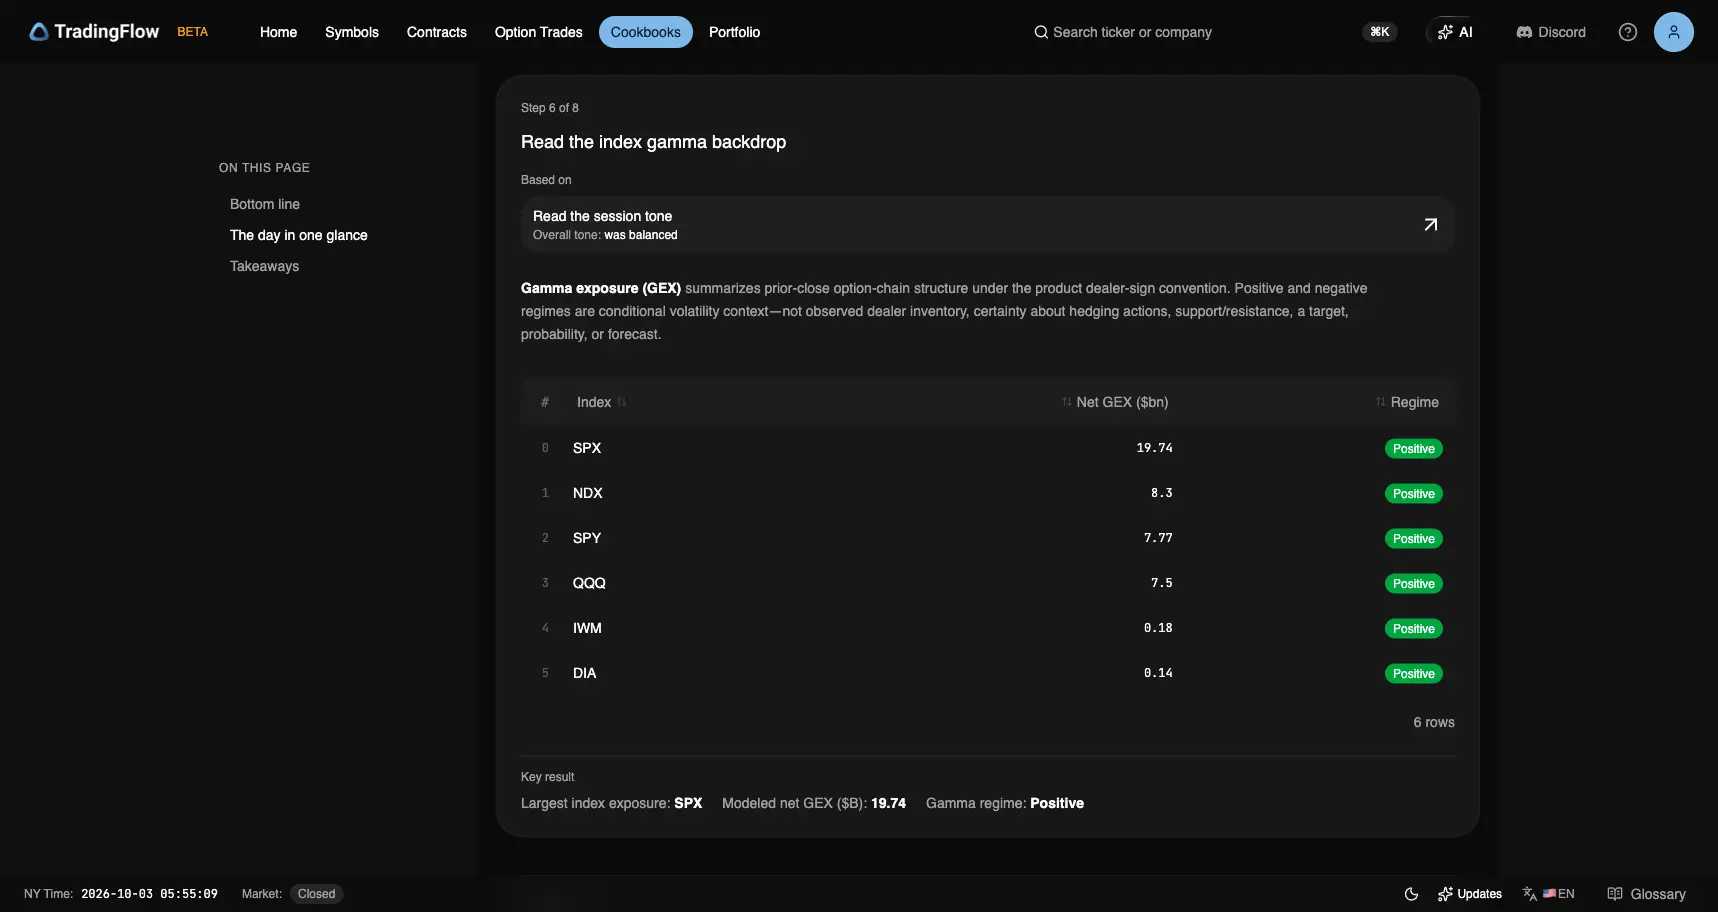
Test app, Step 6, session 2026-10-02. GEX is prior-close structure (T+1) under the product dealer-sign convention. Captured October 3, 2026.
| Index | Net GEX ($B) | Regime |
|---|---|---|
| SPX | +19.74 | Positive |
| NDX | +8.3 | Positive |
| SPY | +7.77 | Positive |
| QQQ | +7.5 | Positive |
| IWM | +0.18 | Positive |
| DIA | +0.14 | Positive |
On October 1 five of six rows were Negative, with SPX at −$37.95B and only NDX Positive. Here all six are Positive. It is the first all-Positive index table in this digest's daily editions, and the first Positive SPX reading since September 25 (+$80.06B). Those are snapshots one session apart, not a measured path. Positive GEX here is modeled structure, not observed dealer inventory, and not a floor.
Rank: both books closed inside the 0DTE band
The recap's index row is one number per index. Rank shows where that structure sat around price. Same session, Gamma Exposure, horizon Today · 0DTE. The recap's SPY row (+$7.77B) and Rank's SPY all-expiration total (+$4.3B) are different calculations; quote each with its source.
Session OHLC (Rank daily bar):
| Symbol | Open | High | Low | Close | Prior close (Oct 1) |
|---|---|---|---|---|---|
| SPY | 770.60 | 772.60 | 767.10 | 769.60 | 764.00 |
| SPXW | — | — | — | 7,722.70 | 7,666.40 |
Rank's SPXW daily bar for this session shows a high–low range of about 0.14%, against 0.71% on SPY; on every prior session in the table the two ranges match. This edition quotes the SPXW close only.
SPY 0DTE: close 769.60, between 769 and 770
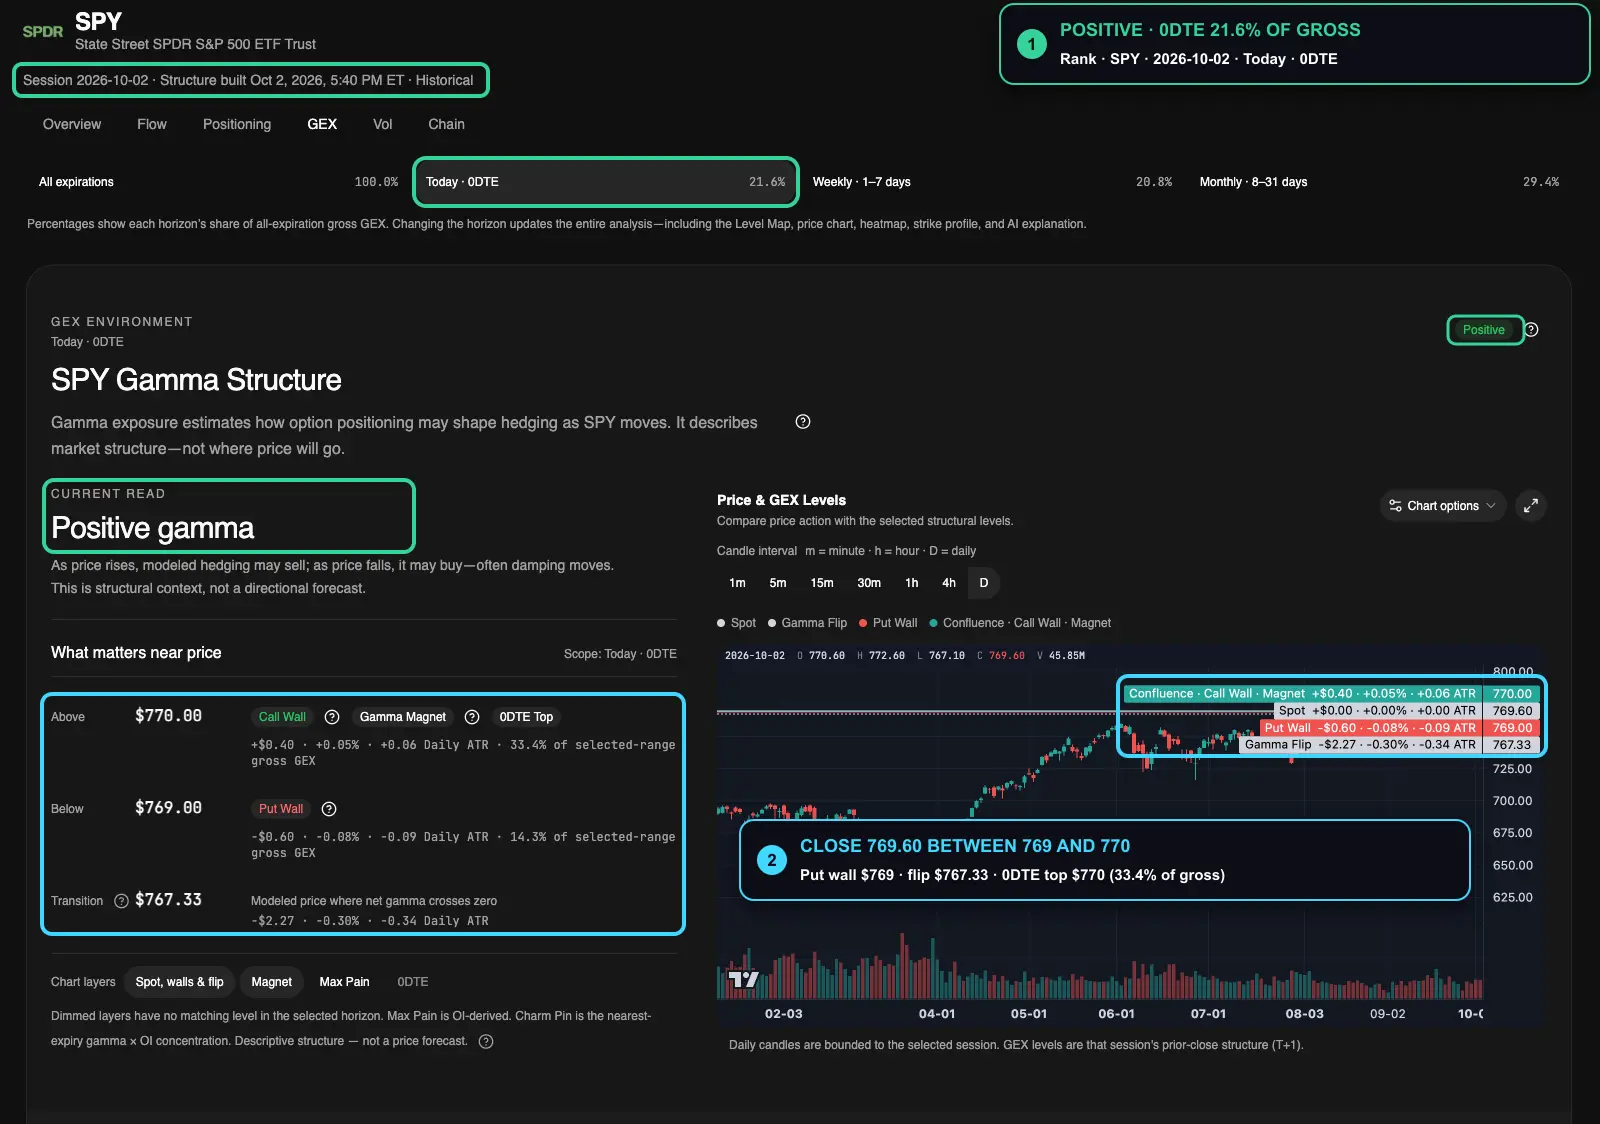
Test app, session 2026-10-02, horizon Today · 0DTE. Callout 1 is the lock: positive gamma, 0DTE 21.6% of all-expiry gross. Callout 2 is close versus the $769 put wall and $770 0DTE top. Structure built October 2, 5:40 PM ET. Captured October 3, 2026.
On this snapshot:
- Environment: Positive
- Net GEX: +$6.5B (gross $10.9B)
- Call wall / magnet / 0DTE top: $770.00 (33.4% of selected-range gross GEX)
- Put wall: $769.00 (14.3%)
- Flip: $767.33
- 0DTE share of all-expiration gross: 21.6%
- Close: $769.60
A third of this 0DTE book's selected-range gross sits on $770. The high (772.60) cleared it; the low (767.10) was 23 cents under the flip. The close came back between the put wall and the top. All-expiration SPY is also Positive (net +$4.3B, gross $50.5B), with the same $770 top, max pain at $760, and flip $768.62.
SPXW 0DTE: close 7,722.70, between 7,720 and 7,725
Cash SPX 0DTE lives on SPXW.
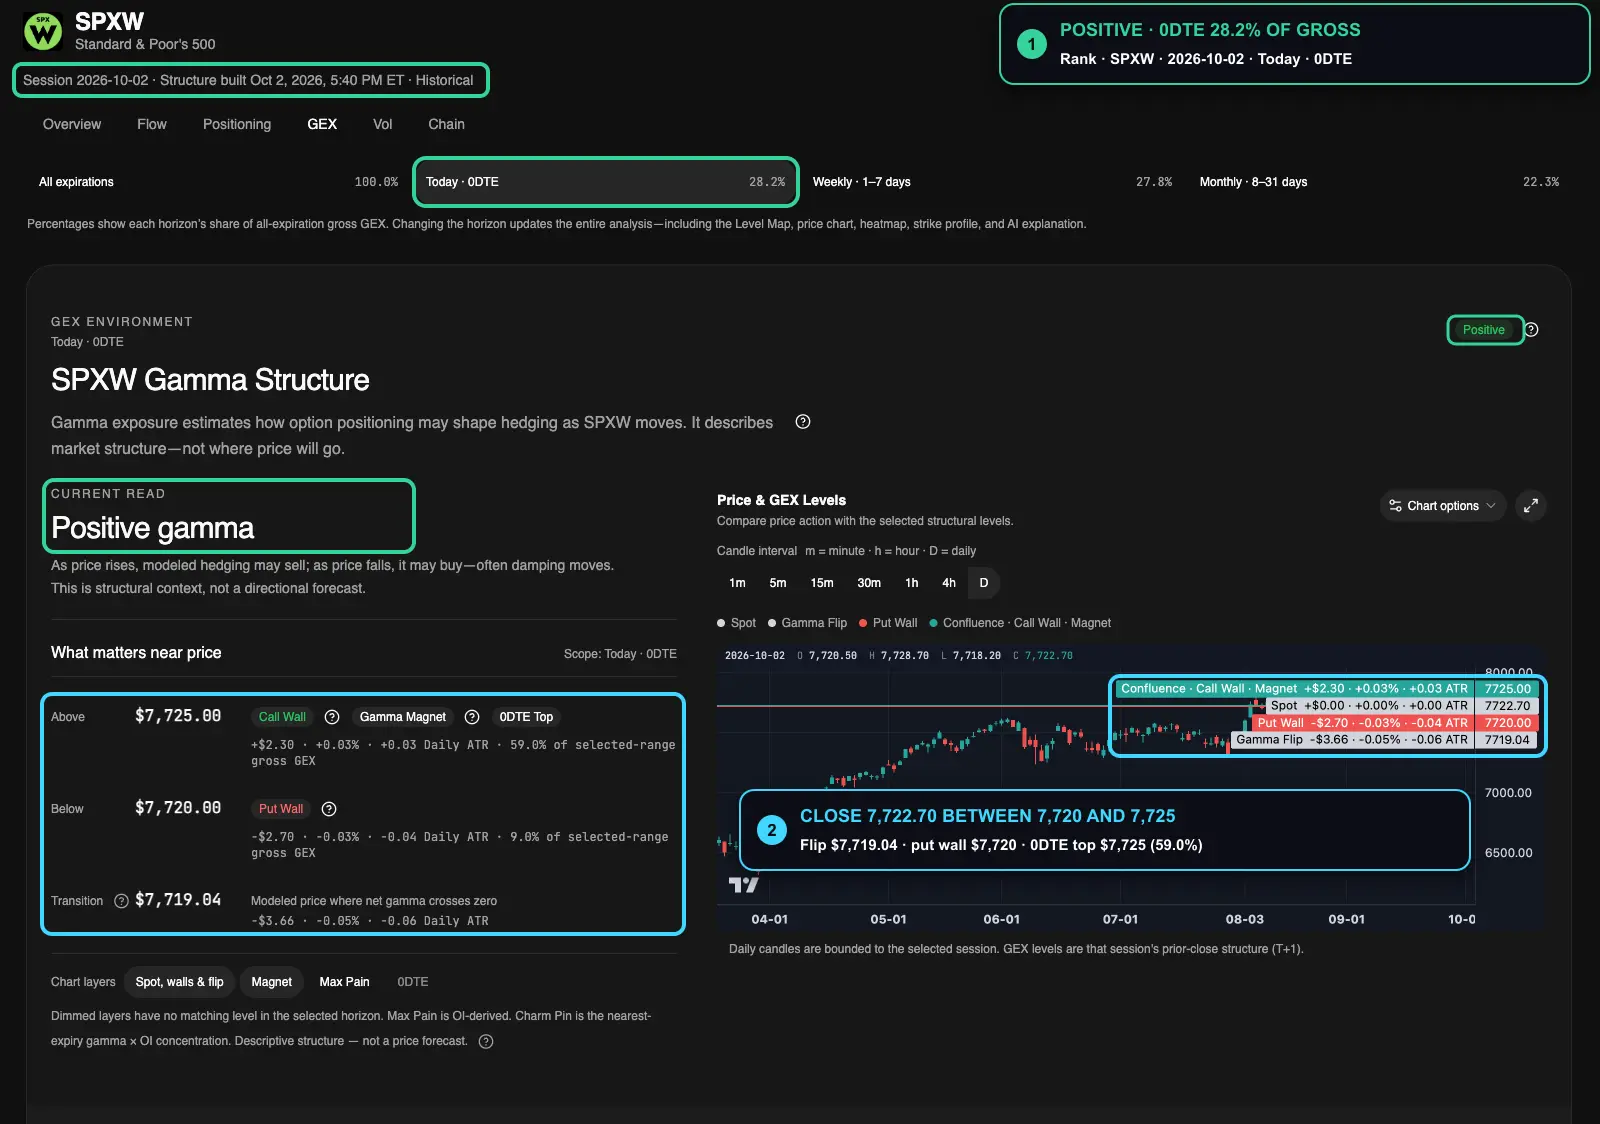
Same session, SPXW, horizon Today · 0DTE. Callout 1 is the lock: positive gamma, 0DTE 28.2% of all-expiry gross. Callout 2 is close versus the 7,720 put wall and 7,725 top. The OHLC strip in this frame shows the narrow SPXW daily bar noted above. Captured in the test app on October 3, 2026.
On this snapshot:
- Environment: Positive (net GEX +$8.6B, gross $68.4B)
- Call wall / magnet / 0DTE top: $7,725 (59.0% of selected-range gross GEX)
- Put wall: $7,720 (9.0%)
- Flip: $7,719.04
- 0DTE share of all-expiration gross: 28.2%
- Close: 7,722.70
More than half of this 0DTE book's selected-range gross sits on 7,725. The close was 2.30 under it and 3.66 above the flip. All-expiration SPXW is Positive (net +$51.5B, gross $242.4B), with the same 7,725 top, the same 7,720 put wall, and flip 7,684.36.
Two books, one shape, the same shape as September 25: a Positive 0DTE book with most gross on the top strike, and a close just under it. That is a description of one session against T+1 structure, not a pin forecast for the next one.
Headline name: MU at $1,075
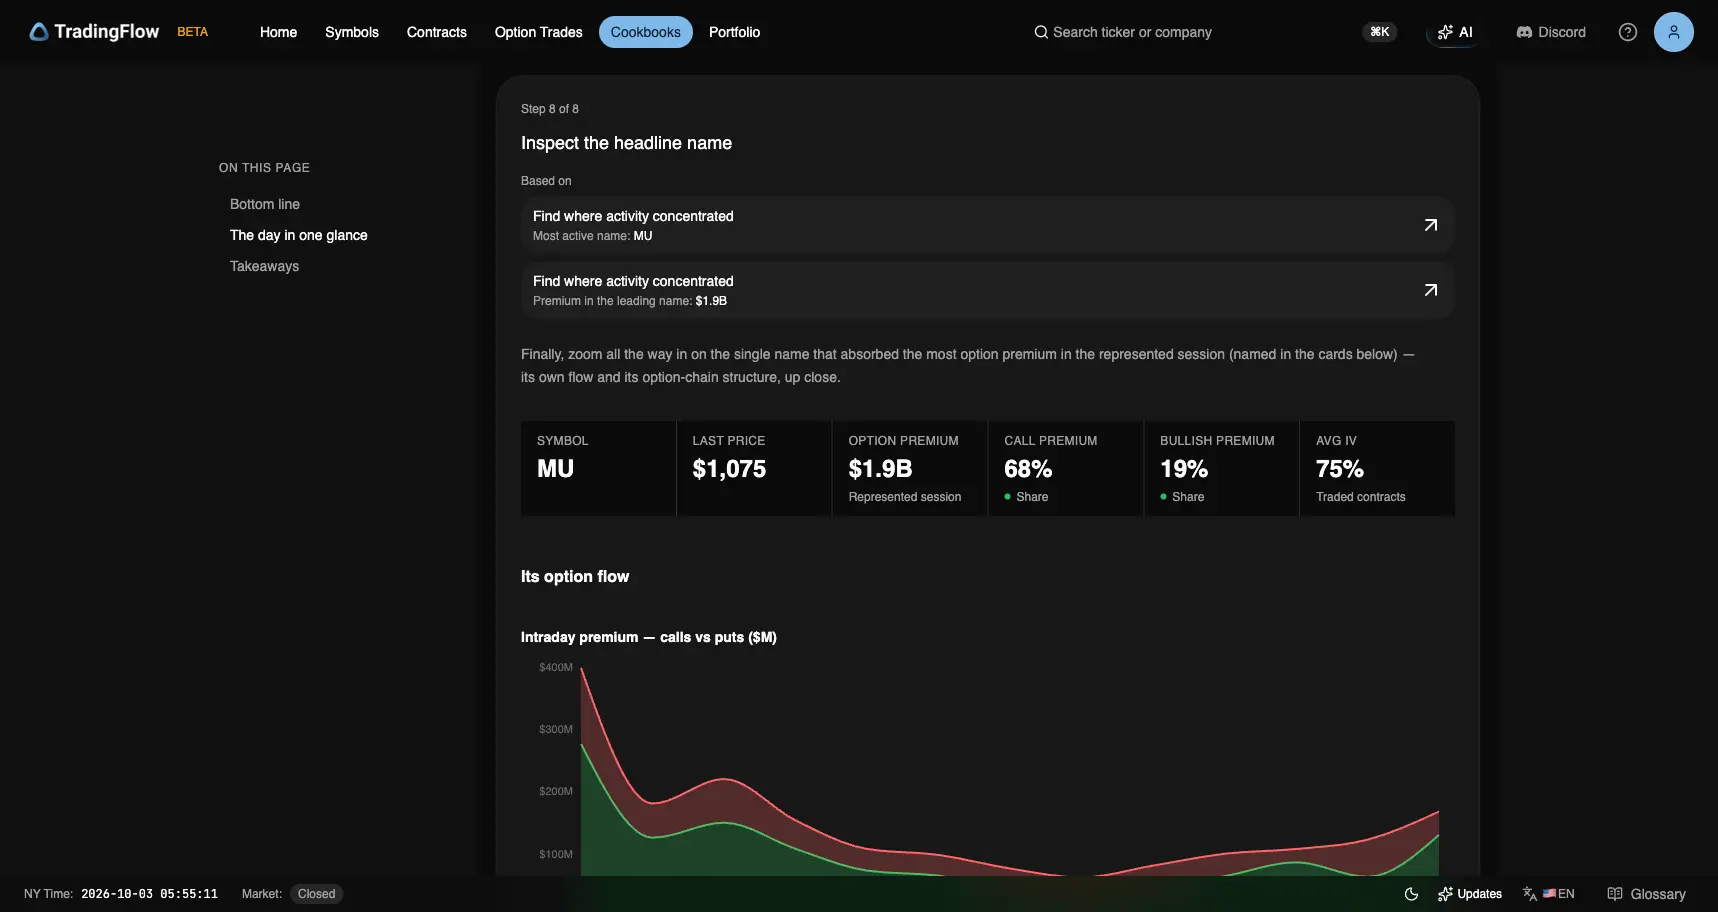
Test app, Step 8, session 2026-10-02. Headline name is the heaviest premium, not the biggest percent mover. Captured October 3, 2026.
MU on this run:
- Last: $1,075
- Option premium: $1.9B
- Call share: 68%
- Bullish share: 19%
- Average IV on traded contracts: 75%
Six sessions of MU at the top of the recap:
| Session | Premium | Net bias | Last | Avg IV |
|---|---|---|---|---|
| Sep 25 | $1.7B | Mixed | $1,082 | 75% |
| Sep 28 | $1.6B | Bearish | $1,054 | 79% |
| Sep 29 | $1.7B | Bearish | $1,065 | 93% |
| Sep 30 | $2.3B | Bullish | $1,069 | 105% |
| Oct 1 | $3.5B | Bullish | $1,098 | 72% |
| Oct 2 | $1.9B | Bearish | $1,075 | 75% |
MU premium fell back from $3.5B to $1.9B, and the net bias tag moved from Bullish to Bearish. Bullish share on the cards is 19%, the same as on October 1. Net bias is not bullish share.
Biggest prints (as the recap listed them):
| Time | Type | Strike | Expiry | Premium | Sentiment |
|---|---|---|---|---|---|
| 14:25 | PUT | 1,070 | 2027-01-15 | $11M | BEARISH |
| 10:43 | CALL | 1,100 | 2027-03-19 | $8M | NEUTRAL |
| 10:35 | CALL | 1,200 | 2026-12-18 | $8M | NEUTRAL |
| 13:45 | CALL | 1,220 | 2027-03-19 | $7M | BEARISH |
| 10:41 | PUT | 900 | 2027-06-17 | $6M | NEUTRAL |
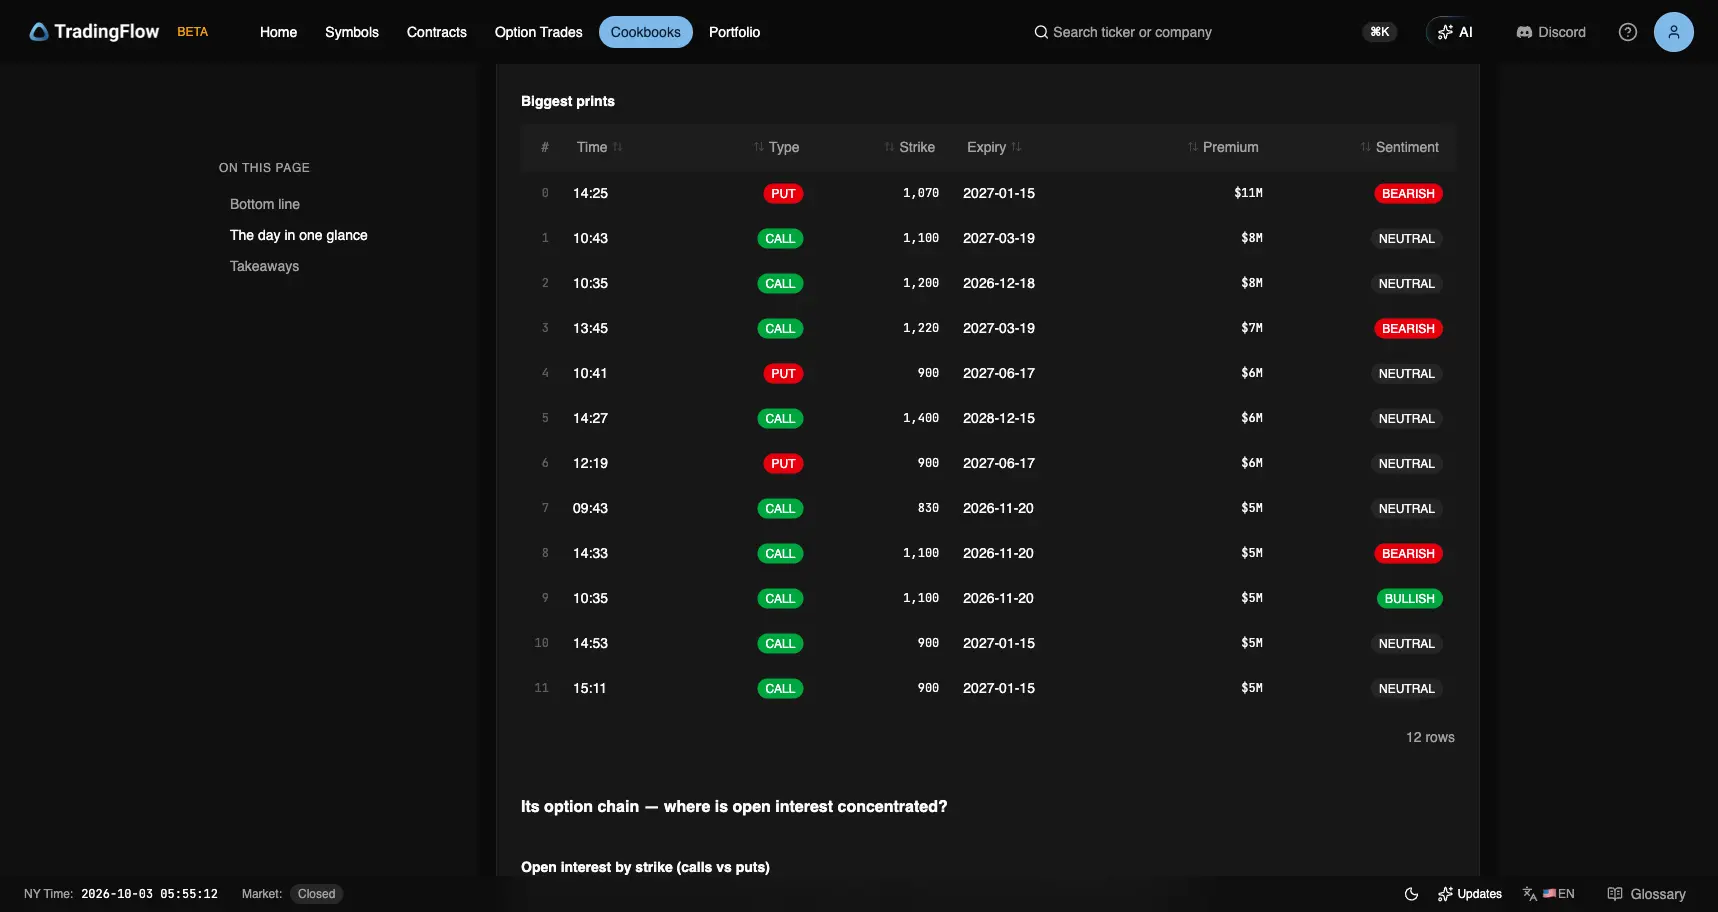
Same run, Step 8 prints table. The largest MU print is a put. Captured October 3, 2026.
The twelve listed MU prints add up to $77M, about 4% of MU's $1.9B. The largest is an $11M Jan-2027 1,070 put tagged Bearish, the first time in these six editions that MU's largest listed print is a put. The Nov-20 1,100 call appears twice with opposite tags: $5M Bullish at 10:35 and $5M Bearish at 14:33. Tags are feed-precomputed per ticket and do not prove who bought or sold.
Movers: XRPN +36.6%
- Bottom line: "the day's biggest mover was XRPN, up 36.6%."
- Step 7 key result (these runs): leading mover XRPN, +36.7%, direction Up.
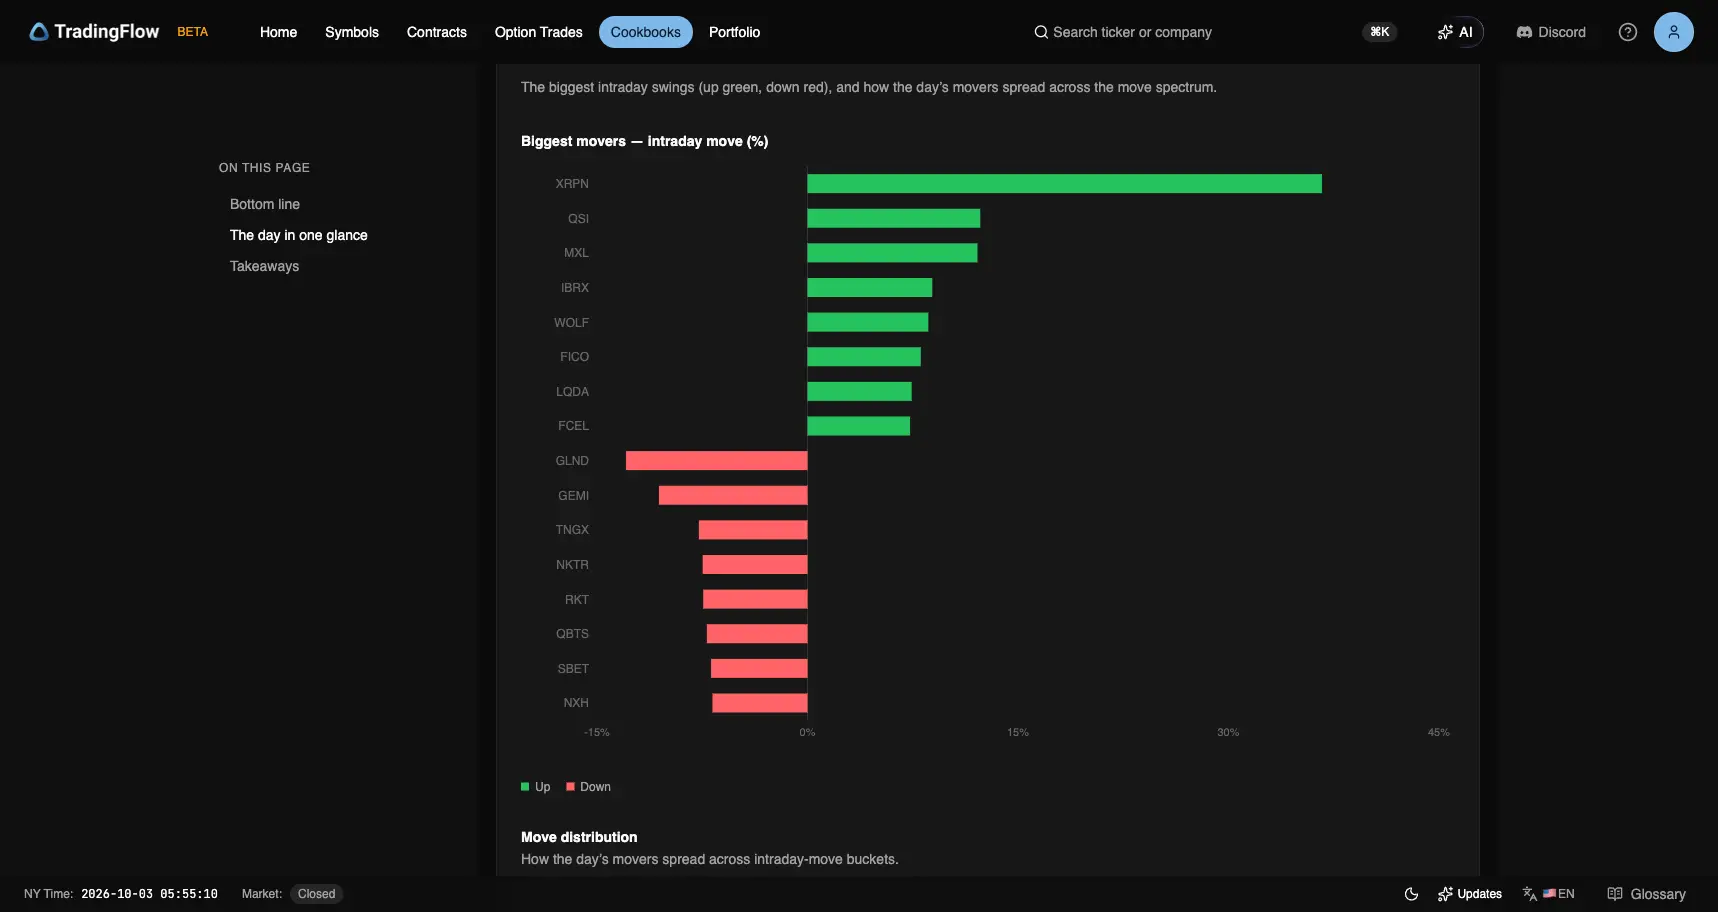
Test app, Step 7, session 2026-10-02. intraday_pct is an in-tape first-to-last underlying-price proxy. Captured October 3, 2026.
XRPN also led the bottom line on October 1 (+47.2%). The bottom line always names the day's largest gain; Step 7's key result can name the largest gain or the largest loss on different runs of the same session. Here the largest down bar is GLND. Movers are not intent.
What this session is evidence of
| Question | TradingFlow on Oct 2 | Clock |
|---|---|---|
| How large was the single-name tape? | $16.8B, 69% calls | Session premium |
| Did the tape lean? | Balanced 24% vs 23%; Neutral $8.9B | Session sentiment |
| Where did the dollars go? | MU $1.9B Bearish (glance $1.8B); TSLA $1.2B Bullish; NVDA $1.2B Mixed | Session leaders |
| When did premium arrive? | First window 09:30 $3.2B | 30-minute buckets |
| Largest Net DEI? | TSLA 289%, Net DEX Positive (glance and Step 4 agree) | Session DEI |
| Highest IV rank? | AMZN 54, 30-day IV 39.4% | T+1 snapshot |
| What was index GEX? | All six rows Positive; SPX +$19.74B | T+1 snapshot |
| Where did SPY close versus same-day structure? | 769.60, between put wall $769 and 0DTE top $770 (33.4%) | T+1 0DTE GEX + session OHLC |
| Where did SPXW close versus same-day structure? | 7,722.70, between put wall 7,720 and 0DTE top 7,725 (59.0%) | T+1 0DTE GEX + session close |
| What did MU print? | Last $1,075, 68% calls, 19% bullish; largest print 1,070P Jan-27 $11M Bearish | Headline name + tape |
| Biggest mover? | Bottom line XRPN +36.6%; Step 7 key these runs XRPN +36.7% | Two recap fields |
One session is not a trend. Proxies (intraday_pct, simplified GEX) are descriptive estimates, not price forecasts.
Reproduce the findings
- Open Daily Market Recap and lock session Oct 2, 2026 (or open market-recap~2026-10-02).
- Record the KPI strip: total premium, call/put share, bullish/bearish share, and the Bottom line sentence.
- Step 2: confirm MU $1.9B Bearish at the top, and note MU is $1.8B in the glance.
- Step 5 and Step 6: confirm AMZN 54 at the top of IV rank and all six index rows Positive.
- Open SPY Gamma Exposure → horizon Today · 0DTE. Record environment, walls, flip, and the daily OHLC. Repeat for SPXW. Sign-in and a paid entitlement may be required.
- Step 7 and Step 8: write down the bottom line's XRPN +36.6% and Step 7's key for your run, then the MU 14:25 1,070 put.
- Stop before "therefore sell MU" or "therefore the next session pins 770 / 7725."
TradingFlow App Home → Cookbooks → Daily Market Recap for the session lock → Symbols → GEX for walls and flip.
Related reading
- October 1 Recap: Balanced Tape, MU $3.5B, SPX GEX Negative
- September 30 Recap: Leaned Bullish, MU $2.3B, SPX GEX Negative
- September 25 Recap: Balanced Tape, MU $1.7B, SPX GEX Positive
- Daily Market Recap: read a full options session in Cookbooks
- Call/put walls on a pin day
- SPY / SPX / QQQ 0DTE evidence loop
Learn more
Related Articles
October 1 Recap: Balanced Tape, MU $3.5B, SPX GEX Negative
Daily Market Recap on the completed October 1 session printed $17.1B of single-name premium, 60% in calls, with tone balanced at 23% bullish vs 23% bearish. MU led a fifth session running at $3.5B (Bullish). SPX GEX was Negative at −$37.95B, with SPY and QQQ Negative too, and Rank showed SPY closing on its $764 0DTE top.
September 25 Recap: Balanced Tape, MU $1.7B, SPX GEX Positive
Daily Market Recap on the completed September 25 session printed $15.6B of single-name premium, 70% in calls, with tone balanced at 22% bullish vs 23% bearish. MU led at $1.7B (Mixed). SPX GEX was Positive at +$80.06B, and Rank showed SPY and SPXW closing between their 0DTE put wall and 0DTE top.
September 30 Recap: Leaned Bullish, MU $2.3B, SPX GEX Negative
Daily Market Recap on the completed September 30 session printed $14.0B of single-name premium, 67% in calls, with tone leaned bullish at 24% bullish vs 22% bearish. MU led a fourth session running at $2.3B, now tagged Bullish. SPX GEX was Negative at −$17.39B while QQQ flipped to Positive; Rank's all-expiration SPY book was Negative with the close under the flip.