
Daily Market Recap: Read a Full Options Session in TradingFlow Cookbooks
TradingFlow's Cookbooks turn a live options-flow session into a guided report. Daily Market Recap walks eight chapters — tone, money flow, timing, DEX/DEI, volatility, GEX, movers, and a headline name — each with real evidence next to the explanation, not baked-in prose.
Most options flow research starts the same way: open a scanner, stare at a wall of rows, and try to reconstruct what the whole session actually did. Cookbooks is TradingFlow's answer to a narrower, more specific need — you don't always want to build that read yourself. Sometimes you want someone to have already built it, correctly, from the same data, this morning.
Daily Market Recap is the flagship example: an official, guided report that walks one U.S. options session end to end — tone, money flow, timing, directional exposure, volatility, gamma structure, movers, and a single headline name — with the chart or table that backs each claim sitting right beside it.
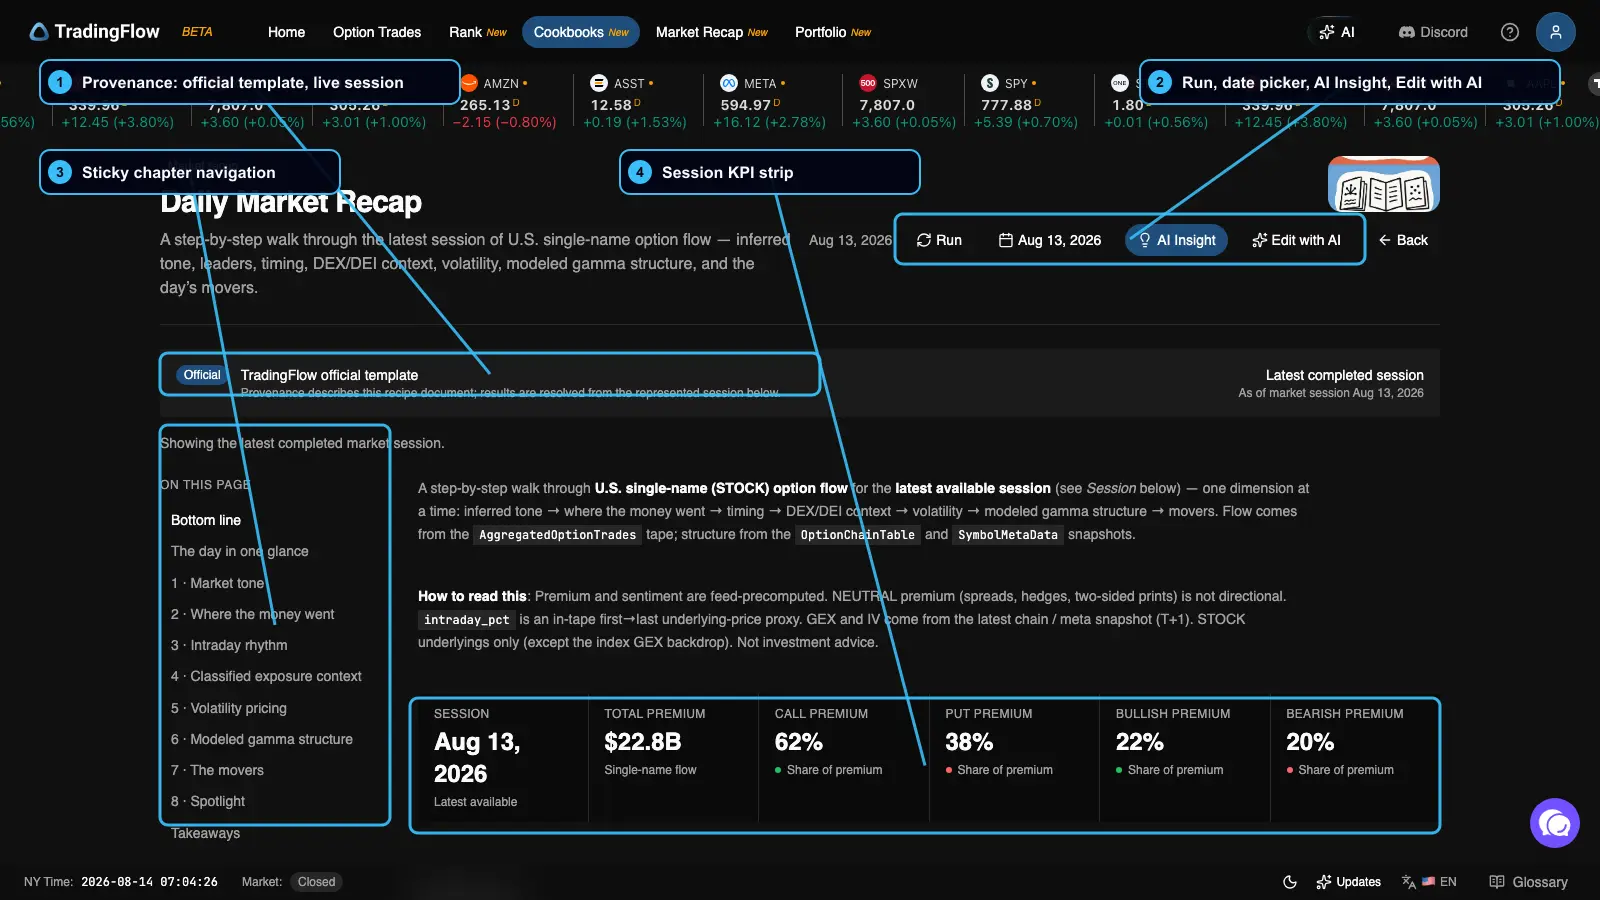
A real Daily Market Recap run, annotated: (1) provenance and the exact session represented, (2) Run / date picker / AI controls, (3) the sticky chapter navigation, (4) the session's headline numbers. Session values change as new snapshots become available.
What a "cookbook" actually is
TradingFlow calls a report a recipe, and the library of them Cookbooks. That name is worth taking literally: a recipe is not a page of pre-written commentary. It's a specification — which queries to run, which charts and tables to render, in what order — that gets executed live, every time you open it.
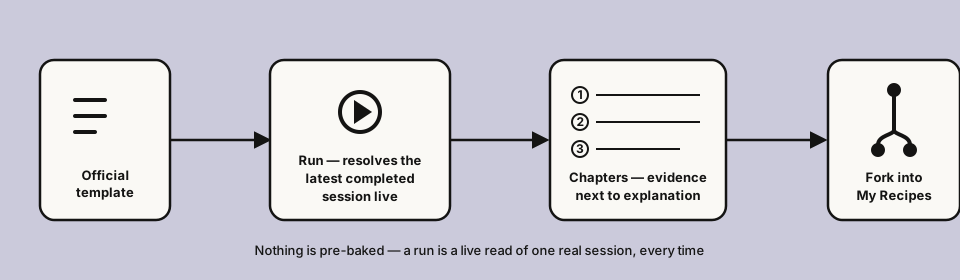
Nothing in a recipe is baked ahead of time. Two people opening the same template on the same day get the same numbers, computed fresh.
Two kinds of recipe live in the same gallery:
- Official templates — built and maintained by TradingFlow. The catalog grows as new research jobs are added; the Recipes directory is the current inventory rather than a fixed list in this article.
- My recipes — private, owner-only reports, either forked from an official template or started blank. Creating and editing recipes is a separate limited rollout, even for paid accounts.
Open the gallery at Cookbooks.
Reading the session, chapter by chapter
Daily Market Recap organizes one session into eight numbered chapters, each pairing a short explanation with the exact chart or table behind it. Here's what a real run showed for the session of August 13, 2026 — read as a worked example, not a template you should expect to repeat.
1 · Market tone
The first question a recap answers: was the session's money risk-on or risk-off? Every option ticket is tagged bullish, bearish, or neutral, then stacked by premium.
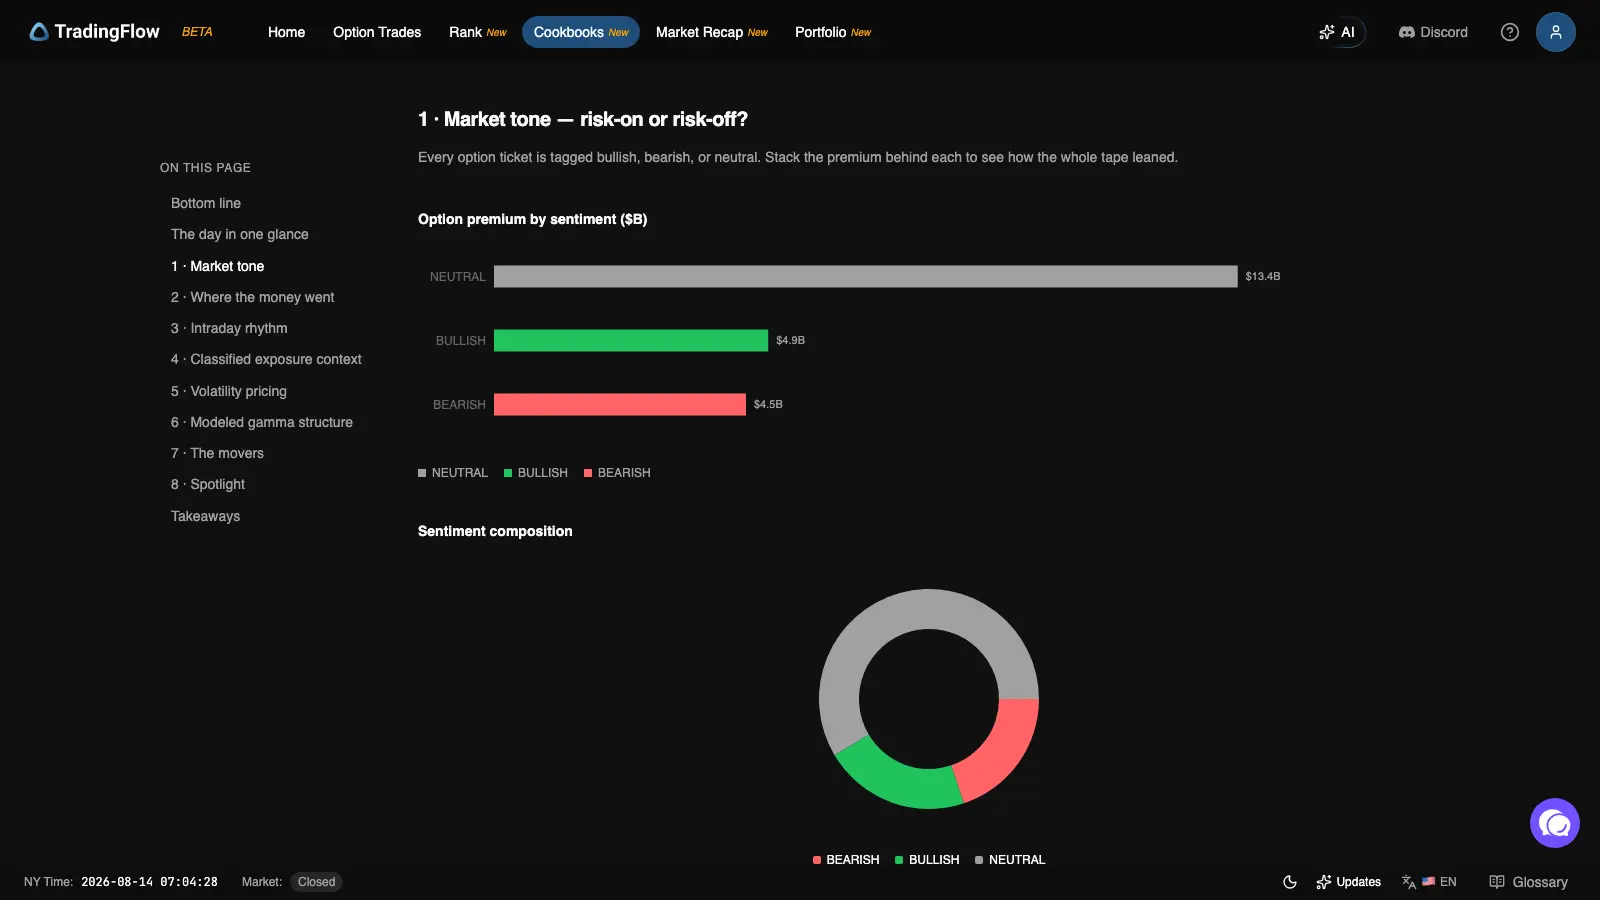
This session: $13.4B of premium landed in trades the report classifies as neutral (spreads, hedges, two-sided prints — not directional), against $4.9B bullish and $4.5B bearish. The lesson generalizes even when the exact split doesn't: on most sessions, non-directional flow is the largest bucket, and reading only the bullish-vs-bearish split overstates how one-sided the tape really was.
2–3 · Where the money went, and when
The next two chapters zoom from "how much" to "which names" and "what time." Money-flow-by-name ranks the session's heaviest-premium tickers; intraday rhythm buckets that same flow by time of day, so you can see whether conviction built steadily or arrived in one burst near the close.
4–5 · Classified exposure, and volatility pricing
Chapter four turns to direction: Net DEX and Net DEI for the session, the same metrics covered in TradingFlow's Rank workbench, here summarized at the whole-market level instead of per name. Chapter five reads where implied volatility ranks today versus its own recent history — see Greeks & GEX for what IV rank means and why a single IV number needs that context to be useful.
6 · Modeled gamma structure
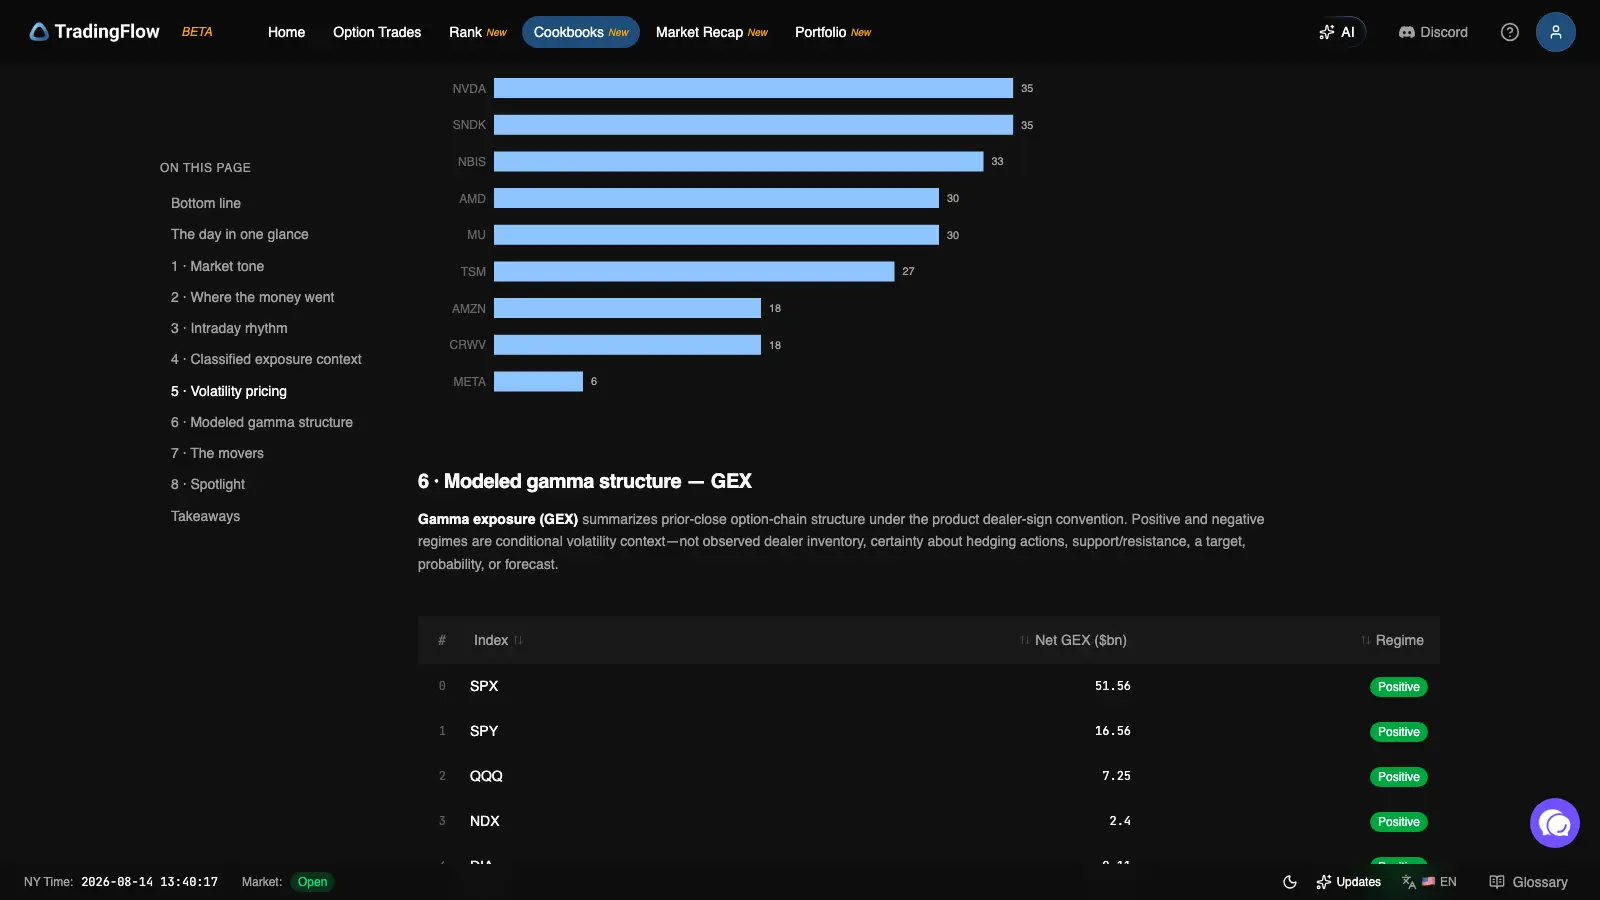
A prior-close GEX read across the major indices. This session, SPX, SPY, QQQ, and NDX all modeled a positive gamma regime — a real structural fact, but not a prediction. Positive and negative regimes are conditional volatility context, not observed dealer inventory, a support/resistance guarantee, or a target. Read the full mechanics in Call Walls, Put Walls, and Max Pain.
7 · The movers
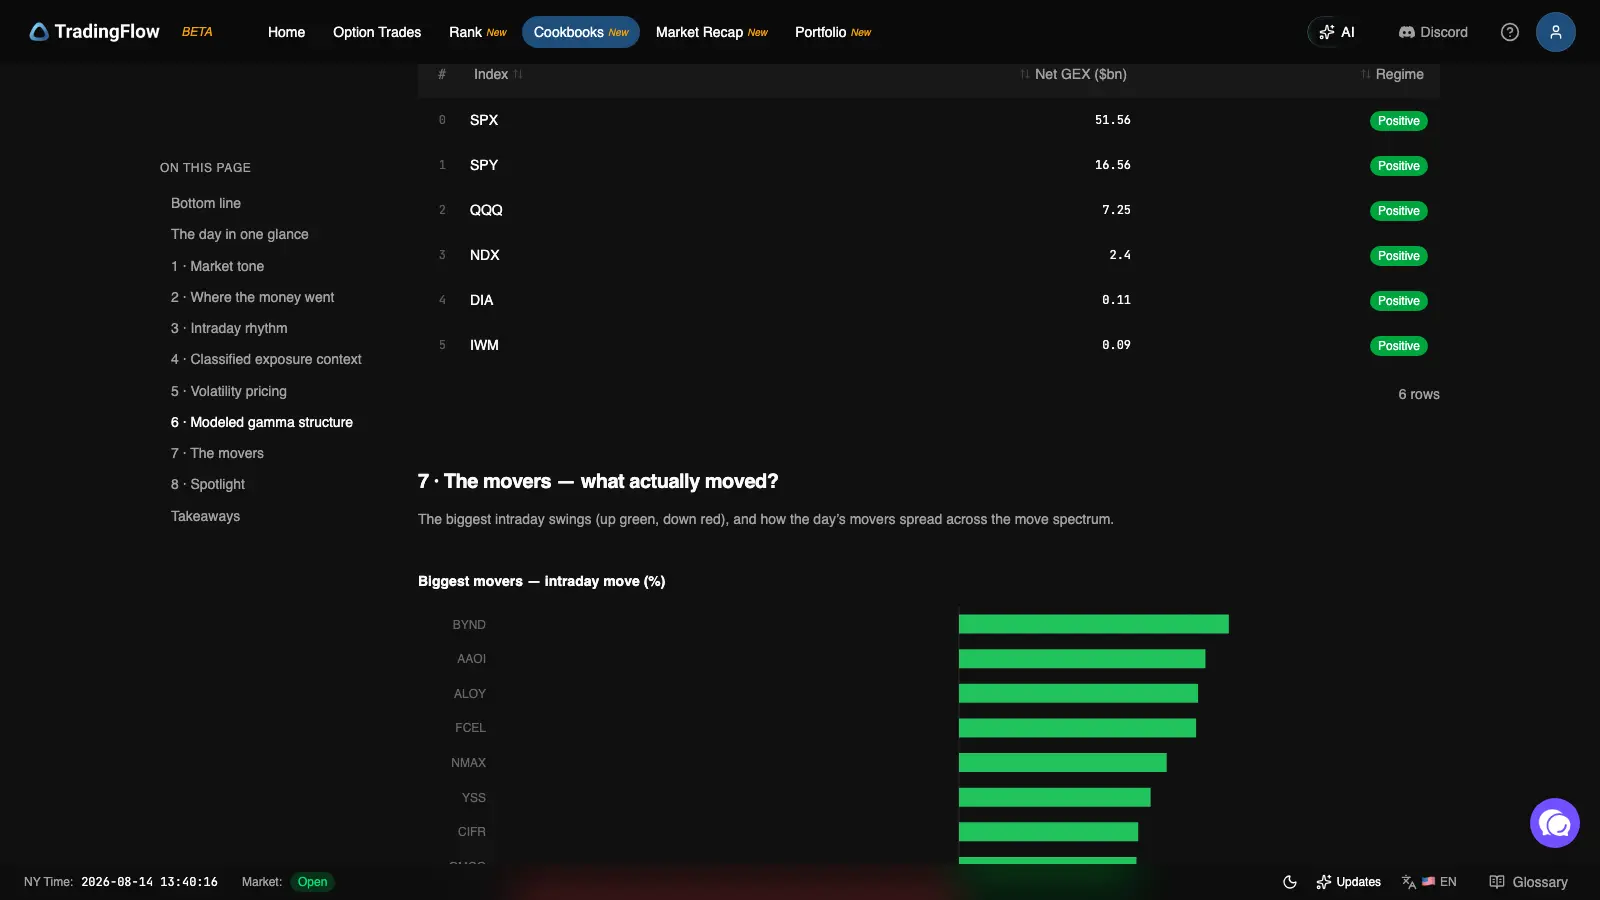
Every stock that moved meaningfully, bucketed by how far it moved intraday. This chapter answers "how much actually happened today," independent of the flow chapters above it — a session can have loud option flow around names that barely moved, or a quiet flow session with one outlier.
8 · Spotlight
The final chapter zooms all the way in: whichever single name absorbed the most option premium that session gets its own card — last price, option premium, call/put premium split, and average IV on traded contracts — plus its own intraday flow chart. It's the same drill-down a trader would do by hand after chapter 2 flagged a name; the report just does it for you, on the name the data itself picked.
How to read the numbers honestly
Every Daily Market Recap run opens with a short "how to read this" note, and it's worth repeating because it changes how you should treat every chapter above:
- Sentiment is feed-precomputed, not a live judgment call. A "neutral" print is not a third directional bucket — it means the trade doesn't cleanly read as either side.
- GEX and IV come from the latest chain snapshot (T+1), not the live tape. They describe structure as of the last available close, alongside same-session flow — two different clocks, always labeled as such.
- The scope is U.S. single-name (stock) option flow, except where the report explicitly steps out to an index GEX backdrop.
- None of this is investment advice, and no chapter claims to identify a trader, a motive, or what happens next.
Freshness: which session am I looking at?
A report always names its represented session and whether that's the latest completed session or a date you chose. "Latest" follows the market calendar, not the clock on your wall — before the open, and on weekends or holidays, it means the most recently completed session, never a day that hasn't traded yet. Press Run to re-resolve the same template live, or use the date picker to read any earlier session; historical runs are computed on demand too, nothing is pre-rendered and waiting.
AI Insight and recipe authoring
AI Insight sends this specific run's data to TradingFlow AI for an on-demand plain-language explanation of what's in front of you — not a general chat and not a change to the recipe.
Recipe authoring is a separate limited rollout with its own account, AI-consent, and credit gates. If the controls are available, the workflow is explicit:
- Select Edit with AI on an official report to fork it, or New recipe in the gallery to start blank. The official template never changes.
- Describe the report or adjustment in the AI sidebar.
- Review the live preview, including its inputs, evidence blocks, charts, links, and interpretation limits. A rendered draft is not yet saved.
- Refine the draft, then select Save or Save as… deliberately.
- Open the owner-only result under My recipes, select a session and any declared inputs, and run it as a report.
If you do not see New recipe, Edit with AI, or Edit recipe, authoring is not available on that account; paid users can still run the complete official catalog. Saved user recipes are private—there is no public, organization, or share-link state.
The free/paid boundary
Cookbooks works differently from Option Trades and Rank: there's no free preview tier. The gallery, every official report, and every private recipe all require a paid plan — a guest or unpaid signed-in visitor is routed to sign in and then to the paywall, and returns to the exact page they tried to open once they subscribe.
What Daily Market Recap intentionally does not do
- It does not score conviction or assign a confidence number to any chapter.
- It does not identify who traded, or why.
- It does not treat "neutral" as a directional lean, or GEX regime as a price target.
- It does not claim same-day open interest — OI context anywhere in TradingFlow is a snapshot comparison, never a tick-by-tick fact.
- It does not repeat itself across sessions from a cached copy — every run is a fresh read of the date it names.
A practical way to use it
| Step | Surface | Question |
|---|---|---|
| Read | Daily Market Recap | What did the whole session look like — tone, money flow, timing, structure? |
| Zoom in | Rank Symbols | Of the names the recap flagged, which is worth a closer look right now? |
| Validate | Option Trades | Are the exact prints behind that name's flow real, and do they look like opening activity? |
| Confirm | Next session's Recap or Rank | Did open interest and the next day's tone actually follow through? |
Treat the recap as a starting map, not a conclusion — the same discipline TradingFlow applies to every ranked row or flagged contract elsewhere in the product.
Open it
Open Daily Market Recap in TradingFlow
For the concepts behind each chapter, read:
- Cookbooks & Market Recap tutorial — the full walkthrough, with the freemium boundary and every chapter explained
- Delta Exposure (DEX) explained
- Gamma Exposure (GEX) explained
- Call Walls, Put Walls, OI, and Max Pain
- Option Flow Glossary
Daily Market Recap is a research and reporting tool. It is not investment advice, and no chapter in it is a trading signal on its own — pair it with your own risk management before acting on anything it shows.
Ready to read today's session? Open TradingFlow.
Related Articles
GEX Flow Evidence: Read Session Flow at Mapped Walls
TradingFlow’s Session flow at mapped walls places same-session options flow beside canonical Call and Put GEX Walls, with transparent Flow-aligned, Flow-against, and Mixed flow verdicts.
How to use TradingFlow when trading ES/SPX intraday
A practical intraday workflow for ES and SPX traders: use Rank for market context, analyze SPXW gamma exposure, inspect chain structure, find contract candidates, and validate the tape in Option Trades.
GEX Scanner & Screener: Gamma Exposure, Call Walls & Put Walls
Use TradingFlow’s GEX scanner inside Rank Symbols for gamma exposure, call walls, put walls, volatility, OI, and option-chain context—after you rank options flow.