How to use TradingFlow when trading ES/SPX intraday
A practical intraday workflow for ES and SPX traders: use Rank for market context, analyze SPXW gamma exposure, inspect chain structure, find contract candidates, and validate the tape in Option Trades.
If you are trading ES or SPX intraday, use TradingFlow as the options-flow and index-context layer beside your execution chart. Your futures chart still owns entries, stops, and order execution. TradingFlow answers a different question:
Is the listed-options tape confirming, fading, or complicating the move I am seeing in ES/SPX?
That distinction matters. ES is the CME E-mini S&P 500 futures product, while SPX/SPXW are Cboe S&P 500 index options. TradingFlow is not a futures order-book replacement. It helps you read index and ETF options pressure around the same market you are trading.
This walkthrough is a workflow guide, not investment advice or a signal service.
The intraday setup
Keep three TradingFlow surfaces open:
- Rank -> Symbols for the market-level read.
- Rank -> Contracts for contract-specific candidates.
- Option Trades for trade-level validation.
Inside Rank -> Symbols, keep the symbol drawer in the rotation too: GEX for dealer-gamma structure, Chain for strike-level contract context, Positioning for OI context, and Vol for implied-volatility context.
For ES/SPX, the practical watch set is usually SPXW / SPX / XSP / SPY, plus the mega-cap names that are pulling the index. SPX options are cash-settled index options, while SPY options are ETF options, so do not treat them as identical instruments. In TradingFlow, use them together as context: SPXW/XSP for index option pressure, SPY for ETF option flow and liquidity, and ES for your execution chart.
Step 1: Start with Rank Symbols
Open Rank -> Symbols at /app/rank/symbols. Start here before looking at individual prints.
![]()
Read the page from top to bottom:
- SPXW / XSP tape: confirm the index tape is active and aligned with the session you care about.
- Session freshness: make sure the page is reading the latest active or completed session, not a stale date.
- Market pressure cards: check whether directional pressure is balanced or lopsided.
- Flow / Vol lens: start in Flow for directional activity, then use Vol when your question is about implied-volatility context.
For an ES trader, this is the first filter. If ES is breaking higher but the symbol-level read shows defensive put pressure and negative directional exposure, the move may be less clean. If ES is holding above a level and the options tape shows broad call-side pressure, the flow backdrop is more supportive.
Do not overread DEI as direction by itself. In TradingFlow, DEI is a magnitude signal: how large the impact is. Read direction separately from Net DEX, sentiment, and the bullish-vs-bearish split.
Step 2: Inspect SPXW chain context
When the index tape matters, open the symbol drawer for SPXW and use the Chain, GEX, Positioning, and Vol tabs as context layers.
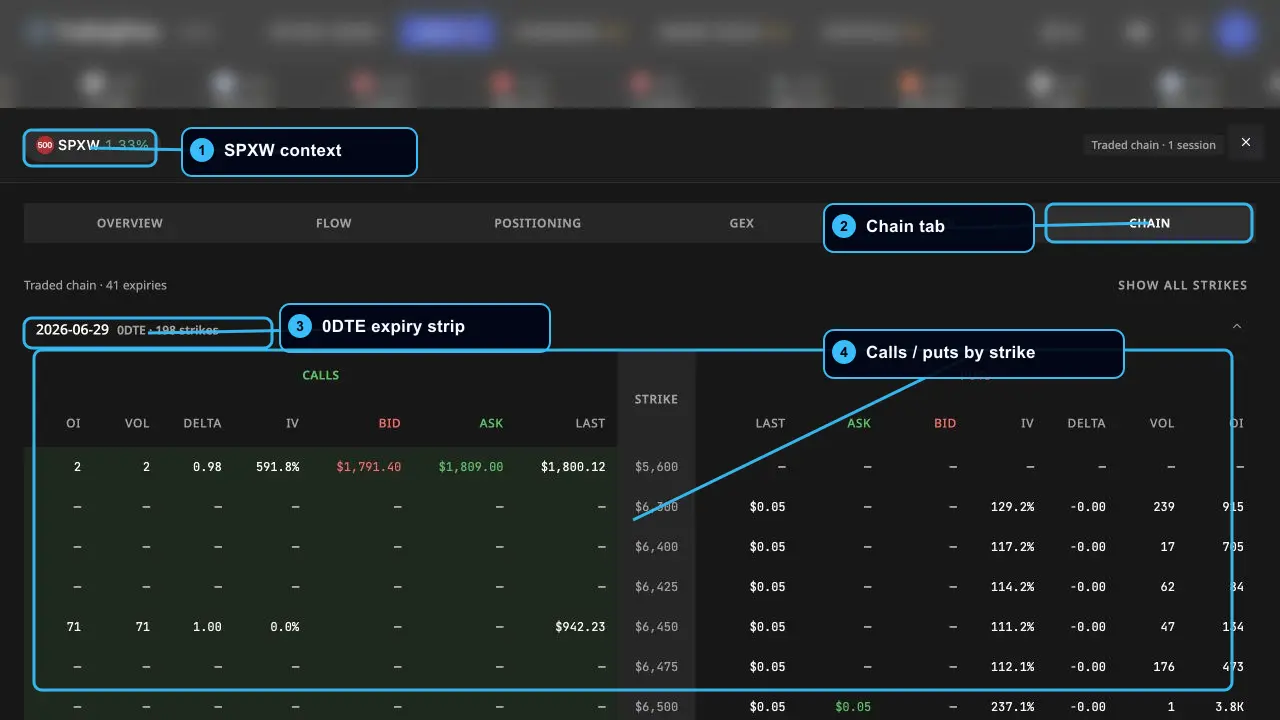
The Chain tab is useful during the session because it keeps the strike ladder in front of you:
- Which expiries are active, especially 0DTE.
- Where calls and puts are concentrated by strike.
- Whether bid/ask and last prices are live enough for context.
- Whether OI and volume are meaningful or thin.
Use this to mark levels on your ES/SPX chart, not to create a blind entry. If a strike is busy, ask: is price approaching it, rejecting it, or pinning around it? Then check whether Option Trades confirms aggressive buying/selling around that level.
Step 3: Analyze Gamma Exposure
Gamma Exposure (GEX) is the structural backdrop behind the intraday tape. In TradingFlow, open Rank -> Symbols, open the SPXW drawer, then switch to the GEX tab.
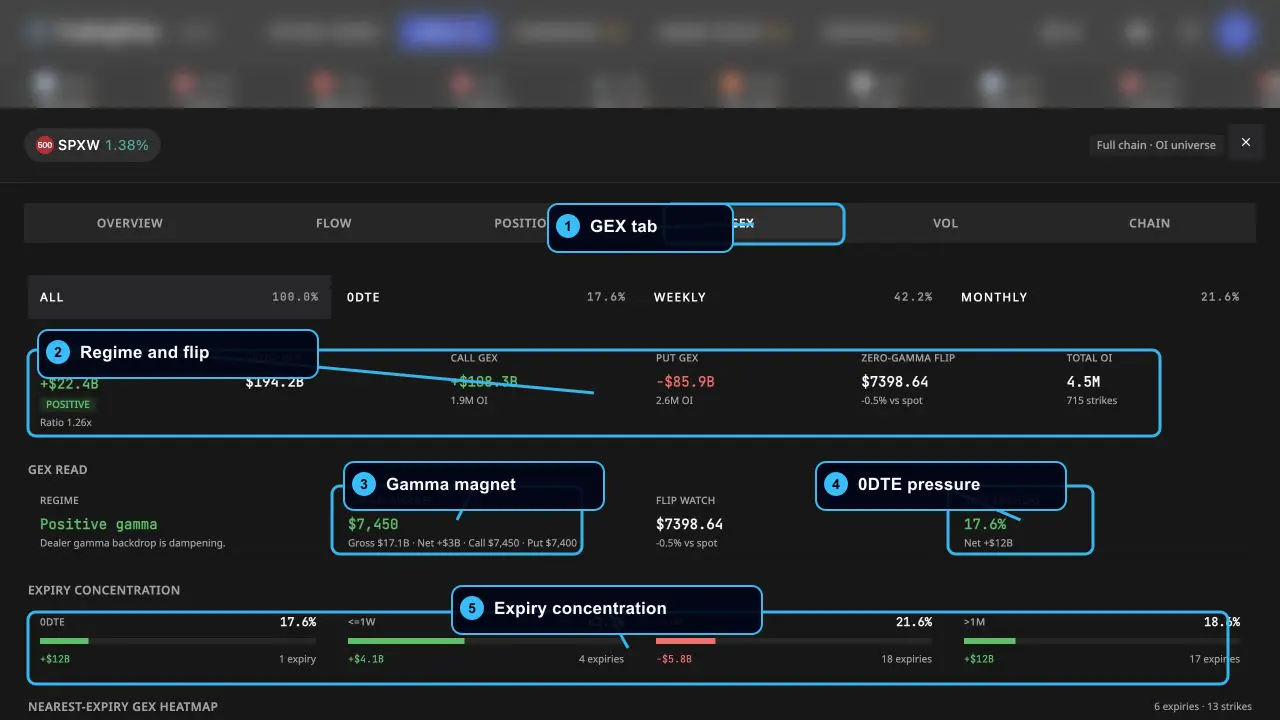
Read the GEX tab in this order:
- Regime and flip: Start with Net GEX, call GEX, put GEX, and the zero-gamma flip. Positive gamma usually suggests a more dampened or pinning-prone backdrop; negative gamma or a nearby flip can make ES/SPX moves more unstable.
- Gamma magnet: Check the strike with the largest gross gamma pull. If ES/SPX is trading near that level, expect more pin/reversion risk unless the tape is strong enough to pull away.
- 0DTE pressure: On index days, 0DTE can dominate the intraday feel. A large 0DTE share means same-day positioning can matter more than longer-dated structure.
- Expiry concentration: Compare 0DTE, weekly, monthly, and longer-dated buckets. If GEX is concentrated in the front bucket, your read should be more intraday-sensitive; if longer expiries dominate, the structure is usually less reactive minute to minute.
- Heatmap and strike profile: Use the nearest-expiry heatmap and GEX-by-strike chart to find where the largest positive and negative zones sit around spot.
The practical ES/SPX interpretation:
- Positive gamma + price near the gamma magnet: Be more skeptical of breakouts until Option Trades shows repeated aggressive flow. The market may chop, pin, or mean-revert around the strike.
- Price approaching the zero-gamma flip: Treat that area like a regime boundary. If price crosses and flow confirms, moves can become cleaner; if it rejects, the flip level can become a useful risk marker.
- Heavy 0DTE pressure: Watch for fast intraday changes. Same-day options can change the feel of ES/SPX quickly, especially near large strikes.
- GEX disagrees with tape: Respect the conflict. If the tape is bullish but the GEX backdrop is strongly pinning, require cleaner price confirmation. If GEX is unstable and tape aligns, a move may have more room.
GEX is structural context, not a trigger. The platform labels it as a full-chain / OI-universe view; treat it as snapshot-backed dealer-gamma context with live spot used for distance, not as a tick-by-tick futures signal.
Step 4: Move to Contract-level analysis
After the broad symbol read, open Rank -> Contracts. This is where TradingFlow turns the market read into specific contracts worth investigating.
![]()
For ES/SPX intraday, focus on:
- Filters: narrow to index/ETF symbols or the expiration window you trade.
- Inspect controls: open the exact contract drawer when a row looks interesting.
- Net DEI / Flow DEX: separate impact size from directional exposure.
- Ask/Bid % and Premium: ask whether the flow is aggressive and large enough to matter.
- Vol/OI and Delta context: avoid mistaking a noisy one-off print for sustained pressure.
A useful contract candidate usually has more than one reason to care: large premium, concentrated size, a meaningful Vol/OI read, and directional pressure that fits the market move. A single large print with unclear side is a note, not a plan.
Step 5: Validate in Option Trades
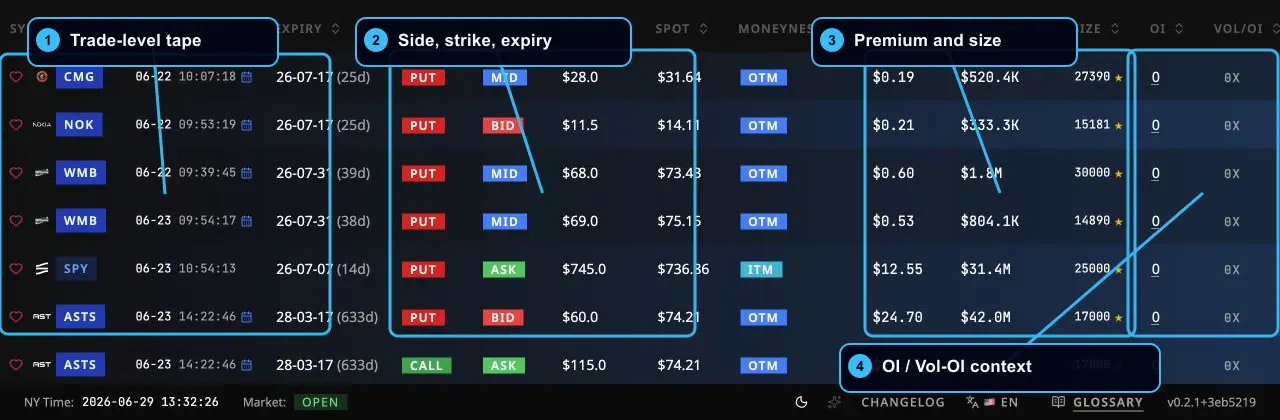
Use Option Trades when you need the tape, not just the ranking.
The screenshot below shows the fields that matter most for intraday validation: symbol/time, side, strike/expiry, premium/size, and OI/Vol-OI context.
For an ES/SPX trade, use Option Trades like this:
- Filter to the symbol family you care about: SPXW/SPX/XSP/SPY.
- Keep the expiry window tight when trading 0DTE or front-week index flow.
- Look for repeated prints, not one isolated row.
- Compare side and sentiment with ES price action.
- Check whether size is meaningful relative to OI and Vol/OI.
If ES is breaking above a morning high and you see repeated SPXW or SPY call activity lifting offers near the same window, that is confirmation context. If ES is breaking higher while the tape shows heavy put buying or negative Flow DEX into the move, treat the breakout as lower quality until price proves otherwise.
A practical intraday loop
Here is the repeatable loop I would use:
| Moment | TradingFlow surface | What to ask |
|---|---|---|
| Pre-market or first look | Rank Symbols | Is the latest session fresh? Which index/ETF names are active? |
| Before a setup | Rank Symbols + SPXW drawer | Is pressure bullish, bearish, or balanced? What does GEX say about pin/flip risk? |
| Level planning | SPXW GEX + Chain | Where are the gamma magnet, zero-gamma flip, 0DTE pressure, and active strikes? |
| Candidate selection | Rank Contracts | Which contracts have real premium, impact, and turnover? |
| Entry validation | Option Trades | Is the tape confirming the direction now? |
| During the trade | Option Trades + Rank refresh | Is flow accelerating, stalling, or flipping against the trade? |
| After exit | Rank Contracts | Did the move leave a durable flow footprint or just a burst? |
What not to do
- Do not treat TradingFlow as a mechanical buy/sell indicator.
- Do not use SPY, SPXW, and ES as interchangeable products. They are related, but the contracts settle and trade differently.
- Do not treat GEX as a standalone entry signal. Use it to judge pinning, acceleration, and regime risk around your ES/SPX levels.
- Do not treat open interest as tick-by-tick live positioning. Some structural context is the latest available snapshot, not a live feed.
- Do not assume a high DEI number is bullish or bearish by itself. Use direction from Net DEX, sentiment, and call/put split.
- Do not chase one print without price confirmation on your ES/SPX chart.
The short version
Use Rank Symbols to understand the market and index-pressure backdrop. Use the SPXW drawer to inspect GEX, chain, positioning, and volatility context. Use Rank Contracts to find specific options contracts with meaningful activity. Use Option Trades to validate whether the live tape is actually confirming your ES/SPX setup.
TradingFlow should make your intraday process slower in the right places: fewer impulse trades, more evidence checks, and cleaner separation between price action, options-flow context, and execution.
External instrument references
Related Articles
GEX Screener: Live Gamma Exposure, Call Walls & Put Walls
Use TradingFlow's GEX screener inside Rank Symbols to inspect gamma exposure, call walls, put walls, volatility, OI positioning and option-chain context in real time.
Option Chain Analysis inside Rank Symbols
Option Chain Analysis is now a feature set inside Rank Symbols (`/app/rank/symbols`): GEX, volatility, OI positioning, and chain tabs live in the symbol inspection drawer alongside flow-ranked discovery.
Option Trades: Real-Time Option Flow, Unusual Activity & Block Trades
Watch live option flow in TradingFlow: real-time tape, sentiment, DEX, filters for unusual trades, blocks, and premium flow.