
Before Anyone's Talking About It: How I Read OI Accumulation on TradingFlow
Every morning before I look at anything else, I open TradingFlow's Pre-Move Positioning screen. Here's a real session — three PCG call strikes building open interest at once — and exactly how far that pattern gets you, and where it stops.
Before I look at what's moving, before I check the tape, I have one habit: I open Cookbooks' Pre-Move Positioning — OI Accumulation screen and see which names built open interest quietly, over several sessions, before anyone was writing headlines about them. Not because it tells me what's about to happen — it doesn't, and I'll get to exactly why not — but because it's the closest thing I've found to watching a position get built in slow motion instead of finding out about it after the fact.
Here's a real run, from this week, walked exactly the way I'd read it myself.
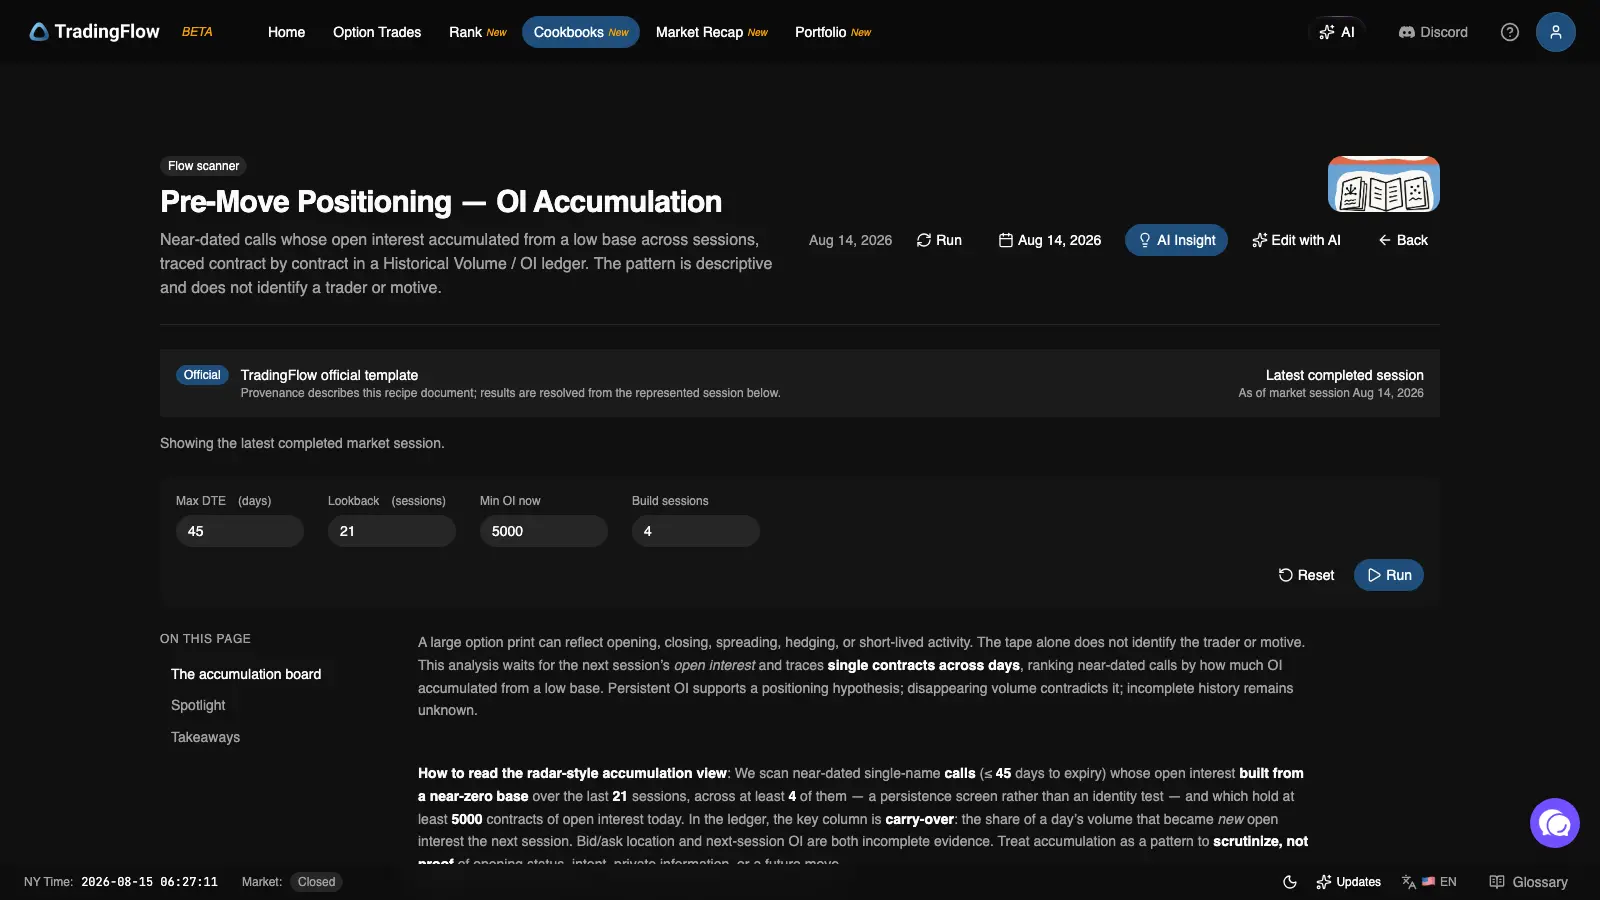
The screen's own framing, and it's worth reading before anything else: "A large option print can reflect opening, closing, spreading, hedging, or short-lived activity. The tape alone does not identify the trader or motive." I hold onto that sentence every time a board looks exciting.
What the screen is actually doing
It's scanning near-dated single-name calls — 45 days to expiry or less — and ranking them by how much open interest built from a near-zero base over the trailing 21 sessions, requiring that build to show up across at least 4 separate sessions. That last part matters more than it sounds: one big print on one day is a story about that day. OI that keeps growing across four-plus separate sessions is a pattern, not an event. The screen calls this a "persistence screen, not an identity test" — it's honest that persistence tells you something happened repeatedly, not who did it or why.
What I found this morning
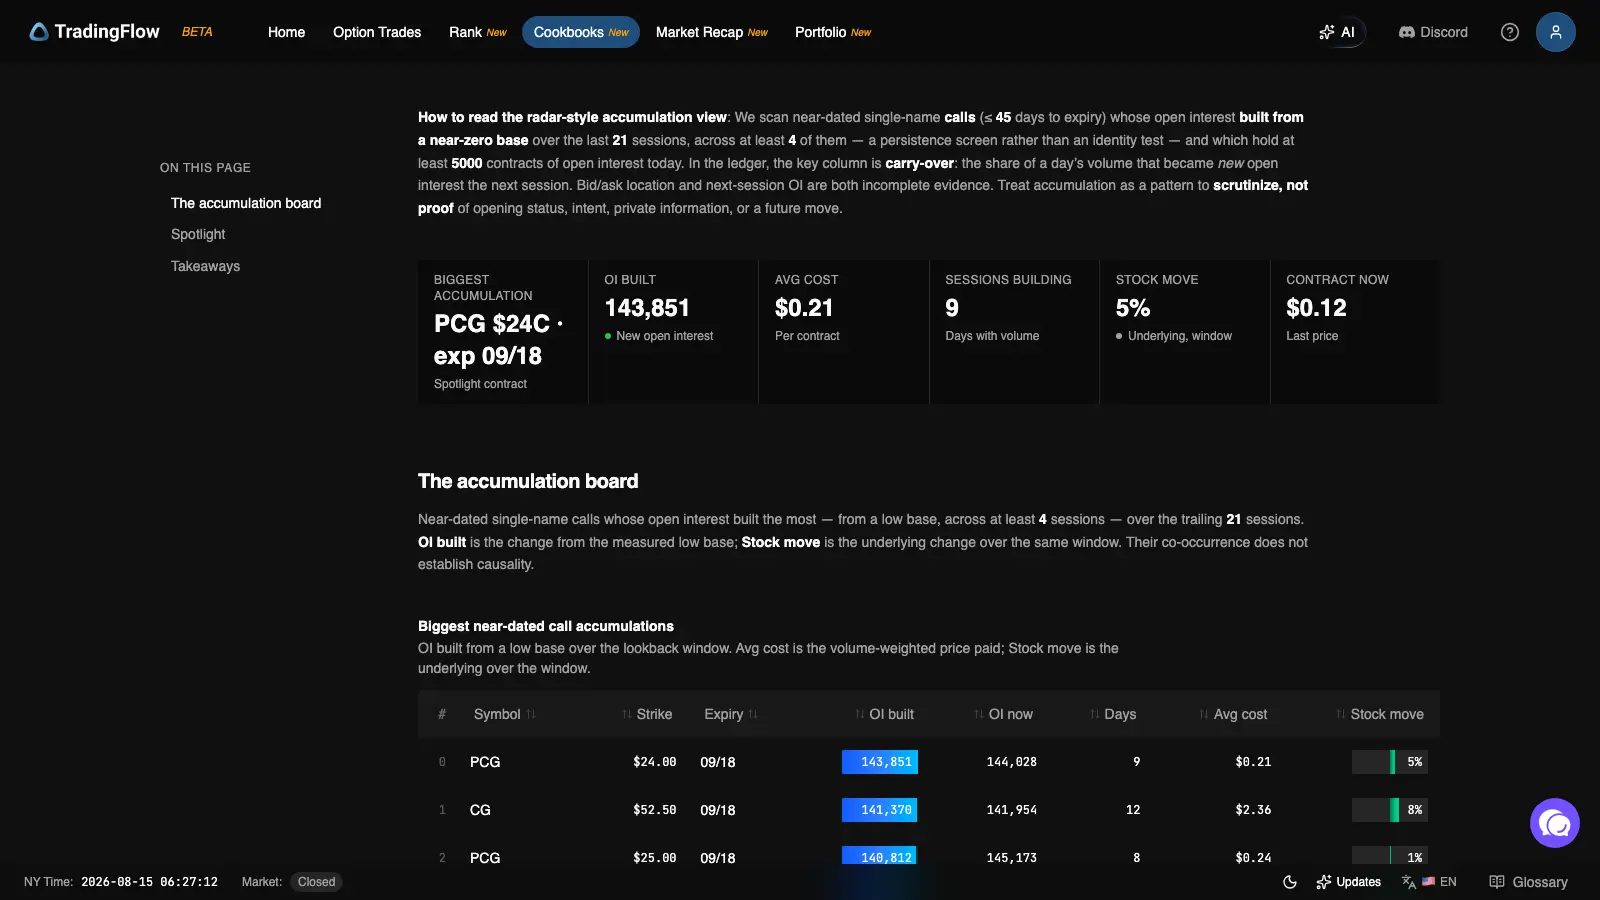
The board, ranked by OI built. I've learned to scan the Symbol column before the numbers — it's how you catch a name showing up more than once.
The top of the board, for the session that had just closed:
| Symbol | Strike | Expiry | OI built | Days | Avg cost | Stock move |
|---|---|---|---|---|---|---|
| PCG | $24.00 | 09/18 | 143,851 | 9 | $0.21 | 5% |
| CG | $52.50 | 09/18 | 141,370 | 12 | $2.36 | 8% |
| PCG | $25.00 | 09/18 | 140,812 | 8 | $0.24 | 1% |
The first thing I actually noticed wasn't the top row — it was that PCG shows up twice in the top three, and a third time (the $22 strike) further down the same board. Three different near-dated call strikes on the same underlying, all building open interest from a low base, over the same stretch of sessions. That's the kind of thing a single headline print can't show you. One big trade on one strike is a trade. Three strikes climbing together over more than a week is a pattern I want to look at closer.
Zooming into the one the board flagged hardest
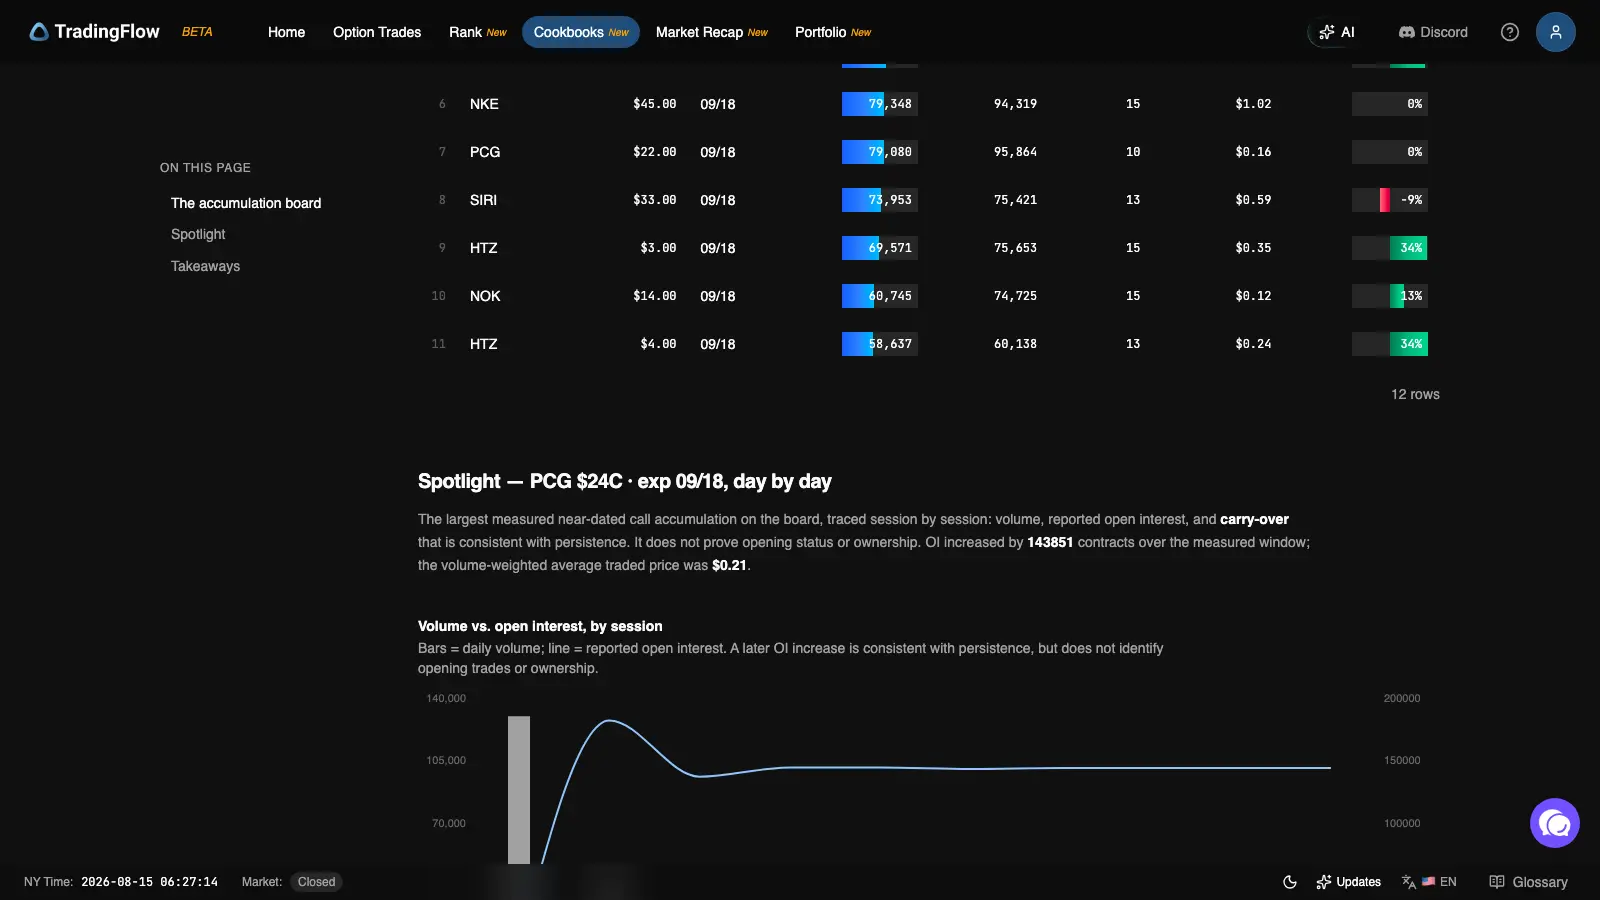
The Spotlight chart: bars are daily volume, the line is reported open interest. You can see the climb, then the flattening — that second part is the detail I'd have missed a year ago.
The $24 call, expiring 09/18, is the biggest accumulation on the board: open interest built by 143,851 contracts, at a volume-weighted average price of $0.21, over 9 sessions with real volume.
Here's the part I actually pay attention to, and it's not the big number. I pulled the day-by-day ledger underneath the chart, and the open interest column does something specific: it climbs hard in the first two sessions, gives a little of it back, then settles into a run where almost nothing changes — 144,017, then 144,017 again, then 144,025, then 144,028. For the last handful of sessions in this window, nothing new was building. The position, whatever it is, stopped growing about a week before the session I'm looking at. That's not a small detail — a board ranked by "OI built over 21 sessions" doesn't tell you when in that window the building actually happened, and "still actively accumulating right now" and "finished accumulating a week ago and just sitting there" are two very different situations that look identical in a single ranked number.
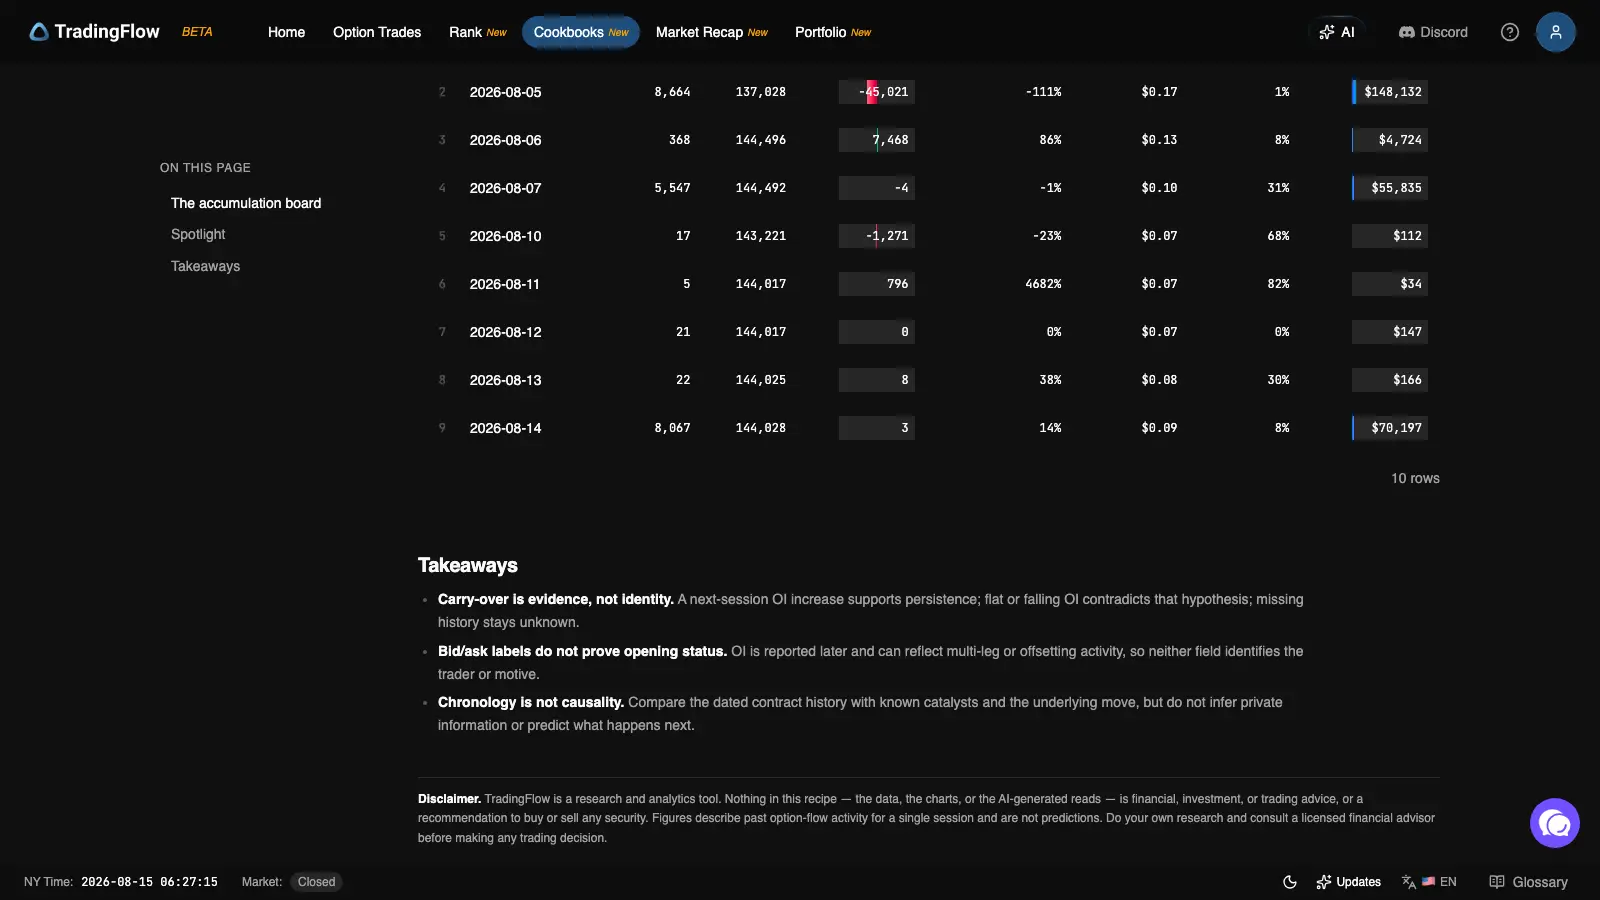
The ledger itself, not a summary of it. Read the OI column alone, top to bottom, and the flattening isn't an interpretation — it's just what the numbers do.
The number that keeps me honest
This is the one I'd want a newer trader to see before anything else: that $24 call's average build price was $0.21. Right now, it's trading at $0.12.
Whoever built this position — if it's one position at all, which the data can't tell me — is sitting on a contract worth roughly 40% less than what they paid for it, while the stock itself has only moved 5% over the same window. Open interest accumulating is not the same thing as a trade working. I've seen boards like this get treated as a green light. What it actually is, honestly, is a record that something got built — not a scoreboard for whether it was a good idea.
What this pattern can tell me, and what it flatly can't
The report's own takeaways are worth repeating in plain language, because they're the discipline that makes this screen useful instead of dangerous:
- A rising open-interest number the next session supports the idea that a position is persisting. A flat or falling one contradicts it. Missing history is just unknown — not a "no."
- Neither the print's side nor the next day's OI proves who opened it, or why. OI is reported with a lag, and it can reflect multi-leg structures or offsetting trades just as easily as a single directional bet.
- The timeline is not a cause. Even when a stock does move during or after a build like this, lining up the dates doesn't establish that the options activity caused it, predicted it, or had anything to do with it. HTZ's two accumulating strikes on this same board both sat next to a 34% stock move in the window — and I still can't tell you from this screen alone whether the options came first, the move came first, or the two are unrelated.
How I actually use it
I don't trade off this board. I use it as a shortlist:
- Scan the board for names that show up more than once, or that build across an unusually high share of the window's sessions.
- Open the Spotlight ledger and check when the building actually happened — early and now flat, or still climbing into the latest session.
- Cross-check the name in Option Trades for the actual prints behind the number — side, size, whether it reads as aggressive.
- Come back the next session and see whether open interest kept climbing or stalled. One session's flat OI doesn't kill a thesis; several in a row usually does.
That last step is the one I skip least often now, and it's the one most people skip entirely.
Open it
Open Pre-Move Positioning in TradingFlow
For the concepts behind this screen:
- Cookbooks & Market Recap tutorial — how official recipes like this one work
- Option Chain & Open Interest explained — what OI is and how it updates
- Options & Flow Concepts — side, sentiment, and reading a print honestly
This is a research tool, not a signal generator. Nothing here identifies a trader, proves intent, or predicts what a stock does next — do your own research, and treat accumulation as a pattern worth watching more closely, never as a conclusion.
Related Articles
Not Every Rally Has Flow Behind It: How I Read Top Gainers — Flow Confirmation on TradingFlow
TradingFlow scored 63 single-name gainers on Aug 14 — 50 confirming, 13 neutral, zero diverging. The single biggest mover of the day wasn't one of the confirming names. Here's a real session and what that gap actually means.
$3.2 Billion in One Name Wasn't a Bullish Bet: How I Read Daily Option Flow on TradingFlow
TradingFlow's Daily Option Flow scanner showed $20B in single-name option premium on Aug 14 — and 16% of it landed in one name, SNDK. The size looked bullish. The biggest individual tickets said something messier. Here's how I actually read a session's tape.
Unusual Options Activity Is Not a Signal Until the Tape Checks Out
UOA alerts are noise without filters, print-level tape, and open-interest context. TradingFlow’s Option Trades and Rank surfaces make that audit possible.