
$3.2 Billion in One Name Wasn't a Bullish Bet: How I Read Daily Option Flow on TradingFlow
TradingFlow's Daily Option Flow scanner showed $20B in single-name option premium on Aug 14 — and 16% of it landed in one name, SNDK. The size looked bullish. The biggest individual tickets said something messier. Here's how I actually read a session's tape.
Most people read a session's option flow as a headline: "call buying was heavy today," "puts led the tape." That's the narrative, and it's built from an average — every dollar of premium blended into one call/put split. I've started reading the tape itself instead, the actual list of prints underneath that average, because the average and the biggest individual trades inside it don't always tell the same story. Today they didn't.
Cookbooks has an official recipe built for exactly this — Daily Option Flow — The Tape. Here's a real session, read the way I'd read it myself.
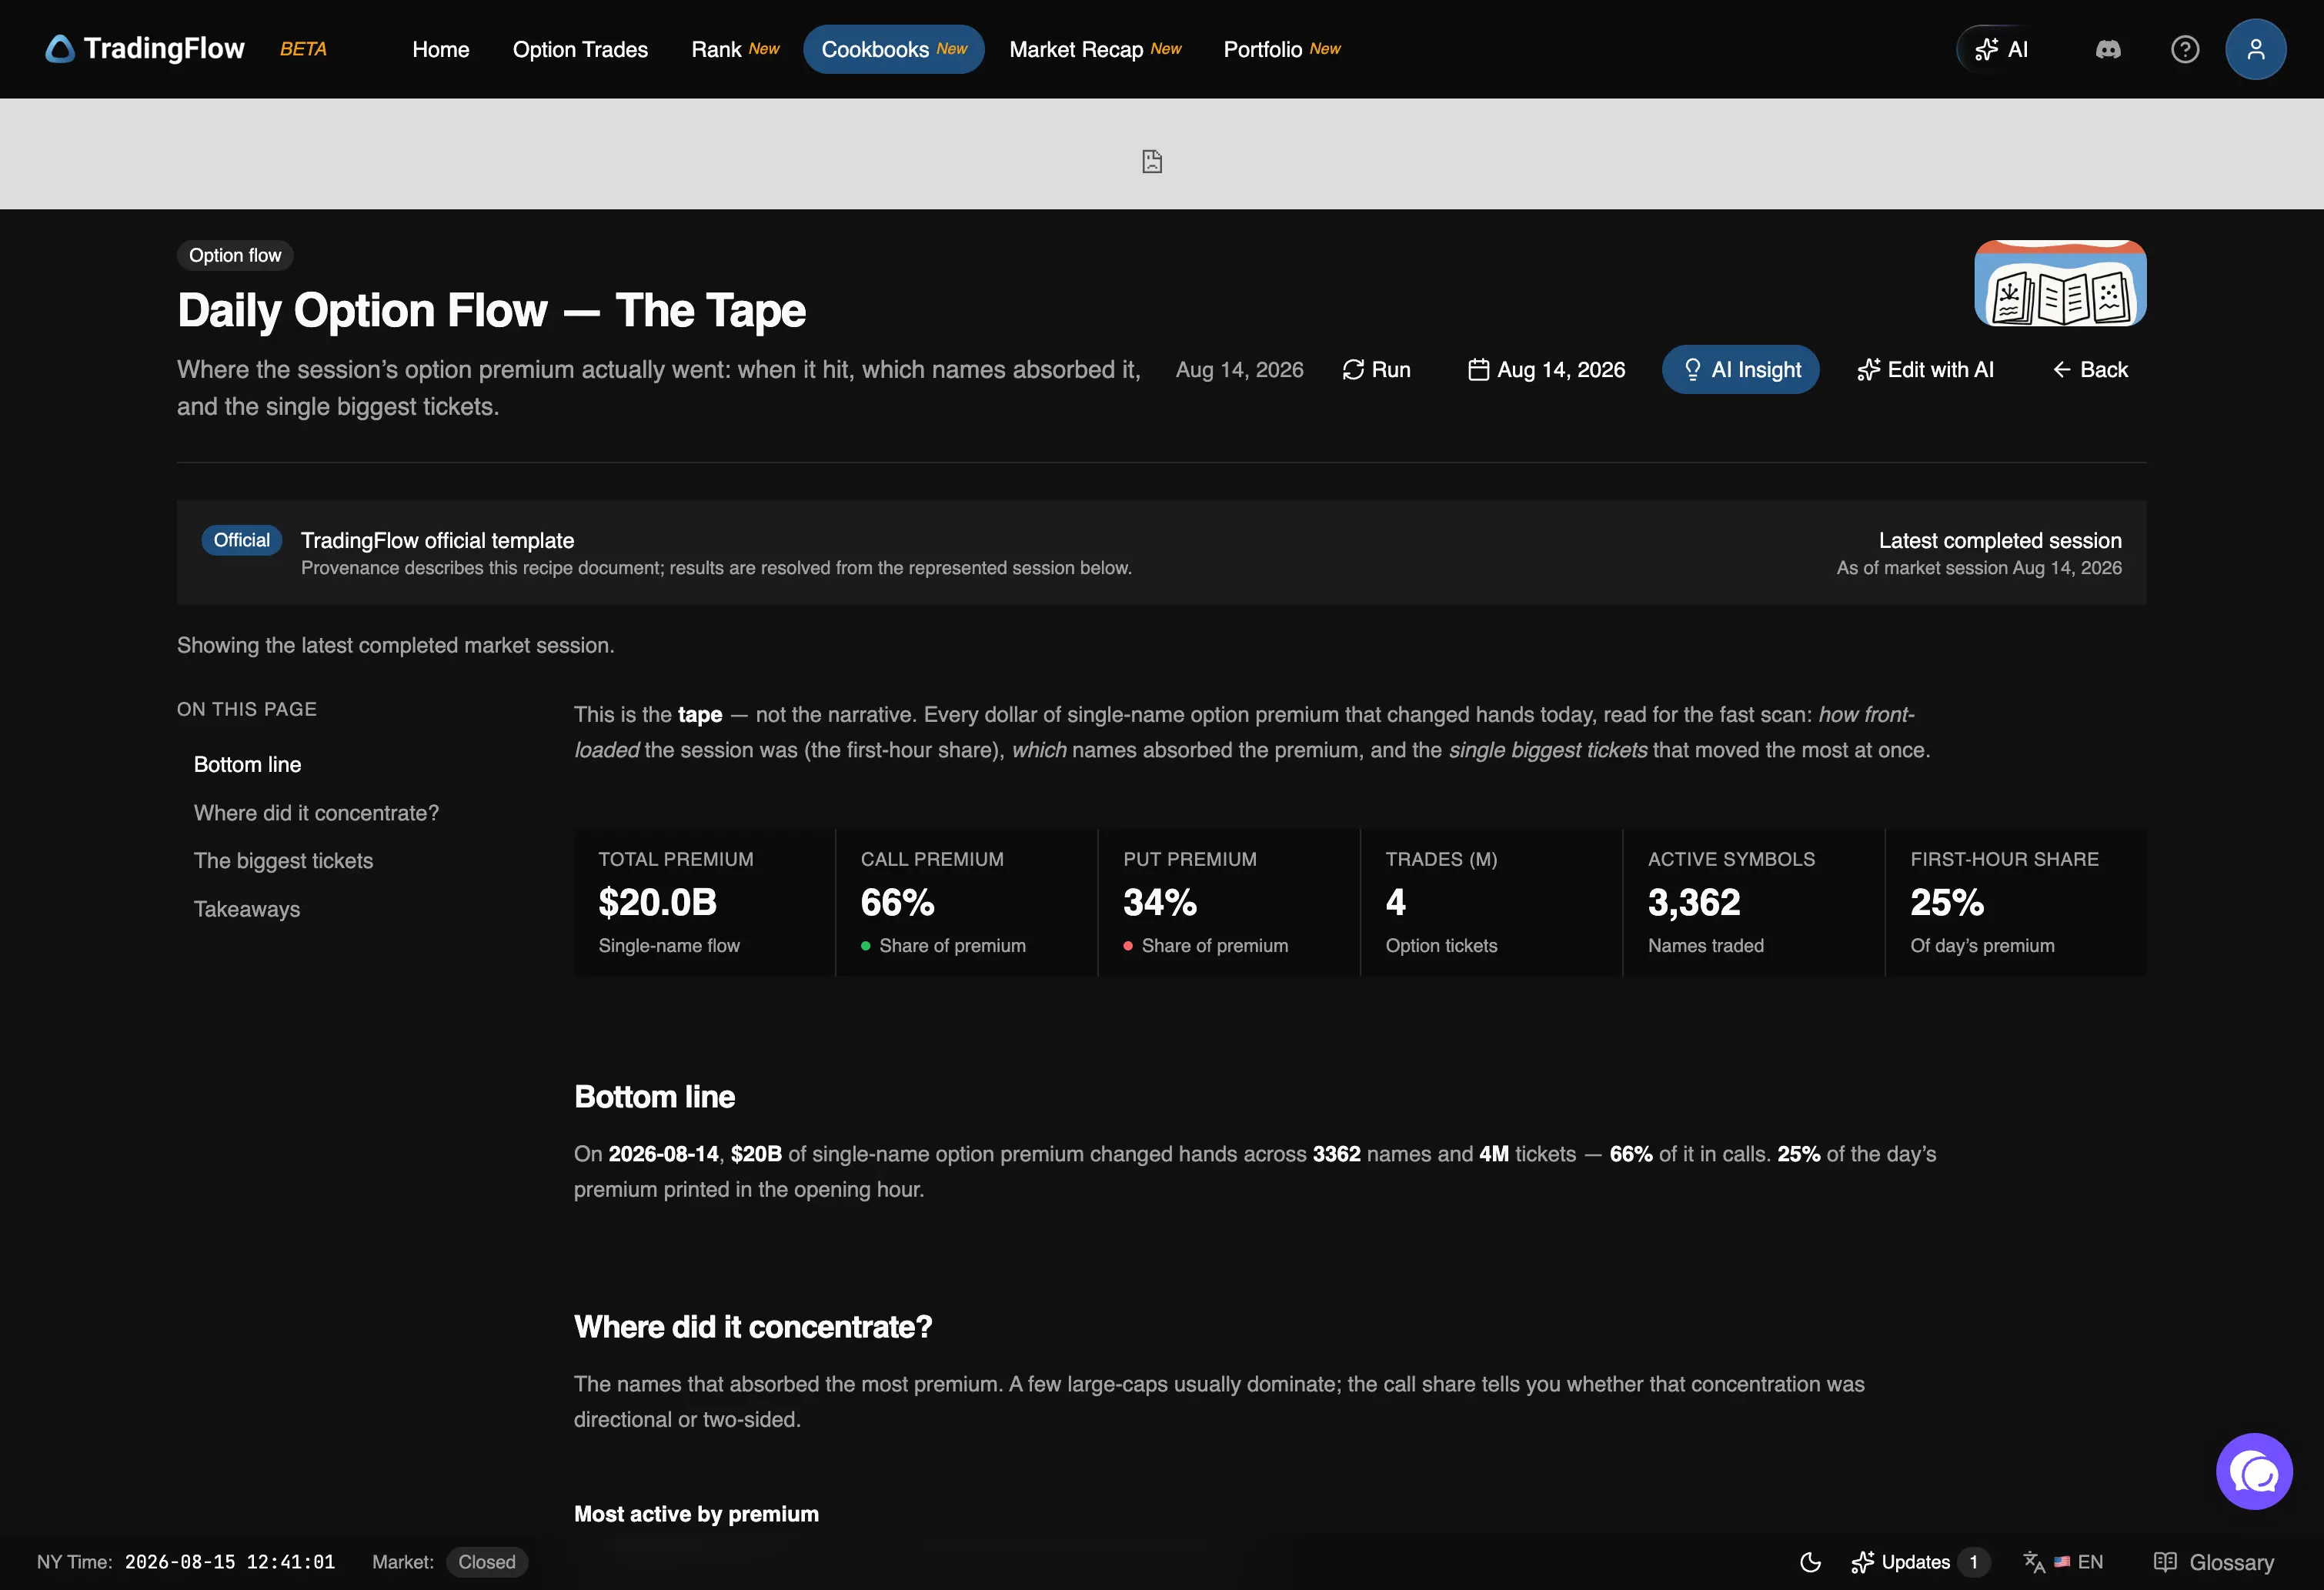
The screen's own framing: "This is the tape — not the narrative." That distinction is the whole reason I open this page before I read anyone's take on the day.
What the screen is actually doing
It totals every dollar of single-name option premium that changed hands in a session, then breaks that total down three ways: when it printed (the first-hour share tells you how front-loaded the session was), which names absorbed it, and the single biggest tickets — the individual prints that moved the most size at once, independent of which name they belonged to.
The session, in numbers
For Aug 14, 2026:
- $20.0B in single-name option premium
- 66% calls / 34% puts
- 4M option tickets across 3,362 active names
- 25% of the day's premium printed in the opening hour
That's the crowd-average picture — a moderately call-heavy, moderately front-loaded session. It's also almost useless on its own, because it can't tell you whether that 66% call share was 3,362 names all leaning slightly bullish, or one name skewing the whole number.
Where it concentrated
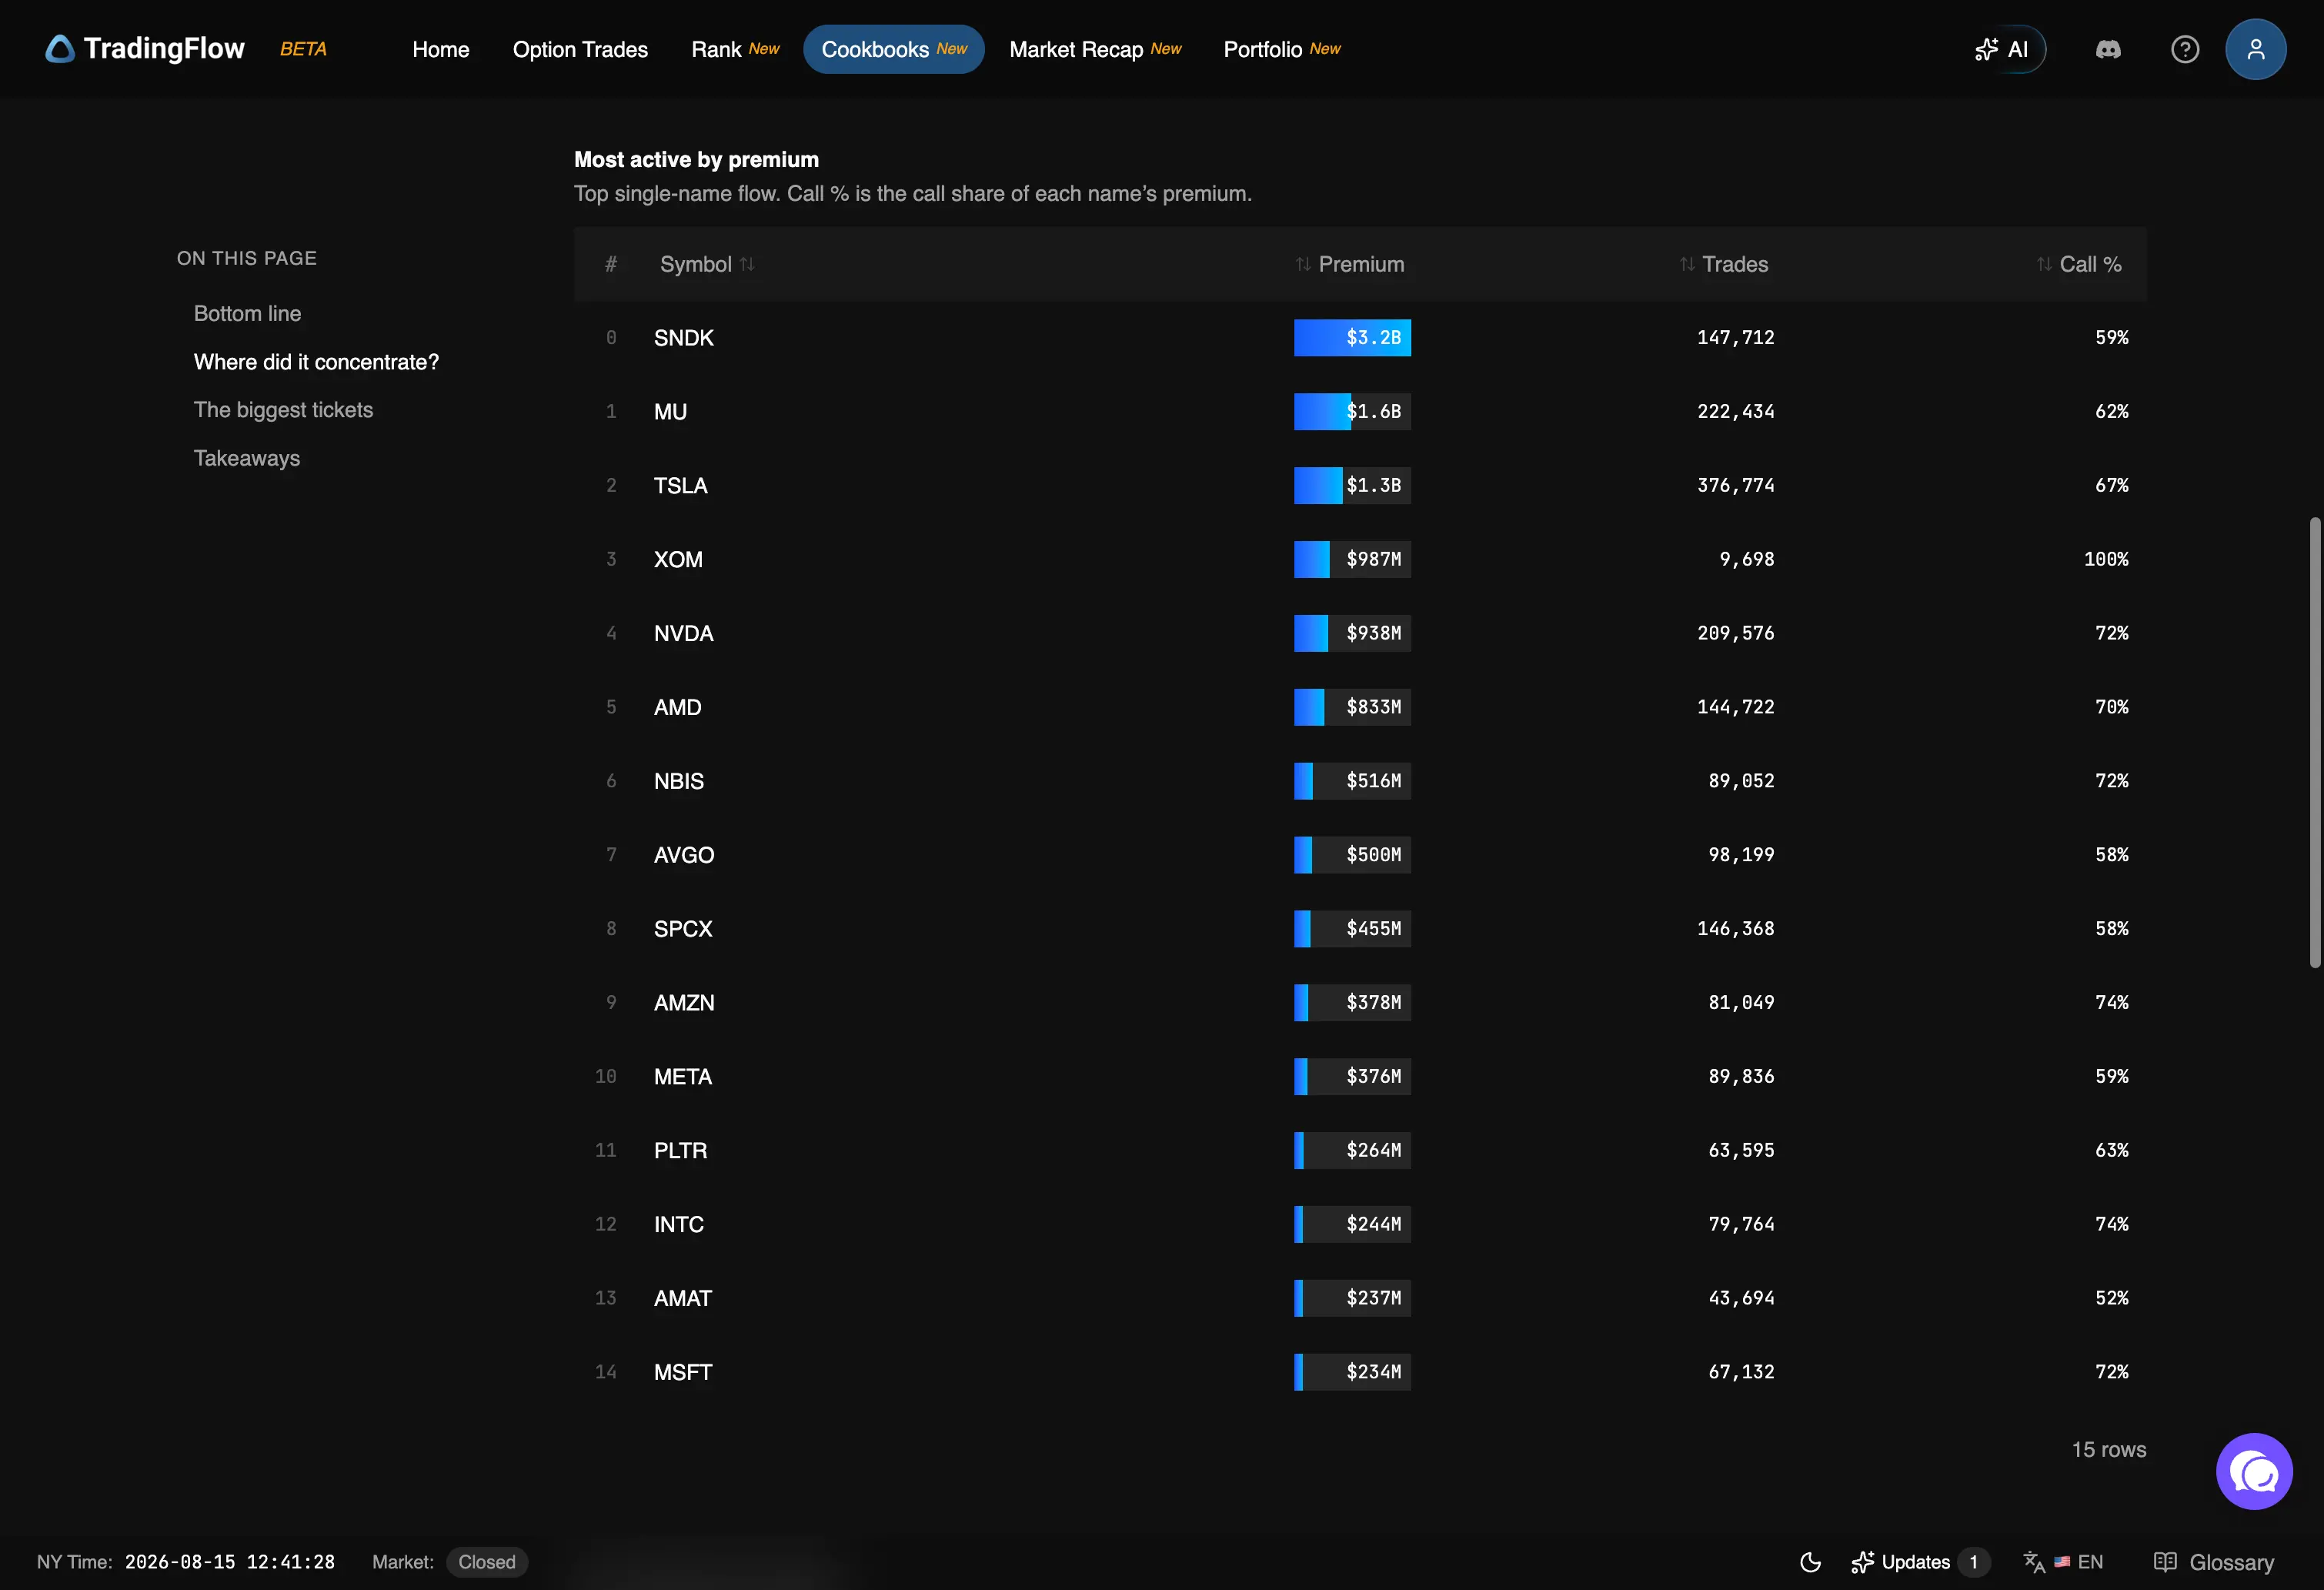
Most active by premium, sorted. SNDK's bar isn't a little bigger than MU's — it's roughly double it, and more than triple TSLA's.
SNDK absorbed $3.2B of the day's $20.0B — about 16% of every dollar of single-name option premium that traded, in one name. The next-largest, MU, took $1.6B. TSLA was third at $1.3B.
One line further down the board is a cleaner story worth noting on its own: XOM carried $987M in premium — the fourth-largest name — on just 9,698 trades and 100% calls. Every other name near it in size traded in the tens or hundreds of thousands of tickets. XOM's combination of huge premium, very few trades, and a clean all-call skew is what a genuinely one-sided, concentrated position actually looks like on this board. Keep that shape in mind — SNDK's doesn't match it.
The tickets that actually built that number
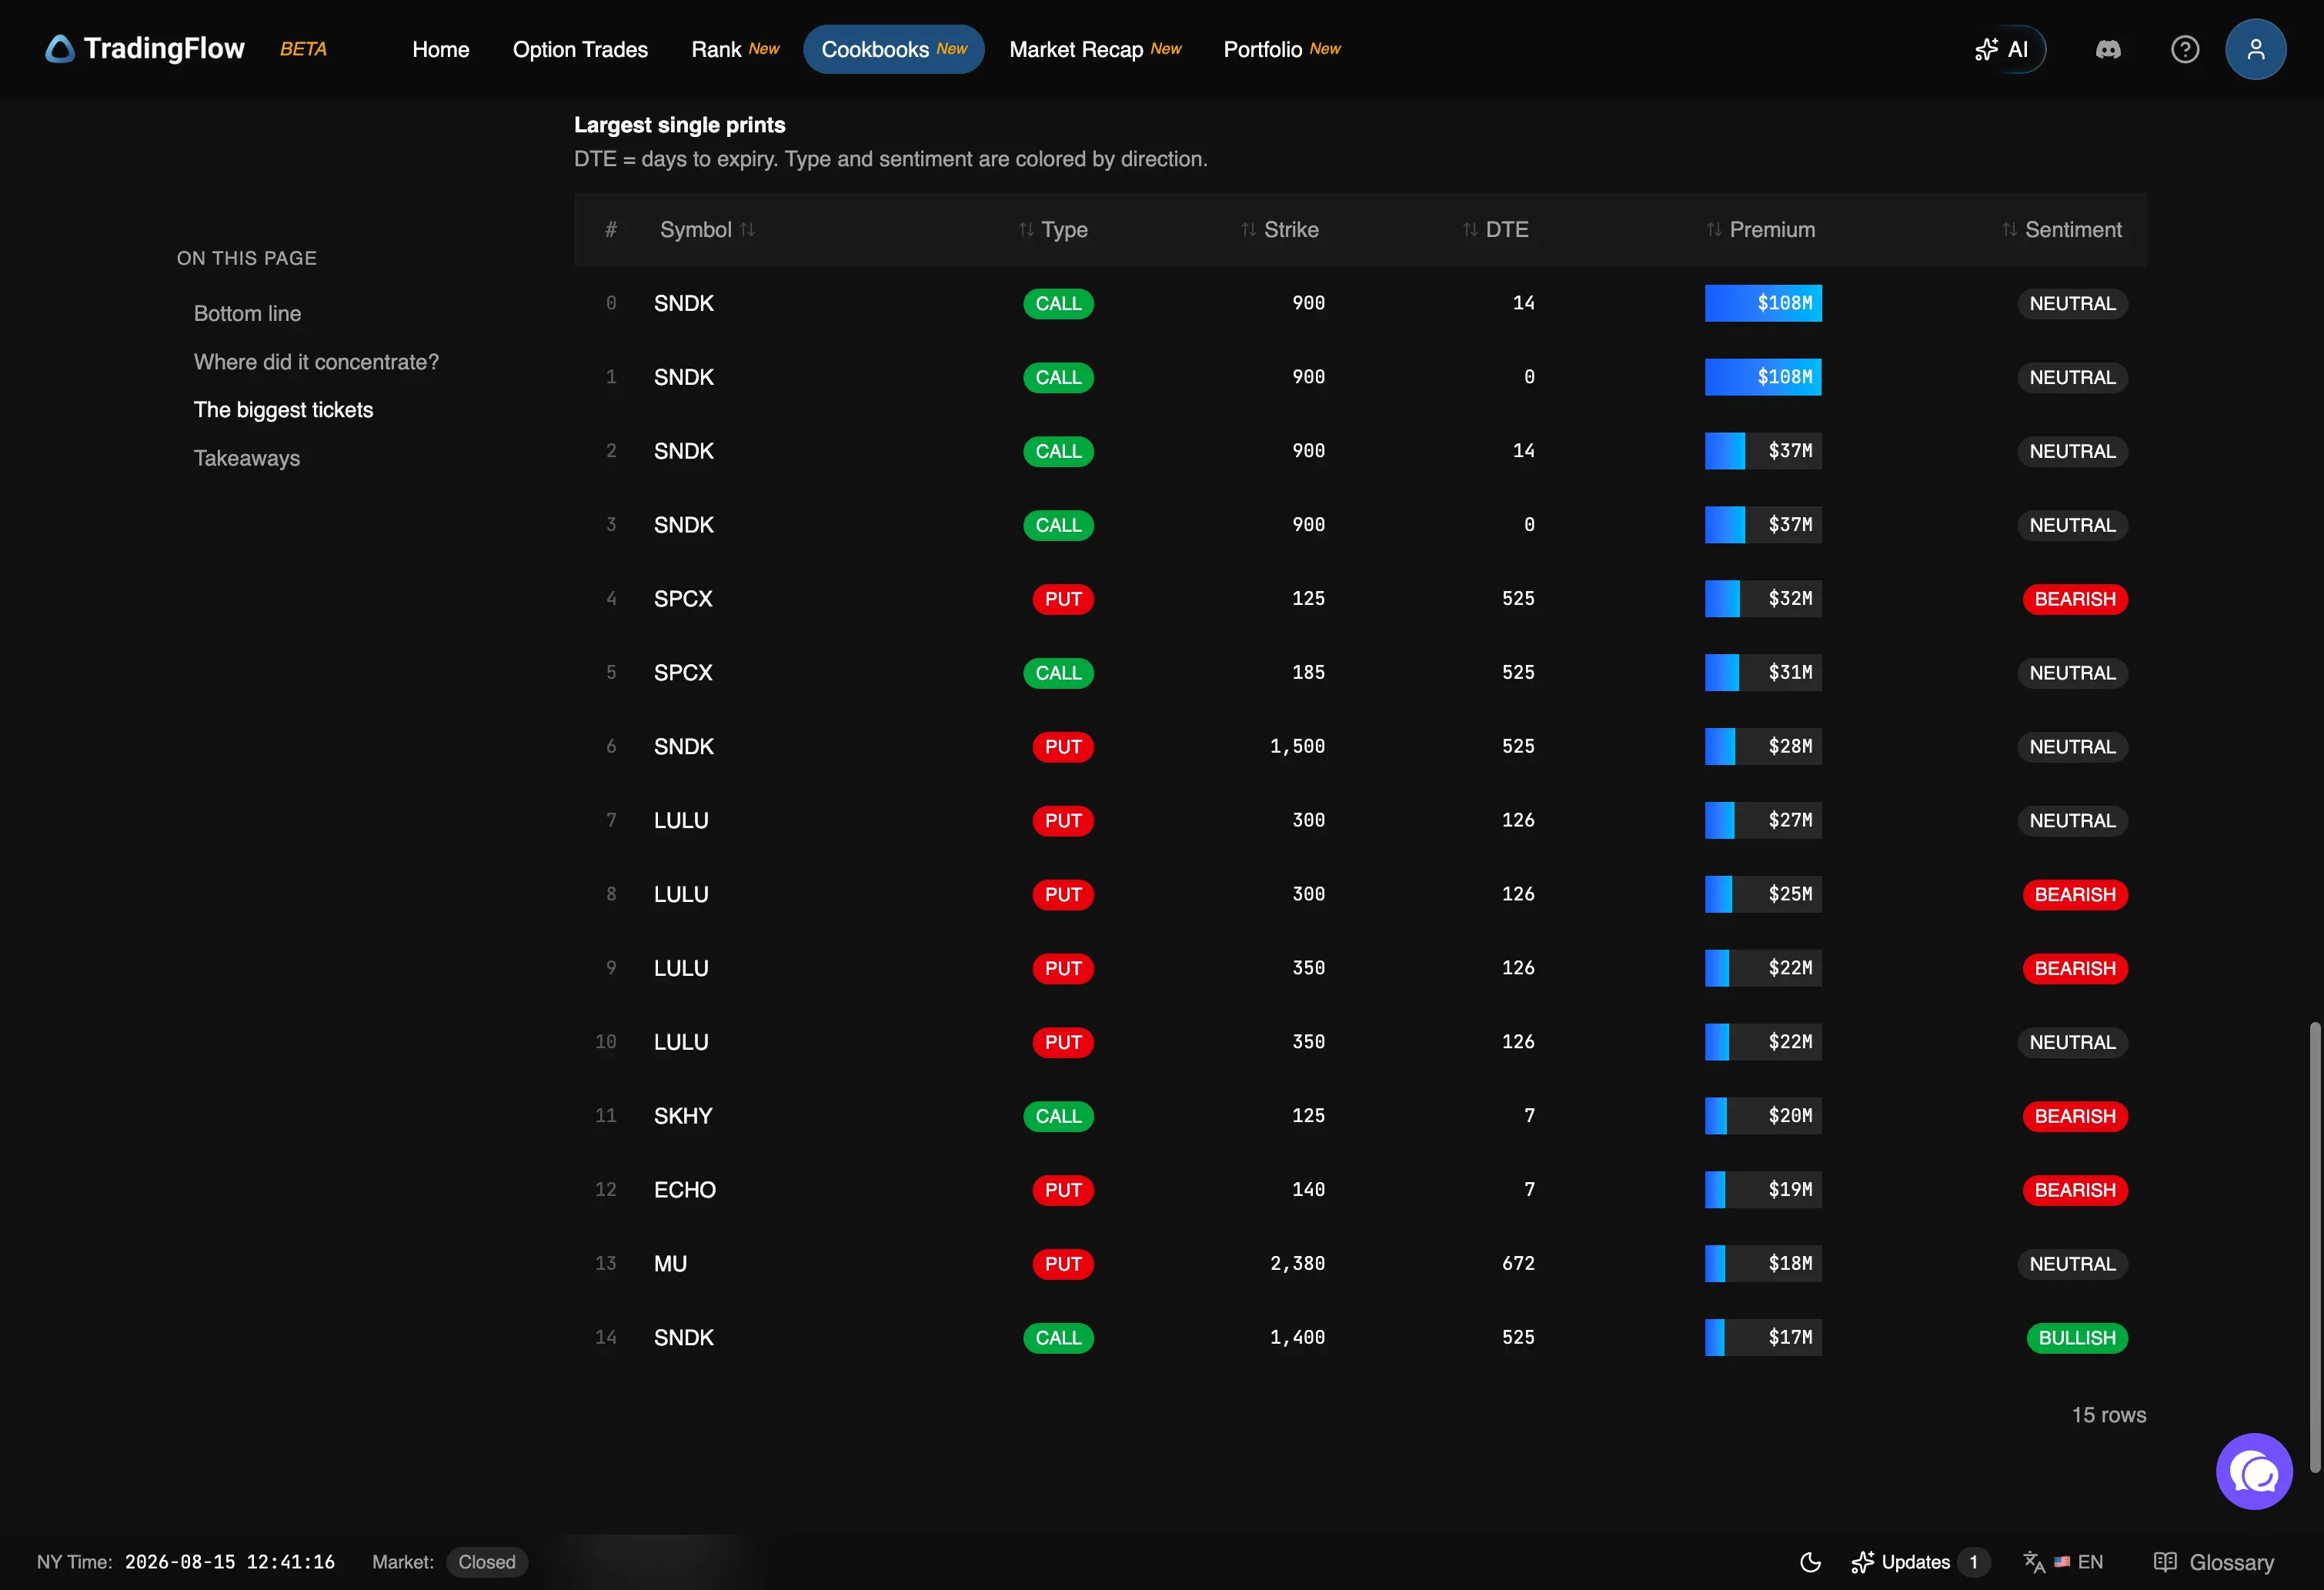
The individual prints behind the dollar totals. Scan the Symbol column first — SNDK shows up six times in the top fifteen, and only one of those six is tagged Bullish.
SNDK's aggregate call share was 59% — solidly call-heavy, in line with the day's overall tilt. But six of the session's fifteen largest individual prints were SNDK, and here's what they actually were:
| Type | Strike | DTE | Premium | Sentiment |
|---|---|---|---|---|
| CALL | 900 | 14 | $108M | Neutral |
| CALL | 900 | 0 | $108M | Neutral |
| CALL | 900 | 14 | $37M | Neutral |
| CALL | 900 | 0 | $37M | Neutral |
| PUT | 1,500 | 525 | $28M | Neutral |
| CALL | 1,400 | 525 | $17M | Bullish |
Five of six are tagged Neutral. The one clean Bullish read is also the smallest ticket on the list. The four largest — two pairs at the same $900 strike, one pair expiring in 14 days and the other same-day — don't fit either half of the report's own read on block trades cleanly: they're not long-dated the way institutional structure usually is, and they're not tagged directional the way a tactical bet usually is. I'm not going to force them into a label the data doesn't support. What I can say honestly: a name posting a 59% call skew on the surface, while its six largest individual prints are five-sixths Neutral across two different option types and two very different expiries, is not the same picture as "the market bought SNDK calls today." Something large and structured happened in this name. A simple bullish headline undersells how little the size itself actually confirms.
For contrast, SPCX shows what a legible two-legged structure looks like on this same board: a $32M put at the 125 strike and a $31M call at the 185 strike, both 525 days to expiry, both near-identical in size. Same name, same expiry, opposite type, matched size — that's the shape of a position, not a coincidence. It's a much easier read than SNDK's.
LULU is the other name worth a glance: four of the largest fifteen tickets, all puts, all 126 DTE, split between Neutral and Bearish. A concentrated block story in its own right, just smaller and one-sided in a different direction than SNDK's.
What the report's own takeaways say, in plain language
- The headline call/put split is a crowd average. The biggest tickets show what large size actually did, and they often disagree with the average — SNDK is this session's proof.
- When premium printed matters. A front-loaded session reflects overnight reaction; a back-loaded one reflects intraday positioning. They're different stories even at the same total dollar figure.
- Concentration in a few names means the tape's "bias" is really a handful of stories, not a market-wide one. One session is a snapshot, not a trend.
How I actually use it
- Check the top-line call/put split, then immediately discount it. It's a starting number, not a conclusion — treat it the way you'd treat a single day's average temperature.
- Look at which names dominate the premium total, and check whether the trade count and call share around them make sense together. XOM's shape (huge premium, few trades, clean skew) is legible. A name with huge premium and a much messier ticket-level picture, like SNDK, is the one worth digging into.
- Read the biggest-tickets table for repeats. A name showing up multiple times in the largest individual prints, especially across different option types or expiries, is telling you more than its aggregate call percentage ever will.
- Cross-check anything that looks structured in Option Trades before assuming you understand what it was.
Open it
Open Daily Option Flow — The Tape in TradingFlow
For the concepts behind this screen:
- Cookbooks & Market Recap tutorial — how official recipes like this one work
- Options & Flow Concepts — side, sentiment, and reading a print honestly
- Top Gainers — Flow Confirmation — the same size-vs-signal question, asked of price moves instead of the whole tape
This is a research tool, not a signal generator. A large print, or a name dominating a session's premium, does not identify a trader, prove intent, or predict what happens next. Do your own research, and treat the gap between a headline average and the tickets underneath it as a reason to look closer, never as an answer on its own.
Related Articles
Unusual Options Activity Is Not a Signal Until the Tape Checks Out
UOA alerts are noise without filters, print-level tape, and open-interest context. TradingFlow’s Option Trades and Rank surfaces make that audit possible.
Not Every Rally Has Flow Behind It: How I Read Top Gainers — Flow Confirmation on TradingFlow
TradingFlow scored 63 single-name gainers on Aug 14 — 50 confirming, 13 neutral, zero diverging. The single biggest mover of the day wasn't one of the confirming names. Here's a real session and what that gap actually means.
Before Anyone's Talking About It: How I Read OI Accumulation on TradingFlow
Every morning before I look at anything else, I open TradingFlow's Pre-Move Positioning screen. Here's a real session — three PCG call strikes building open interest at once — and exactly how far that pattern gets you, and where it stops.