Official template · basic · Volatility
Compare implied volatility with its own history.
Answer "whose implied vol is rich right now" without already knowing which symbol to check.
The report UI is recreated from the test app's Sep 25, 2026 session, not a live screen. A historical example with music; no narration.
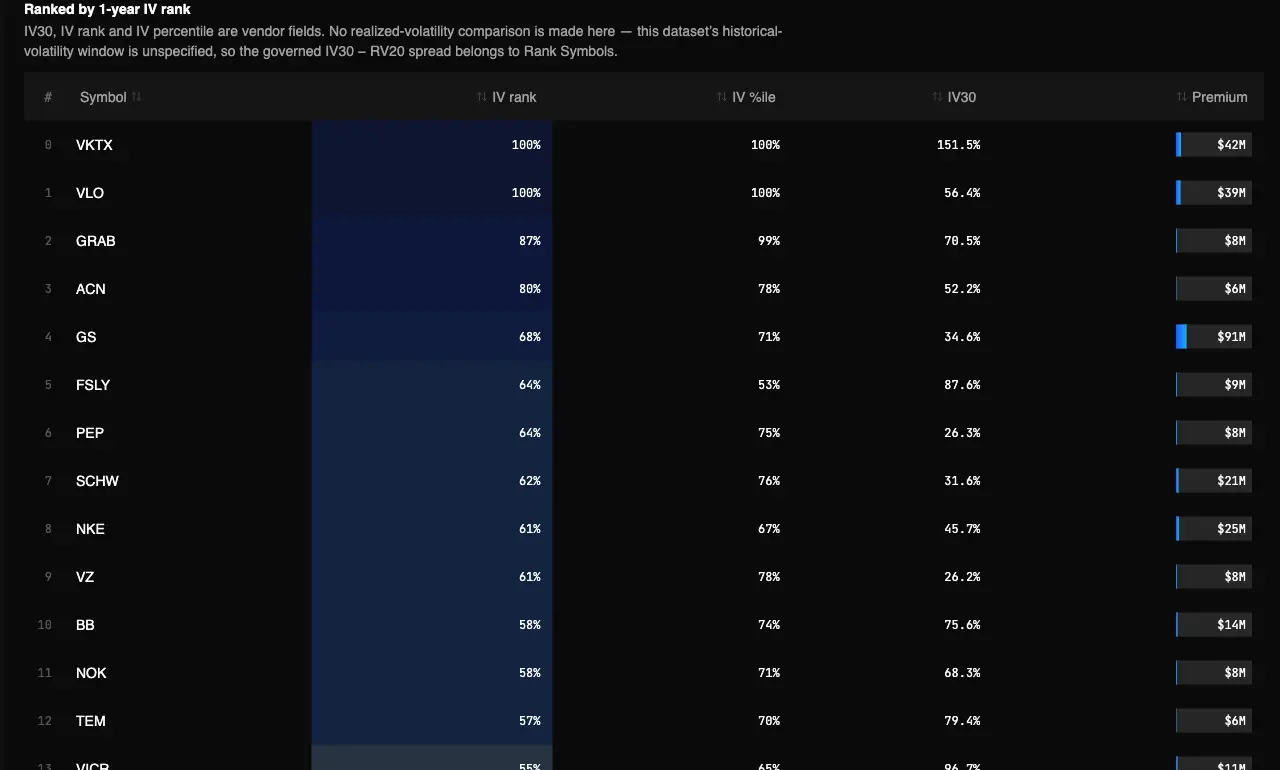
Captured Sep 23, 2026 on testapp.tradingflow.com. This is a historical example; results on this page do not refresh. Swipe across the image to inspect its columns.
- 01Active symbols
- 02Compare 1-year IV range
- 03IV rank board
IV rank is relative to each symbol’s own history.
Read the output
- 01IV rank and IV percentile against each name’s own trailing year.
- 0230-day implied volatility alongside the rank.
- 03Today’s option premium, so the board ranks names someone actually traded.
Keep in mind
Rich is relative to the name’s own history, not to other names.
How to read it
From report to evidence01
Pick a direction
Richest surfaces elevated vol; cheapest surfaces names trading near the bottom of their own range.
02
Read rank and IV30 together
The same 30% IV can be rich for a quiet ETF and cheap for a name that moves 5% a day.
03
Open the symbol’s surface
Vol Surface shows whether the level sits in the term structure or the smile.
Method and limitations
A one-screen Cookbook tool: names trading real option premium today, ranked by 1-year IV rank in either direction. Official app template: IV Rank Leaderboard.
What the report computes
- IV rank and IV percentile against each name’s own trailing year.
- 30-day implied volatility alongside the rank.
- Today’s option premium, so the board ranks names someone actually traded.
What it does not claim
- Rich is relative to the name’s own history, not to other names.
- No realized-volatility comparison is made — this dataset’s historical-volatility window is unspecified.
- A high rank is not a reason to sell, and a low one is not a reason to buy.
Ranks only names trading real option premium today, so the board stays tradeable instead of filling with stale vendor readings.
Frequently asked questions
- What is the difference between IV rank and IV percentile?
- Rank places current IV between the year’s low and high. Percentile counts how many days sat below it. A name can rank high while spending most of the year higher still.
- Why is a liquidity floor applied?
- Without one the board fills with names carrying a stale vol reading and no real option trading, which is not a tradeable list.
Related recipes
More learning resources
The public page explains the report. Run the official template in TradingFlow for a selected completed market session.
Open IV rank board