Official template · basic · Volatility
See the move priced into each expiry.
Answer "how far is this name priced to move by Friday" without building a vol surface first.
The report UI is recreated from the test app's Sep 25, 2026 session, not a live screen. A historical example with music; no narration.
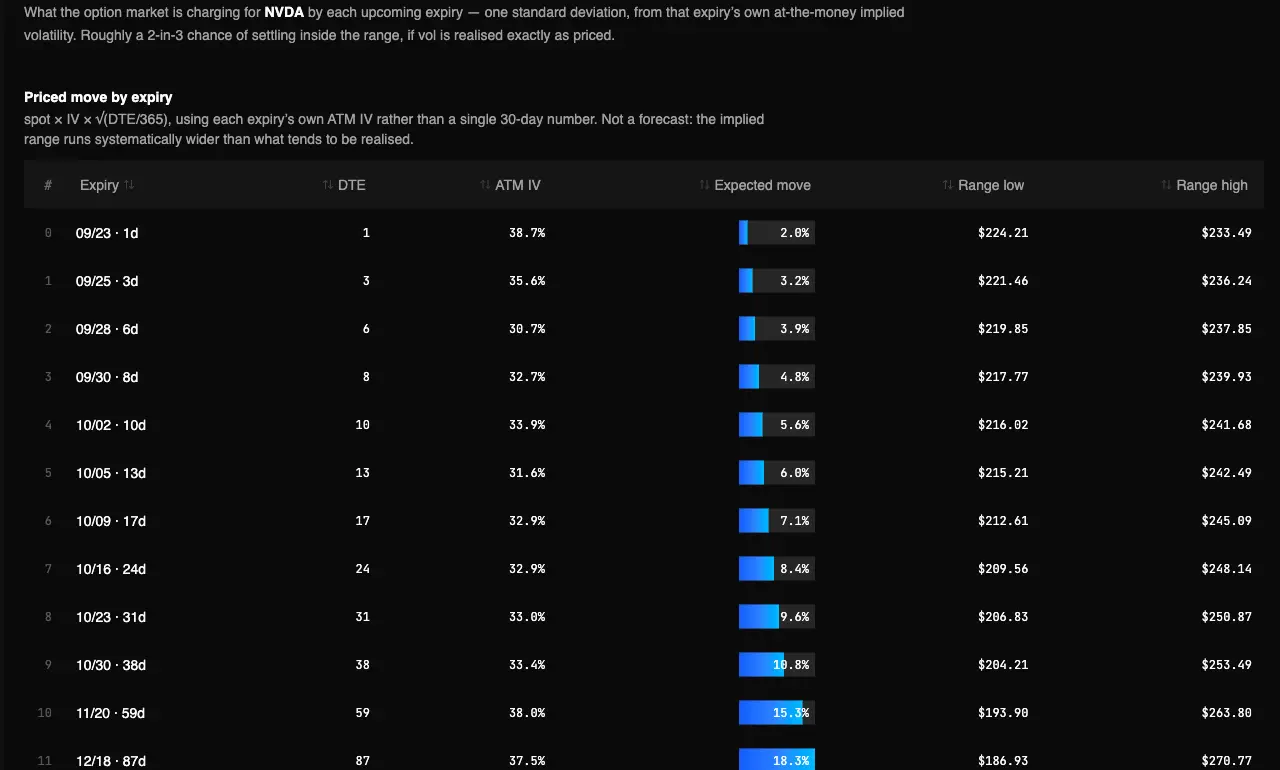
Captured Sep 23, 2026 on testapp.tradingflow.com. This is a historical example; results on this page do not refresh. Swipe across the image to inspect its columns.
- 01Symbol + expiry IV
- 02Price each expiry
- 03Move and range
A priced range, not a price forecast.
Read the output
- 01Per-expiry at-the-money implied volatility, OI-weighted over the near-50Δ band.
- 02The one-standard-deviation move: spot × IV × √(DTE/365).
- 03The implied range low and high for each expiry.
Keep in mind
It is not a forecast — it is what the option market is charging.
How to read it
From report to evidence01
Type a symbol
Each upcoming expiry is priced off its own ATM implied volatility, not a single 30-day reading.
02
Read the near expiry
A weekly expiry priced far above its neighbours usually means a dated event sits inside that window.
03
Compare to what happened
Implied Move vs Realized Move shows how the charged range has compared with outcomes.
Method and limitations
A one-screen Cookbook tool: the one-standard-deviation move priced into each upcoming expiry for a symbol, with the range it implies. Official app template: Expected Move.
What the report computes
- Per-expiry at-the-money implied volatility, OI-weighted over the near-50Δ band.
- The one-standard-deviation move: spot × IV × √(DTE/365).
- The implied range low and high for each expiry.
What it does not claim
- It is not a forecast — it is what the option market is charging.
- The implied range runs systematically wider than what tends to be realised.
- Roughly a 2-in-3 chance of settling inside the range, and only if vol is realised as priced.
Prices each expiry off its own ATM implied volatility rather than scaling one 30-day number, so an event sitting inside a single weekly window shows up as that week being expensive.
Frequently asked questions
- Why not just use 30-day IV for every expiry?
- Because a 3-day and a 90-day expiry are rarely priced at the same volatility. This reads each expiry’s own at-the-money IV, so a weekly reflects weekly vol.
- Is the expected move a prediction?
- No. It is the range the option market is charging for. The volatility risk premium means that range is usually wider than what actually gets realised.
Related recipes
- Implied vs realizedCompare a scaled IV30 move to what price actually did, without pretending IV30 is a 5-day vol surface.
- Vol surfaceSee whether options are rich or cheap on the surface before you sell or buy premium.
- IV rank boardAnswer "whose implied vol is rich right now" without already knowing which symbol to check.
More learning resources
The public page explains the report. Run the official template in TradingFlow for a selected completed market session.
Open Expected move