Official template · advanced · Volatility
Compare a priced move with what happened.
Compare a scaled IV30 move to what price actually did, without pretending IV30 is a 5-day vol surface.
The report UI is recreated from the test app's Sep 25, 2026 session, not a live screen. A historical example with music; no narration.
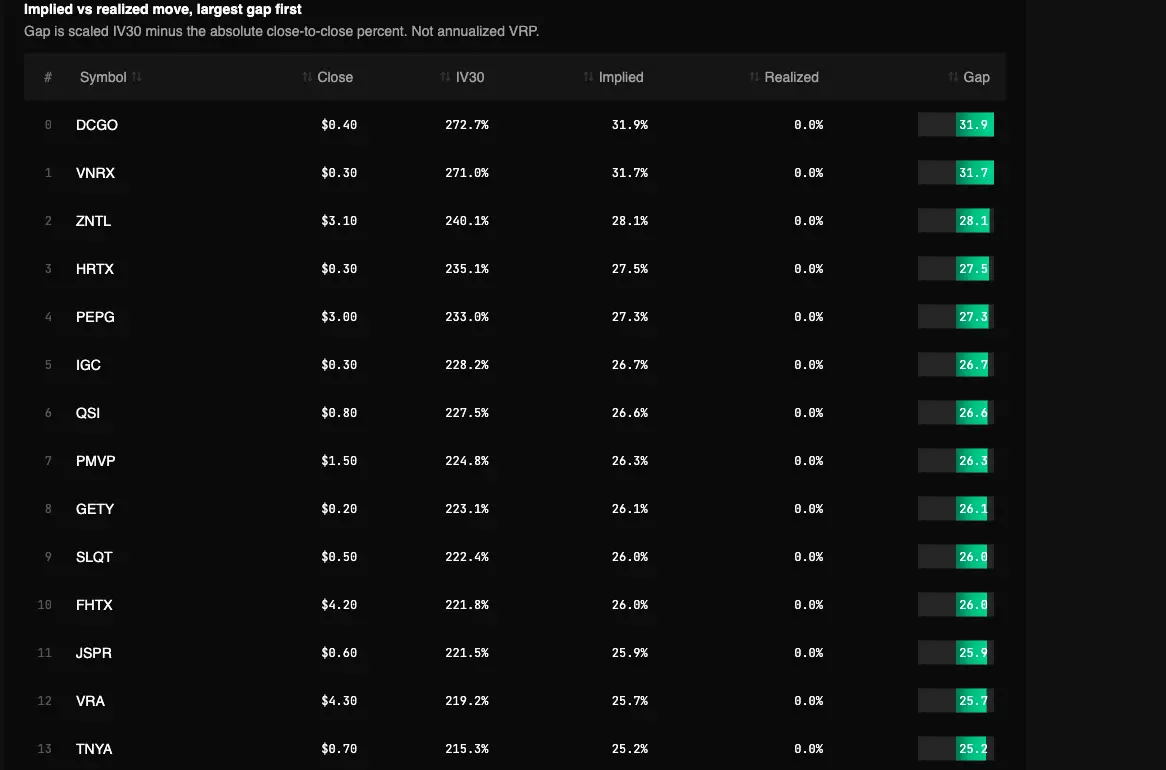
Captured Sep 23, 2026 on testapp.tradingflow.com. This is a historical example; results on this page do not refresh. Swipe across the image to inspect its columns.
- 01IV30 + horizon
- 02Compare actual close
- 03Percent-move gap
A scaled move comparison, not annualized VRP.
Read the output
- 01Implied percent move ≈ IV30 × √(horizon/365). IV30 is 30-day vol scaled to the horizon.
- 02Realized percent move = |close / prior close − 1| using the latest close on or before (session − horizon).
- 03Gap = implied − realized. Names with no prior close in (horizon, horizon+7) days back are omitted.
Keep in mind
This is not VRP (annualized IV30 − RV20 with a z-score).
How to read it
From report to evidence01
Run the move comparison
Open Implied Move vs. Realized Move in Cookbooks. Default horizon is 5 calendar days.
02
Read gap as conversion error, not edge
A large positive gap means scaled IV30 exceeded the actual close-to-close move. Mega-caps often show smaller gaps than small-caps.
03
Use VRP for the annualized z-score
If you want IV30 − RV20 versus that name’s own history, that is the VRP tracker, not this page.
Method and limitations
A paid Cookbook that converts 30-day ATM IV into a percent move over a reader horizon and subtracts the absolute close-to-close change. Names without a prior close in the window are omitted. Distinct from VRP’s annualized IV−RV20 z-score. Official app template: Implied Move vs. Realized Move.
What the report computes
- Implied percent move ≈ IV30 × √(horizon/365). IV30 is 30-day vol scaled to the horizon.
- Realized percent move = |close / prior close − 1| using the latest close on or before (session − horizon).
- Gap = implied − realized. Names with no prior close in (horizon, horizon+7) days back are omitted.
What it does not claim
- This is not VRP (annualized IV30 − RV20 with a z-score).
- Vendor HV is not used. Scaling 30-day IV is not a short-dated implied-vol surface.
- A positive gap is not a published edge or a sell-premium instruction. The lookback never runs past available bars.
Implied move is IV30 × √(horizon/365); realized is |close/prior close − 1| with prior close bounded by the represented session minus horizon — never an unbounded max(date) and never vendor HV.
Frequently asked questions
- Is this the same as the VRP tracker?
- No. VRP is annualized IV30 minus 20-session realized vol, with a z-score. This recipe is a percent move over N days.
- Why is a name missing?
- No close on or before (session − horizon) inside a 7-day slack window. The recipe will not look past available bars or invent a start price.
Related recipes
More learning resources
Related glossary
Related personas
The public page explains the report. Run the official template in TradingFlow for a selected completed market session.
Open Implied vs realized