Official template · basic · Volatility
See upcoming earnings and the move being priced.
Answer "who reports soon and what is priced in" in one list.
The report UI is recreated from the test app's Sep 25, 2026 session, not a live screen. A historical example with music; no narration.
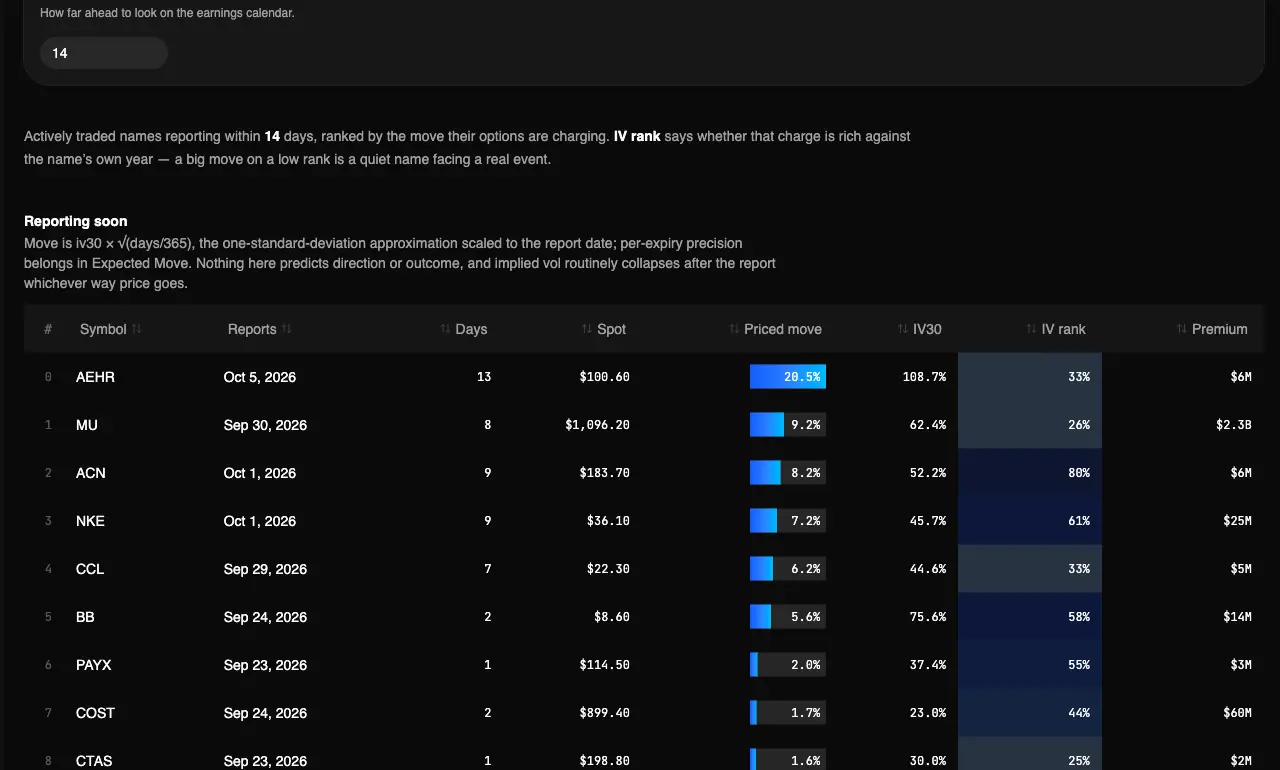
Captured Sep 23, 2026 on testapp.tradingflow.com. This is a historical example; results on this page do not refresh. Swipe across the image to inspect its columns.
- 01Reporting window
- 02Scale IV30 to event
- 03Priced earnings moves
Per-expiry precision belongs in Expected Move.
Read the output
- 01Names with a reporting date inside a tunable window, filtered to real option activity.
- 02The one-standard-deviation move scaled to the report date from 30-day implied volatility.
- 03IV30 and 1-year IV rank alongside the move.
Keep in mind
Nothing here predicts direction or outcome.
Explore the concept behind this report
IV crush is the post-event drop in implied volatility. Premium can shrink even when direction looks right.
How to read it
From report to evidence01
Read move against rank
A big move on a low IV rank is a quiet name facing a real event.
02
Check liquidity
Premium traded today shows whether the name has options worth trading around the print.
03
Price the exact expiry
Expected Move reads each expiry’s own ATM implied volatility instead of scaling one number.
Method and limitations
A one-screen Cookbook tool: the earnings calendar for actively traded names, ranked by the move their options price in. Official app template: Earnings — What’s Priced In.
What the report computes
- Names with a reporting date inside a tunable window, filtered to real option activity.
- The one-standard-deviation move scaled to the report date from 30-day implied volatility.
- IV30 and 1-year IV rank alongside the move.
What it does not claim
- Nothing here predicts direction or outcome.
- Implied volatility routinely collapses after the report whichever way price goes.
- A simple iv30 approximation — per-expiry precision belongs in Expected Move.
Pairs the priced move with 1-year IV rank, which separates a genuinely elevated event from a name that is simply always expensive.
Frequently asked questions
- Does a big implied move mean a big actual move?
- No. Implied ranges run systematically wider than realised ones. That gap is the volatility risk premium, and it is why selling into earnings is a strategy at all.
- What is IV crush?
- Implied volatility rises into a known event and falls once the uncertainty resolves. An option can lose value after the report even when the stock moved the way you expected.
Related recipes
- Expected moveAnswer "how far is this name priced to move by Friday" without building a vol surface first.
- Implied vs realizedCompare a scaled IV30 move to what price actually did, without pretending IV30 is a 5-day vol surface.
- IV rank boardAnswer "whose implied vol is rich right now" without already knowing which symbol to check.
More learning resources
The public page explains the report. Run the official template in TradingFlow for a selected completed market session.
Open Earnings move