
October 9 Recap: Balanced Tape, MU $1.5B Bearish, SPX GEX Positive
$15.4B in single-name premium, 23% bullish versus 23% bearish. MU led at $1.5B Bearish; SPX GEX was +$54.45B.
This edition reads TradingFlow’s Daily Market Recap for October 9, 2026, captured on October 13. The quoted figures agreed across two runs. This is a completed-session report, not a trade recommendation.
Keep two clocks separate: premium, sentiment, and prints describe the session tape; GEX and IV are the recap’s T+1 / prior-close snapshots. This historical recap is not a live intraday gamma map.
$15.4B, 67% calls, 23% bullish versus 23% bearish. MU led at $1.5B Bearish; SPX net GEX printed +54.45B, Positive.
Open Daily Market Recap or the October 9 session. Sign-in and a paid entitlement may be required.
What the recap printed
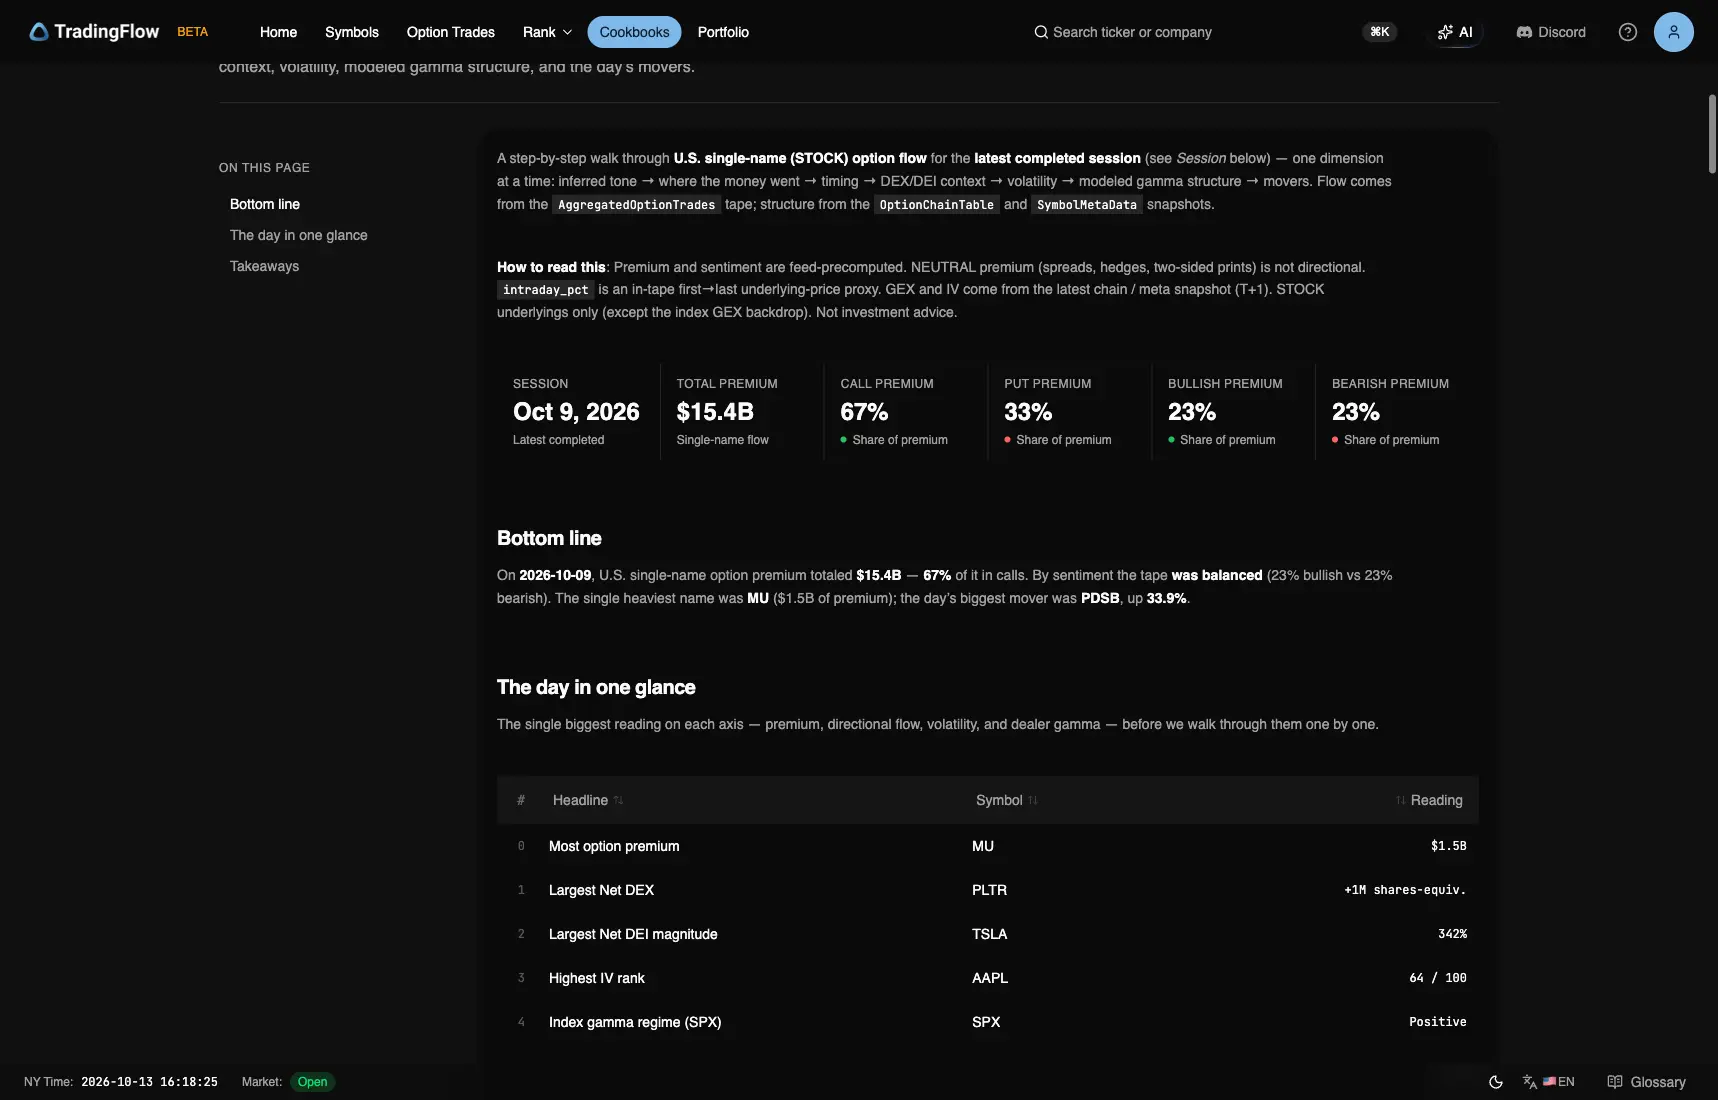
Test app, session 2026-10-09, KPI. Captured October 13, 2026.
| Reading | Recap value |
|---|---|
| Single-name premium | $15.4B |
| Call / Put | 67% / 33% |
| Bullish / Bearish | 23% / 23% |
| Overall tone | was balanced |
| First 30-minute window | 09:30 · $2.3B |
Sentiment bars: Neutral $8.5B, Bullish $3.5B, Bearish $3.5B. Call share is option type, not bullish sentiment. Neutral premium supplies no direction; rounded buckets need not sum exactly to the rounded KPI total.
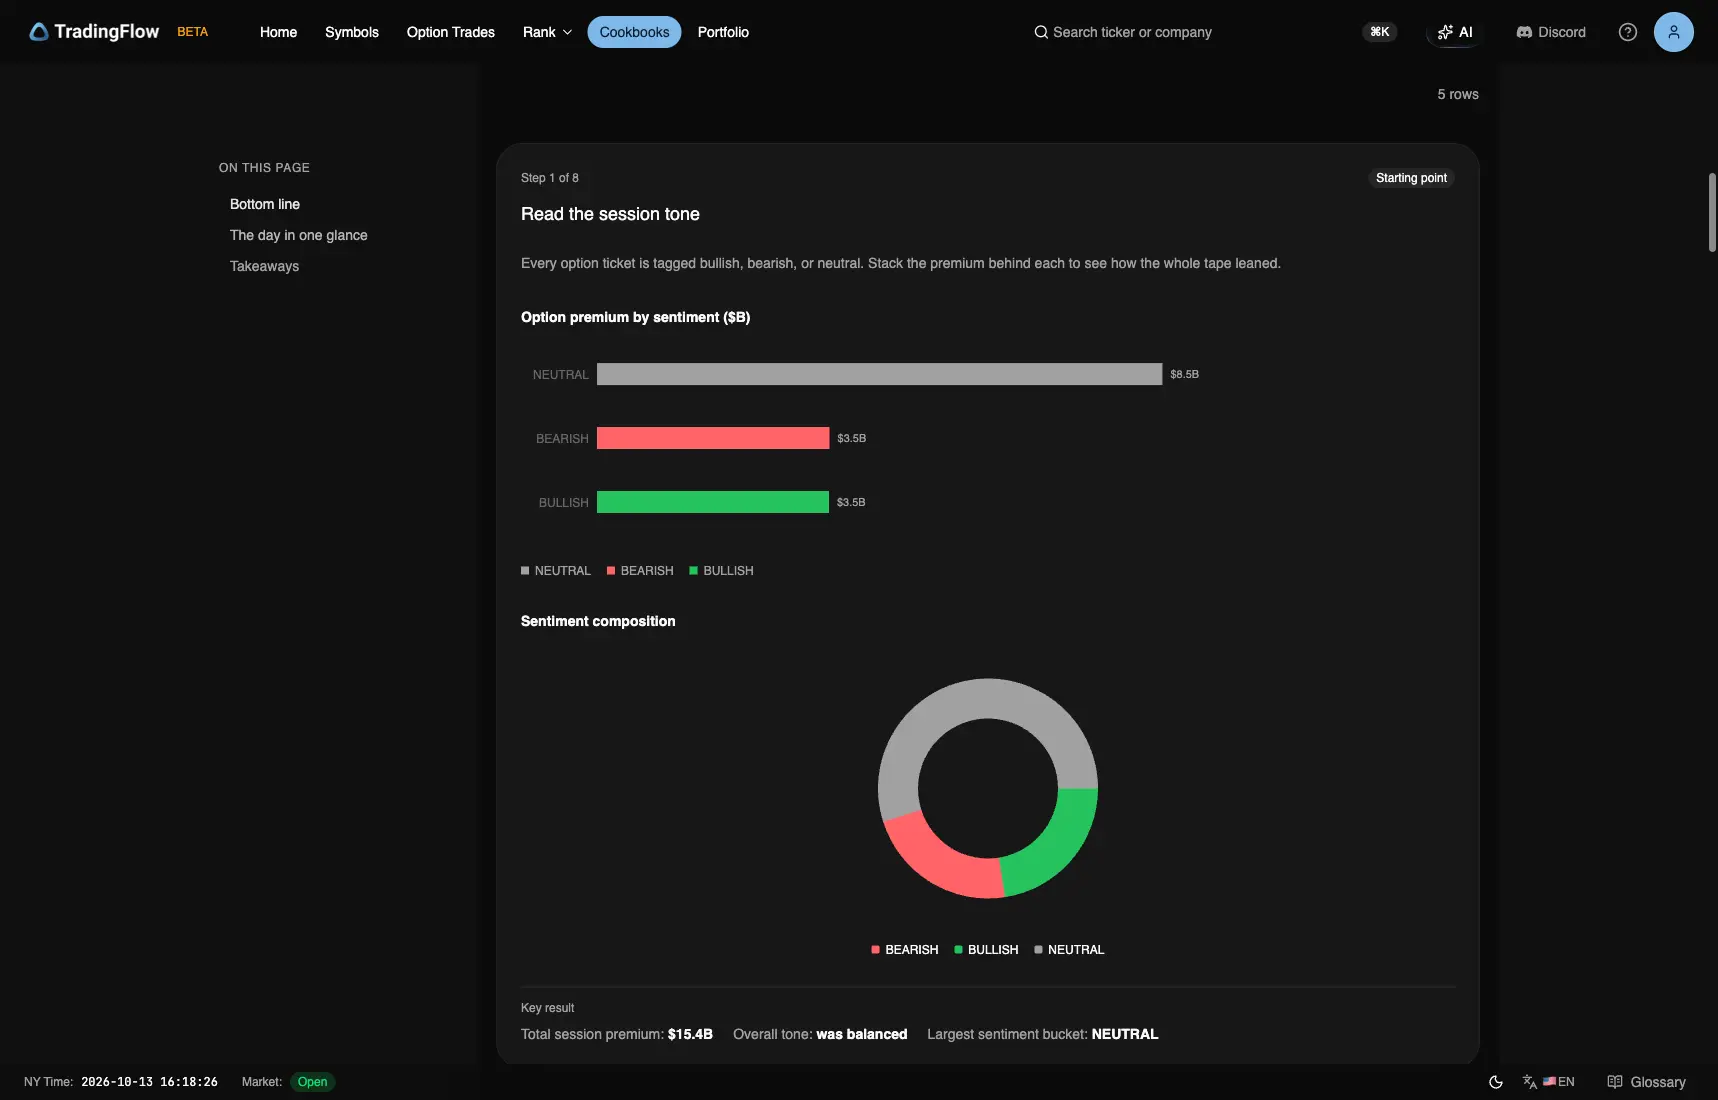
Test app, session 2026-10-09, Step 1. Captured October 13, 2026.
Leaders: where premium concentrated
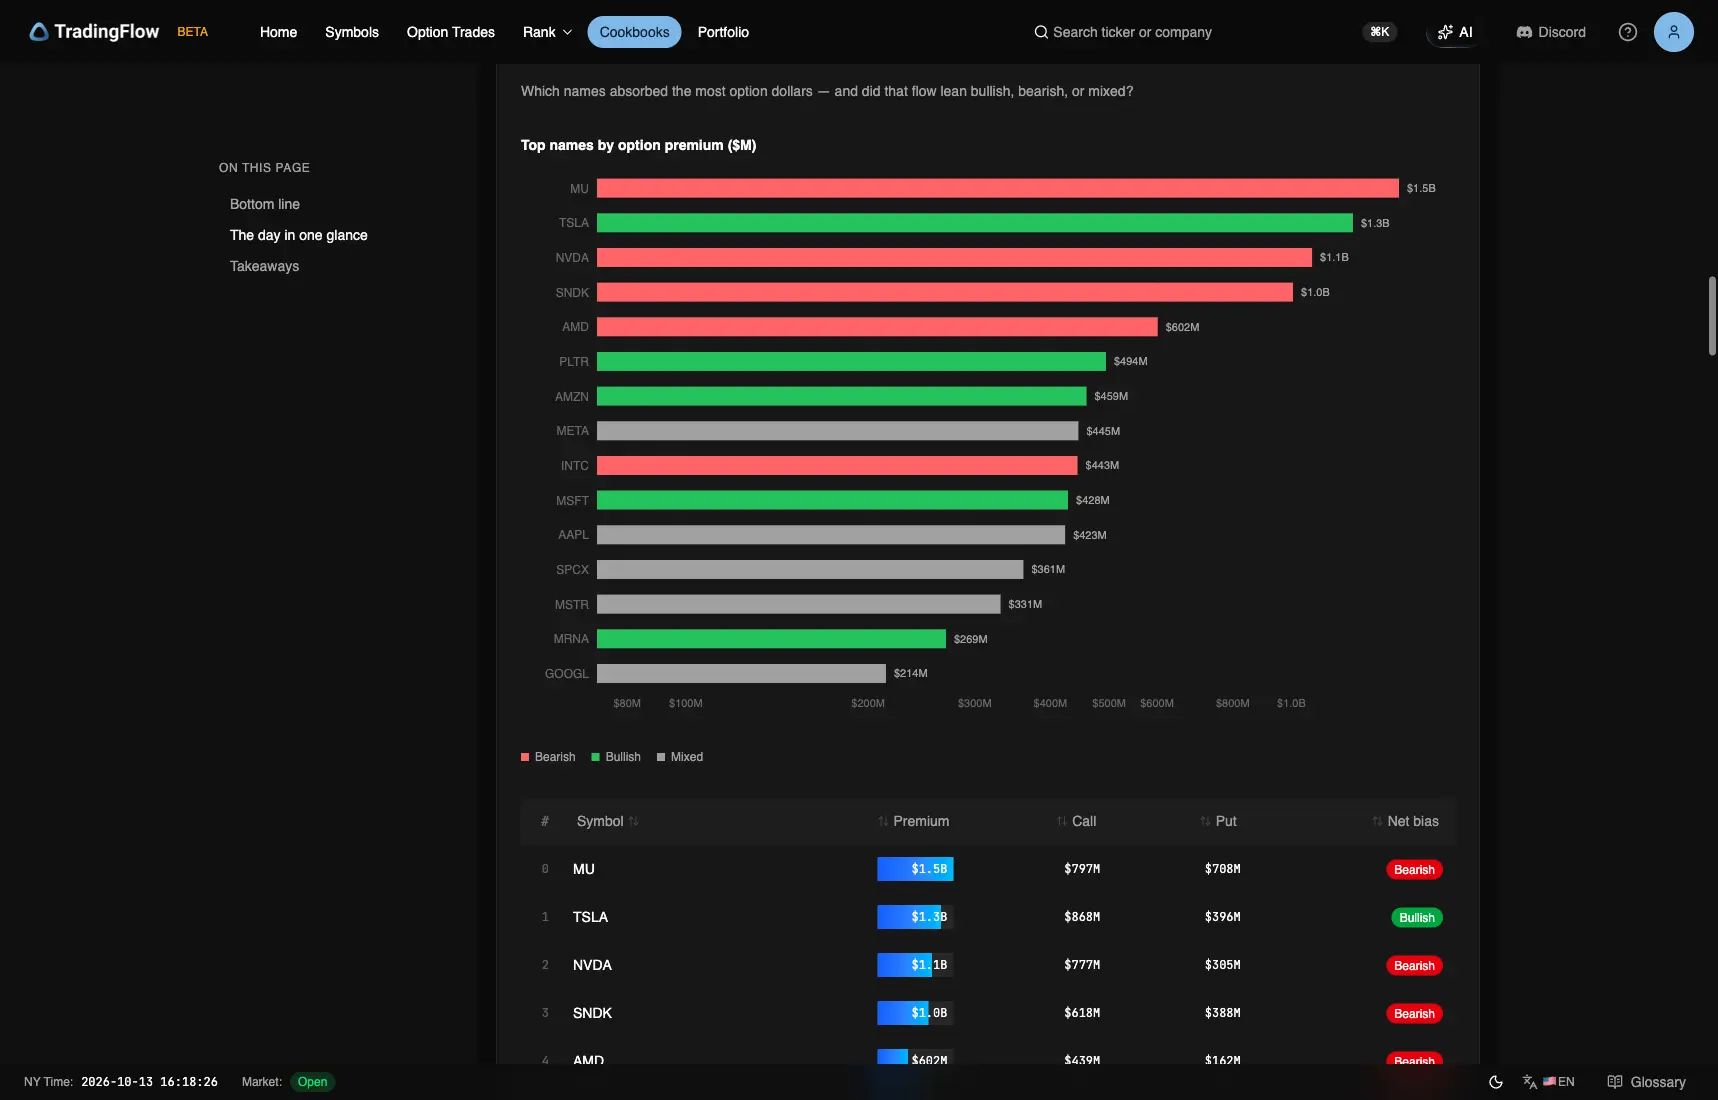
Test app, session 2026-10-09, Step 2. Captured October 13, 2026.
| Symbol | Premium | Call | Put | Net bias |
|---|---|---|---|---|
| MU | $1.5B | $797M | $708M | Bearish |
| TSLA | $1.3B | $868M | $396M | Bullish |
| NVDA | $1.1B | $777M | $305M | Bearish |
| SNDK | $1.0B | $618M | $388M | Bearish |
| AMD | $602M | $439M | $162M | Bearish |
| PLTR | $494M | $396M | $98M | Bullish |
MU, NVDA, SNDK, and AMD were Bearish, while TSLA and PLTR were Bullish. The balanced market-wide split coexisted with opposing tags among the heaviest names.
The bottom line and glance show MU $1.5B; the leaders table and headline cards show MU $1.5B. Preserve these field readings rather than reconciling them into a new number.
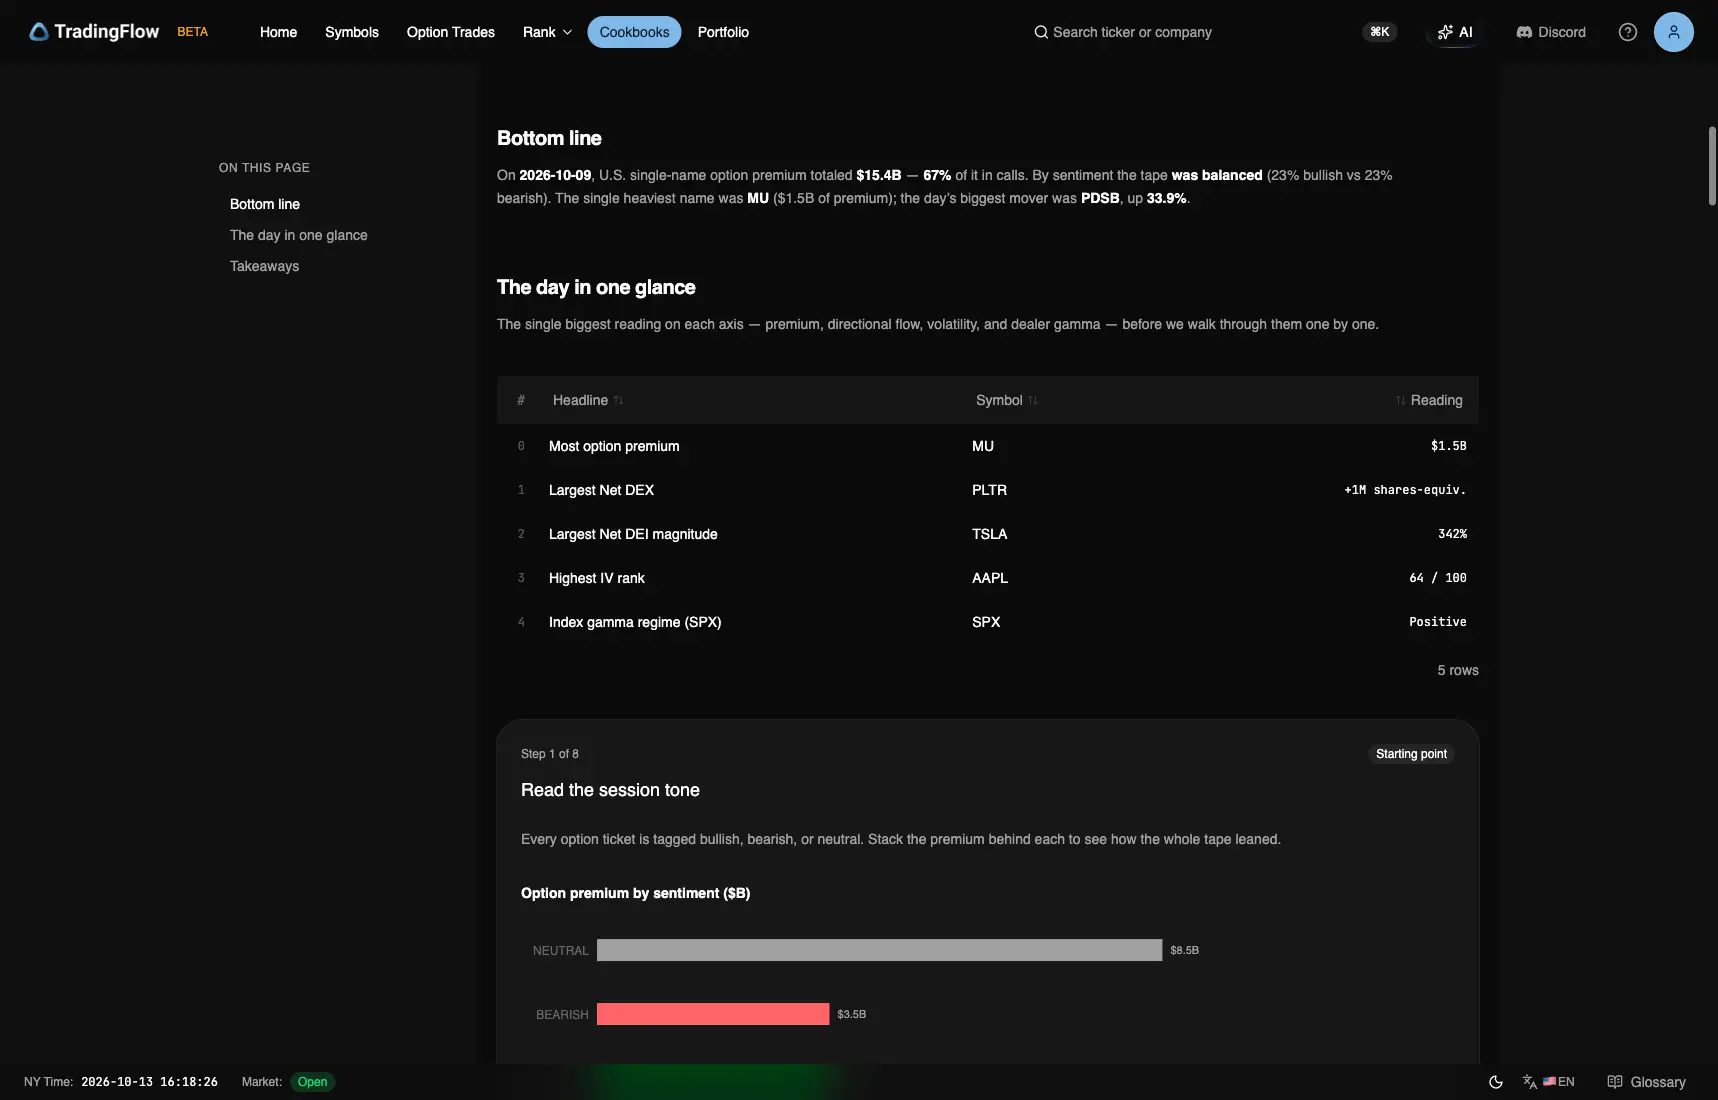
Test app, session 2026-10-09, Bottom line / glance. Captured October 13, 2026.
Exposure and volatility context
The glance lists PLTR +1M shares-equiv. as largest Net DEX and TSLA 342% as largest Net DEI magnitude. Step 4 prints TSLA 342%, with Positive Net DEX. DEI is an unsigned activity-relative magnitude; DEX provides a separate signed classification. Neither proves opening intent or actual dealer inventory.
Step 5’s highest IV rank among active names is AAPL 64 / 100, with 28.3% 30-day implied volatility. This is snapshot volatility context, not realized session volatility.
Index GEX: SPX Positive
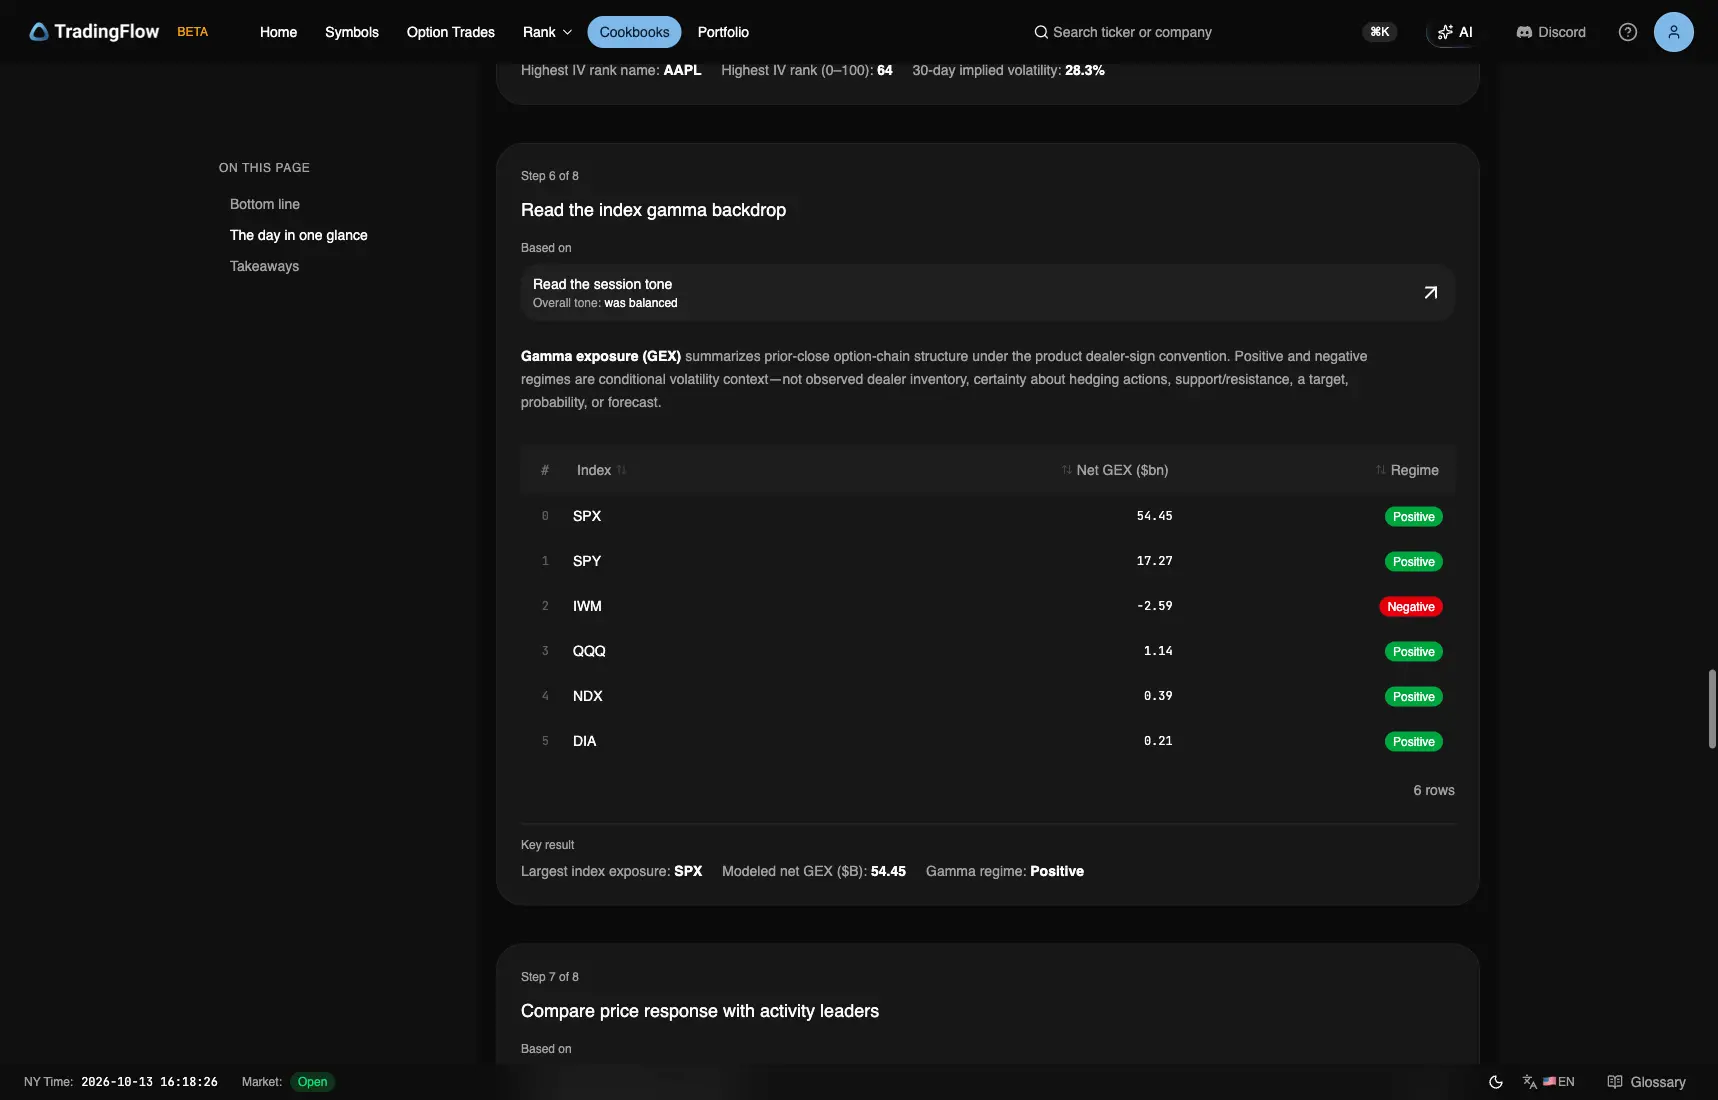
Test app, session 2026-10-09, Step 6 · T+1. Captured October 13, 2026.
| Index | Net GEX ($B) | Regime |
|---|---|---|
| SPX | +54.45 | Positive |
| SPY | +17.27 | Positive |
| IWM | −2.59 | Negative |
| QQQ | +1.14 | Positive |
| NDX | +0.39 | Positive |
| DIA | +0.21 | Positive |
SPX, SPY, QQQ, NDX, and DIA were Positive. IWM was the Negative exception. This is a split structural backdrop, not one universal market regime.
GEX describes modeled chain structure under TradingFlow’s dealer-sign convention. The regime does not establish observed dealer inventory, a support level, a pin target, or the next session’s direction.
Headline name: MU at $1,029
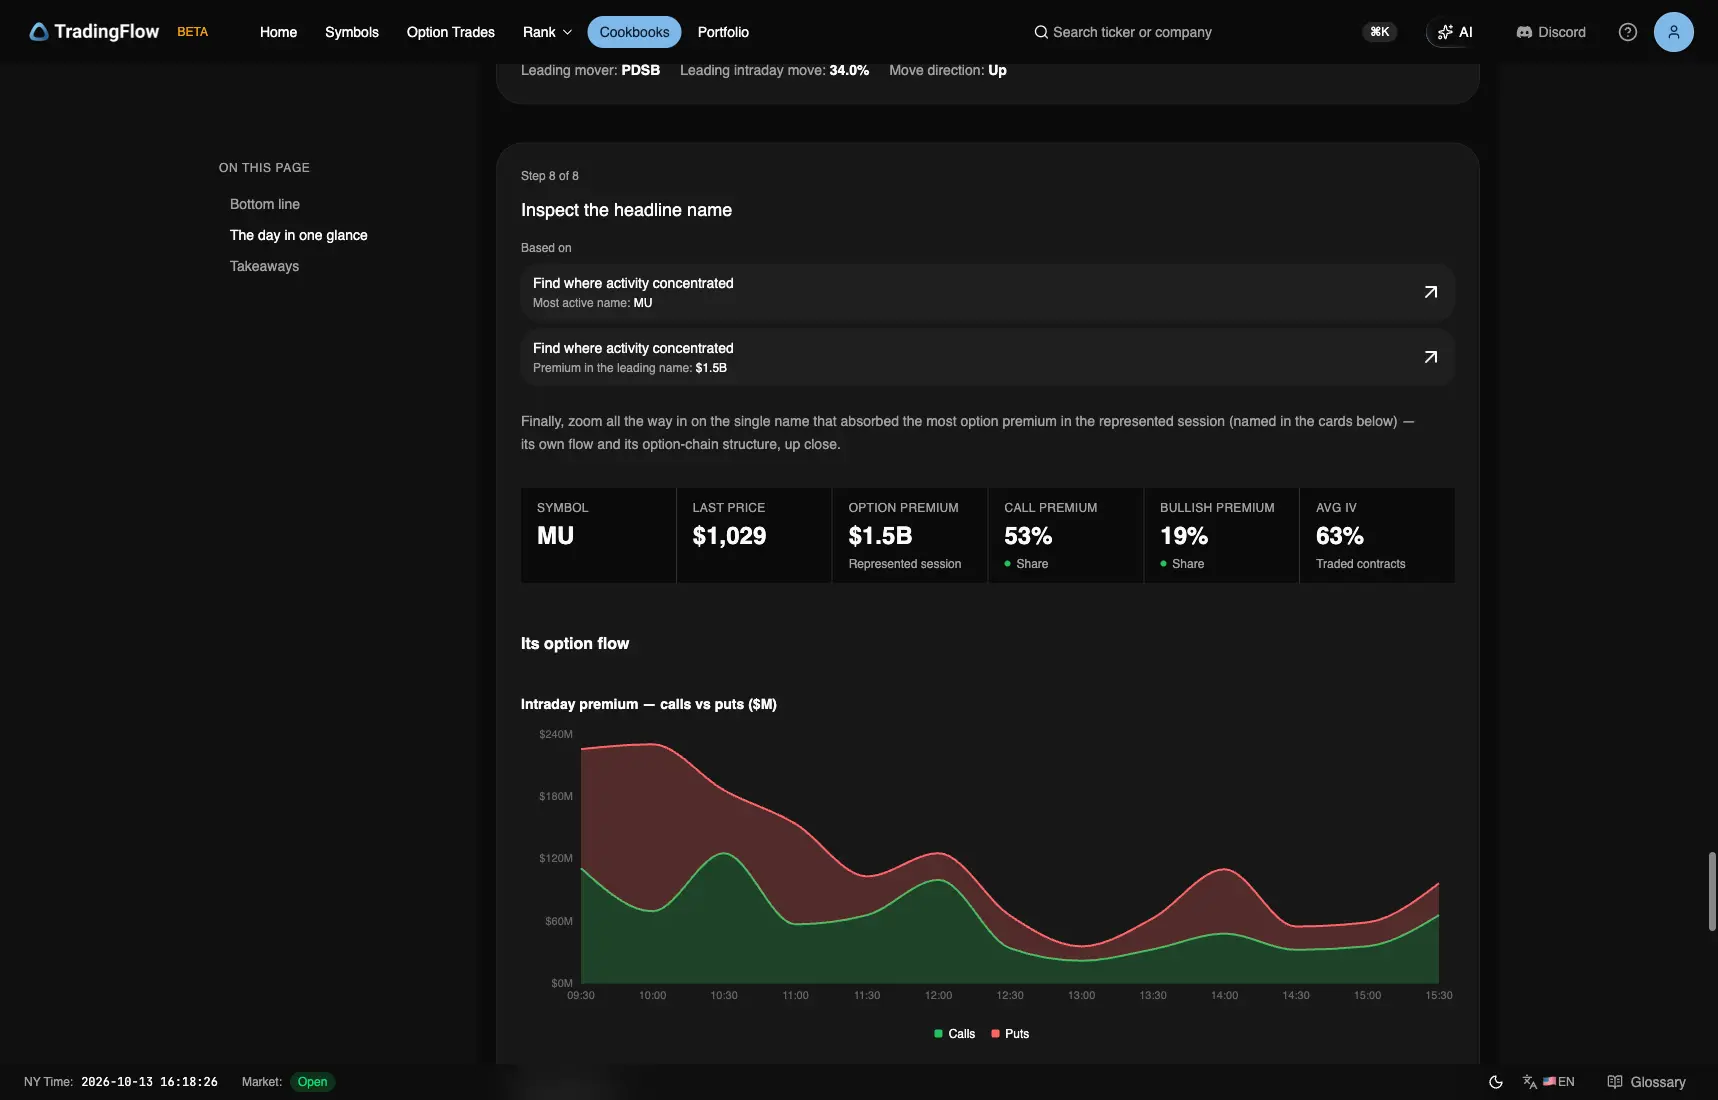
Test app, session 2026-10-09, Step 8. Captured October 13, 2026.
Cards: last $1,029, premium $1.5B, 53% calls, 19% bullish, 63% average IV on traded contracts. The headline name is selected by premium, not by the largest price move.
| Time | Type | Strike | Expiry | Premium | Sentiment |
|---|---|---|---|---|---|
| 12:03 | CALL | 1,150 | 2026-12-18 | $30M | BULLISH |
| 10:39 | CALL | 1,200 | 2027-03-19 | $10M | BEARISH |
| 12:03 | CALL | 1,380 | 2026-12-18 | $8M | BEARISH |
| 13:31 | PUT | 800 | 2028-01-21 | $7M | BEARISH |
| 11:26 | PUT | 1,060 | 2026-10-16 | $7M | BEARISH |
| 10:12 | PUT | 2,480 | 2028-06-16 | $6M | NEUTRAL |
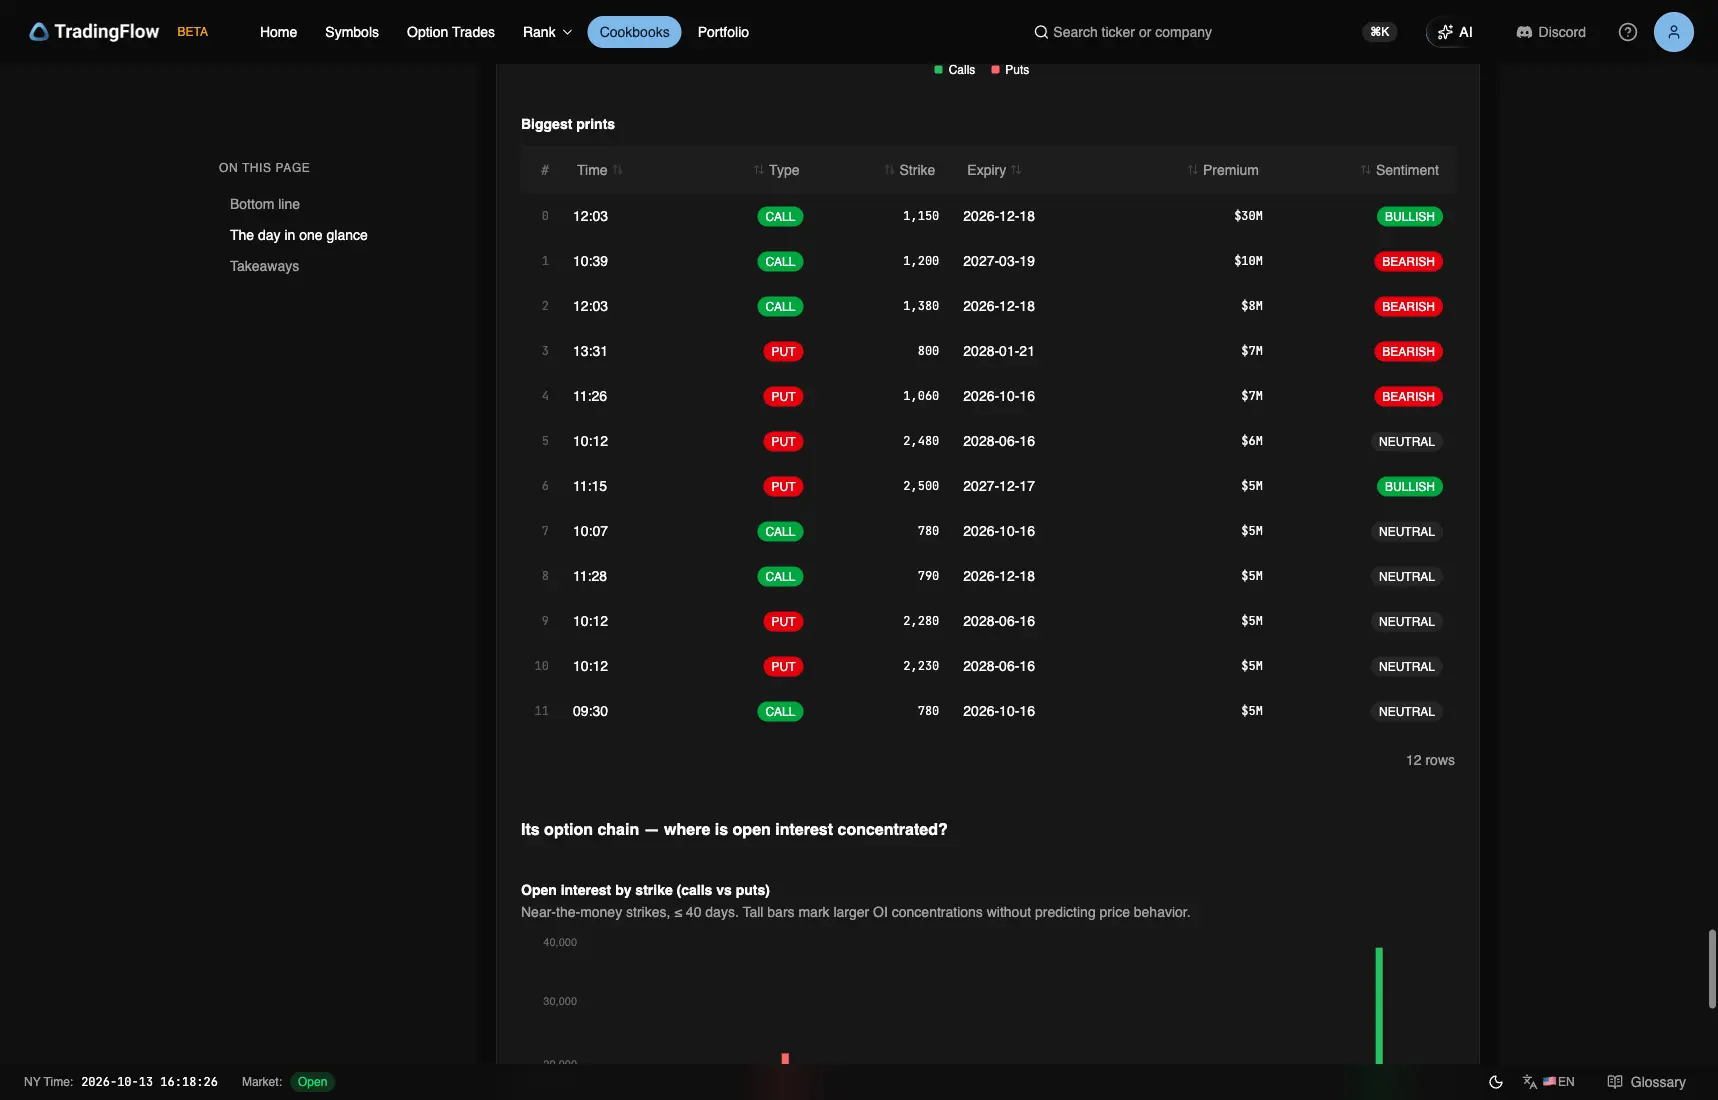
Test app, session 2026-10-09, Step 8 · prints. Captured October 13, 2026.
The largest listed ticket was 12:03 1,150 CALL, expiry 2026-12-18, premium $30M, tagged BULLISH. The largest displayed ticket was Bullish, although MU’s overall leaders-table tag was Bearish. A large ticket can disagree with the aggregate classification.
Ticket tags do not prove who bought or sold, whether a position opened, or whether adjacent prints form a single strategy.
Movers: PDSB +33.9%
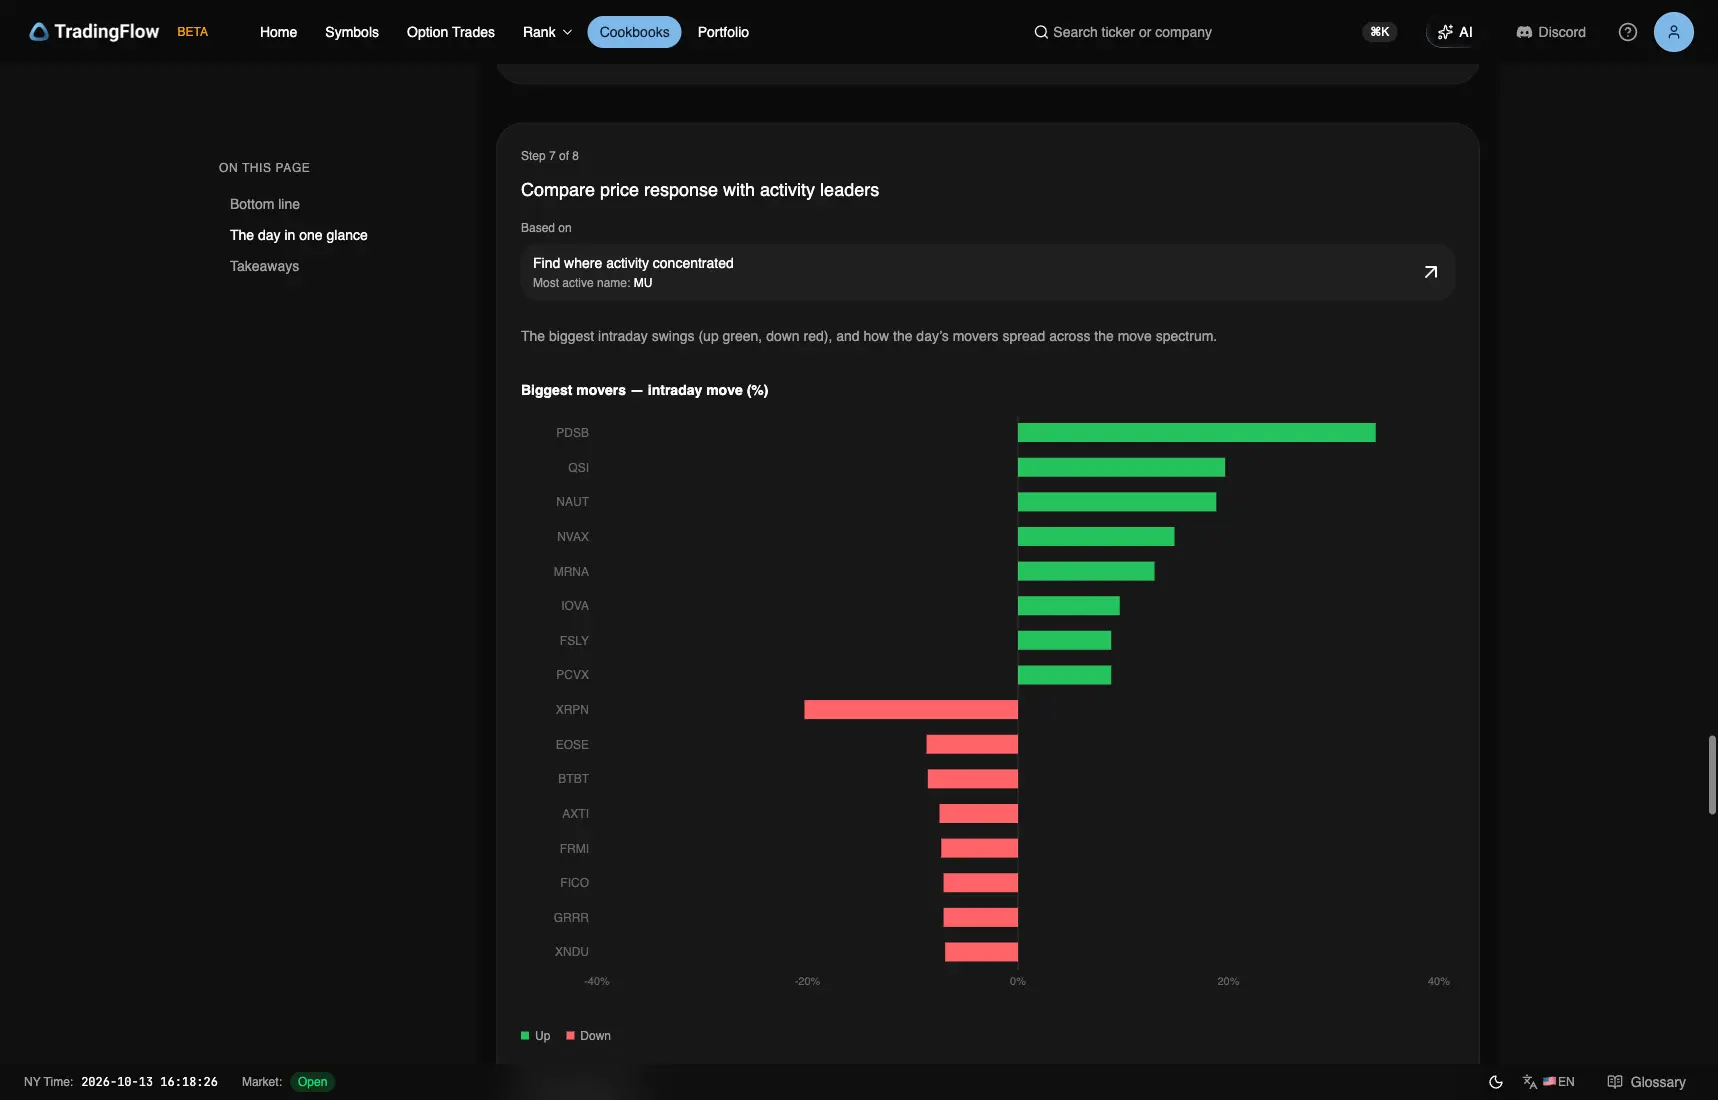
Test app, session 2026-10-09, Step 7. Captured October 13, 2026.
Bottom line: PDSB +33.9%. Step 7 in both runs: PDSB 34.0%, Up. Keep both displayed fields. The bottom line names the largest gain; Step 7’s key can select a gain or loss across runs.
Some lower mover rows changed order between runs; the quoted leading-mover values stayed the same.
The intraday_pct reading is a first-to-last underlying-price proxy in the option tape. It is not an independently verified daily stock return, and movers do not prove flow causality.
What this session is evidence of
| Question | TradingFlow reading | Clock |
|---|---|---|
| Size / tone | $15.4B · 23% Bullish / 23% Bearish | Session tape |
| Concentration | MU $1.5B Bearish | Session leaders |
| Relative exposure | TSLA DEI 342% · DEX Positive | Session exposure |
| Volatility | AAPL IV rank 64 · IV 28.3% | T+1 |
| Index structure | SPX +54.45B Positive | T+1 |
| Largest print | MU 1,150 CALL 2026-12-18 $30M BULLISH | Session ticket |
Reproduce the findings
- Open the October 9 recap; confirm Oct 9, 2026 in the session KPI.
- Record the KPI strip and Step 1 sentiment before reading the leaders.
- Compare MU’s leaders-table tag, headline cards, and largest ticket.
- Read Steps 4–6 separately: exposure magnitude, volatility rank, and all six index GEX rows.
- Keep both mover fields, the session date, and the snapshot clock. Stop before turning a report into a buy/sell instruction.
TradingFlow App Home → Cookbooks → Daily Market Recap → select the completed session.
Related reading
Related Articles
October 12 Recap: Leaned Bearish, MU $1.5B Mixed, SPX GEX Positive
$14.2B in single-name premium, 22% bullish versus 24% bearish. MU led at $1.5B Mixed; SPX GEX was +$61.43B.
October 8 Recap: Leaned Bearish, MU $1.7B Bearish, SPX GEX Negative
$18.6B in single-name premium, 22% bullish versus 26% bearish. MU led at $1.7B Bearish; SPX GEX was −$35.43B.
October 7 Recap: Balanced Tape, MU $2.1B Bullish, SPX GEX Positive
$14.1B in single-name premium, 24% bullish versus 24% bearish. MU led at $2.1B Bullish; SPX GEX was +$13.34B.