October 28 Recap: MU's Four 15:52 Call Prints Line Up as a Roll Into February
$14.5B in single-name premium, 27% bullish versus 27% bearish. MU led at $2.0B Mixed; SPX GEX was +$22.53B.

Four MU call prints in the same minute, 15:52, line up as a call-spread roll on October 28: the November 980/1,150 pair against the February 1,250/1,550 pair, about $13M apart. MU retook the lead at $2.0B, META's December 800 puts printed three times among the session's 25 largest tickets, and SPY and QQQ flipped back to Negative GEX.
$14.5B, 64% calls, 27% bullish versus 27% bearish. MU led at $2.0B Mixed; four of six index GEX rows were Positive.
Open Daily Market Recap or the October 28 session. Sign-in and a paid entitlement may be required.
This edition's figures in 45 seconds. The numbers match the tables below.
Was MU's late block a call-spread roll?
After the close, one read described a 7,000-lot MU roll from the November 980/1,150 call spread into the February 1,250/1,550 spread, for a credit of about $13.7M. The session's 25 largest tickets:
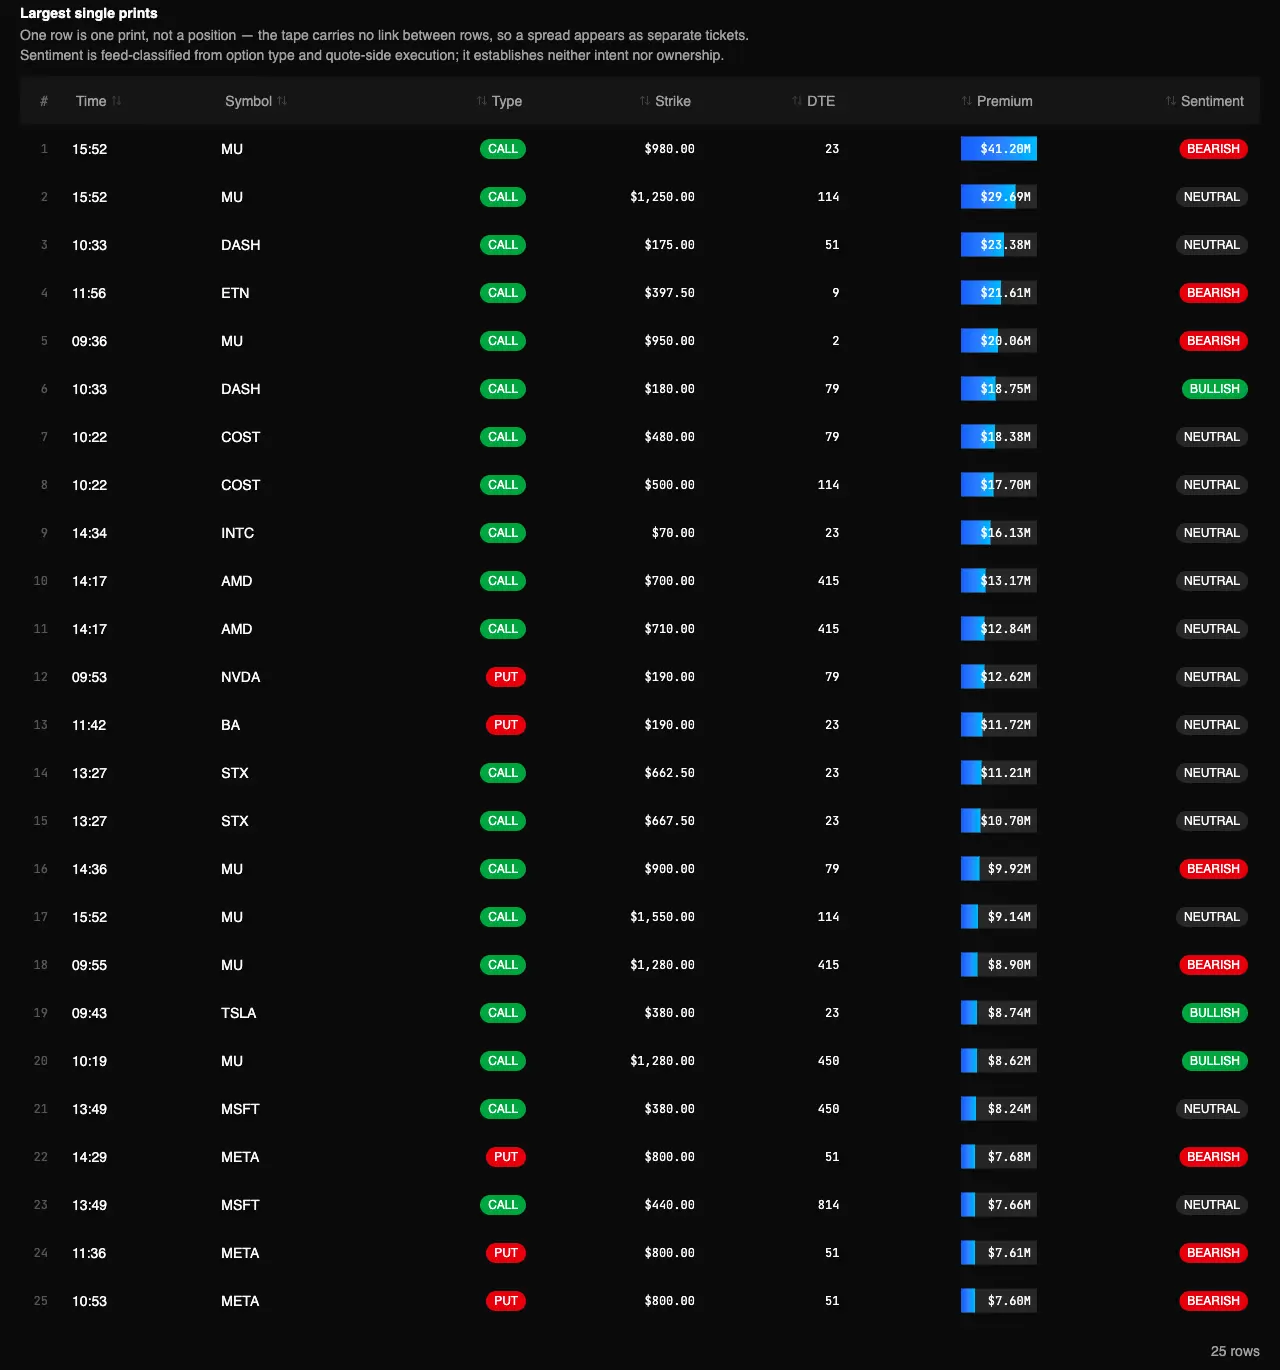
Test app, Cookbooks · Biggest Options Trades, session 2026-10-28. Captured October 30, 2026 (New York time).
| Time | Contract | Premium | Tag |
|---|---|---|---|
| 15:52 | 980 CALL 2026-11-20 | $41.20M | BEARISH |
| 15:52 | 1,150 CALL 2026-11-20 | $7M | BULLISH |
| 15:52 | 1,250 CALL 2027-02-19 | $29.69M | NEUTRAL |
| 15:52 | 1,550 CALL 2027-02-19 | $9.14M | NEUTRAL |
The 1,150 leg is below the session's top 25; the recap's MU prints in Step 8 list it at $7M.
Supported as a pattern. All four legs printed at 15:52. The November pair nets about $34M ($41.20M less $7M) and the February pair about $20.6M ($29.69M less $9.14M), roughly $13M apart. The 980 call is tagged Bearish (sold at the bid) and the 1,150 call Bullish (bought at the ask), the way a long 980/1,150 spread is closed. The tape links no tickets and this view shows no contract counts, so the 7,000-lot size and a single order cannot be confirmed. Clock: session tape.
Were December META puts the day's put story?
The day's flow recaps singled out more than $50M of META December 800 puts. In the same table:
| Time | Contract | Premium | Tag |
|---|---|---|---|
| 10:53 | 800 PUT 2026-12-18 | $7.60M | BEARISH |
| 11:36 | 800 PUT 2026-12-18 | $7.61M | BEARISH |
| 14:29 | 800 PUT 2026-12-18 | $7.68M | BEARISH |
Partly supported. The same December 800 put printed three times among the session's 25 largest tickets, $22.89M in all, each tagged Bearish (bought at the ask). In the recap's leaders, META was the only top-six name with more put than call premium ($402M against $377M). Tickets under $7.6M are not in this list, so a larger total cannot be checked here. Clock: session tape.
The session in numbers
What the recap printed
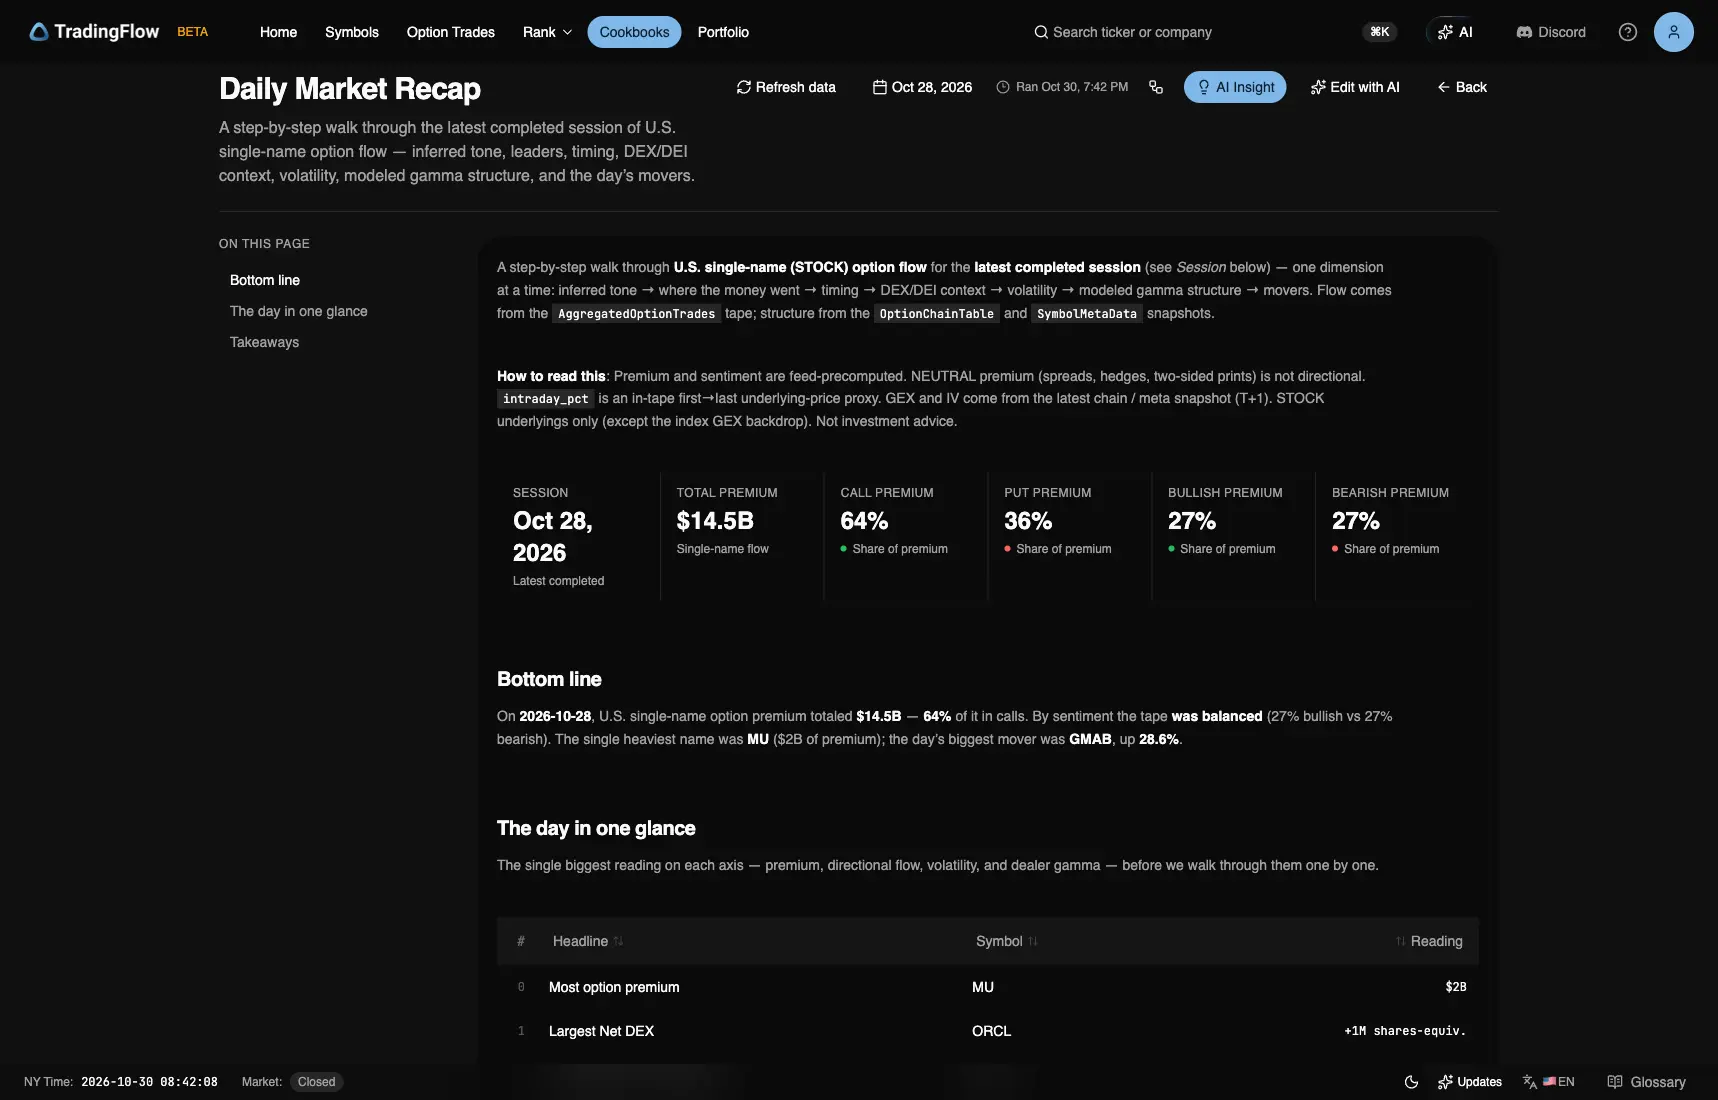
Test app, session 2026-10-28, KPI. Captured October 30, 2026 (New York time).
| Reading | Recap value |
|---|---|
| Single-name premium | $14.5B |
| Call / Put | 64% / 36% |
| Bullish / Bearish | 27% / 27% |
| Overall tone | was balanced |
| First 30-minute window | 09:30 · $2.4B |
Sentiment bars: Neutral $6.7B, Bullish $4.0B, Bearish $3.9B.
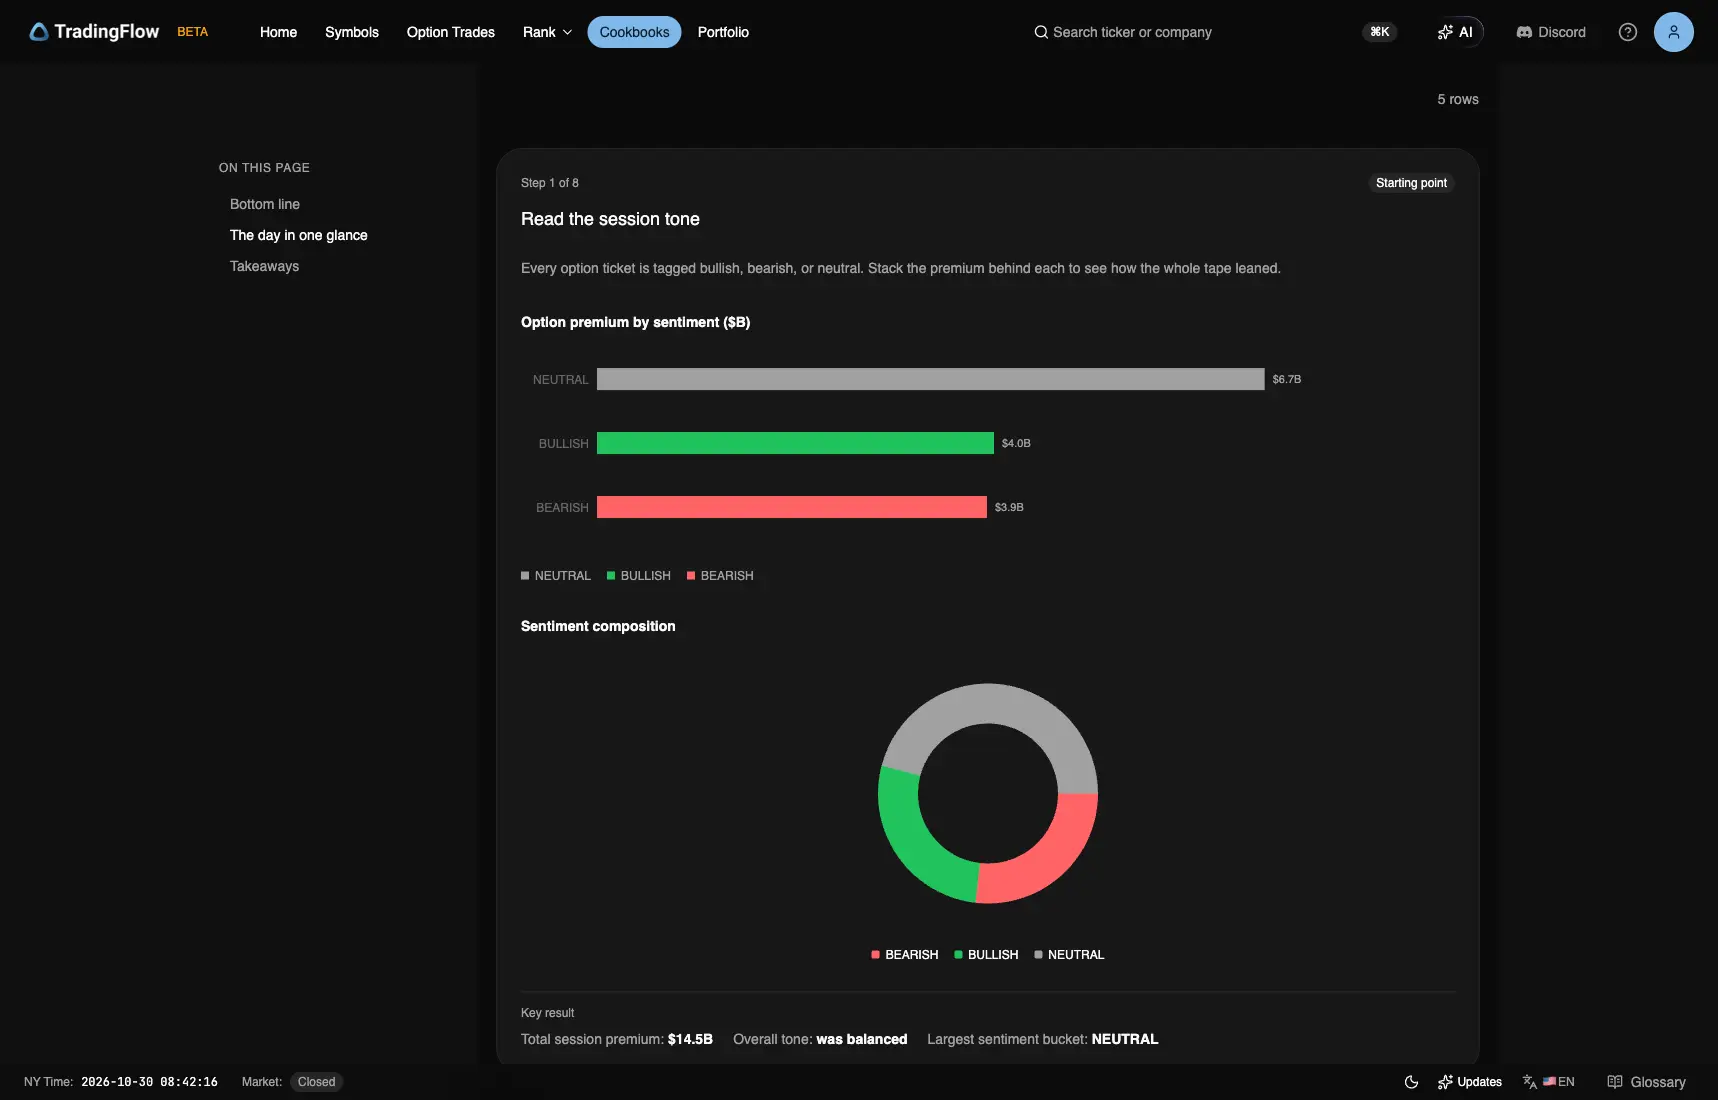
Test app, session 2026-10-28, Step 1. Captured October 30, 2026 (New York time).
What changed since October 27
| Reading | Oct 27 | Oct 28 |
|---|---|---|
| Single-name premium | $14.7B | $14.5B |
| Call / Put | 63% / 37% | 64% / 36% |
| Bullish / Bearish | 26% / 24% | 27% / 27% |
| Tone | leaned bullish | was balanced |
| Leader | TSLA $1.3B Bullish | MU $2.0B Mixed |
| SPX net GEX ($B) | +17.41 Positive | +22.53 Positive |
| Positive index rows | SPX · NDX · SPY · QQQ · IWM · DIA | SPX · NDX · IWM · DIA |
| Largest headline-name ticket | Two TSLA 240 CALLs at $9M, NEUTRAL | MU 980 CALL 2026-11-20 $41M BEARISH |
Bullish and bearish premium finished level again at 27%, so the tone returned to balanced. MU's largest ticket, a $41M call, was more than four times TSLA's $9M top tickets on October 27.
Leaders: where premium concentrated
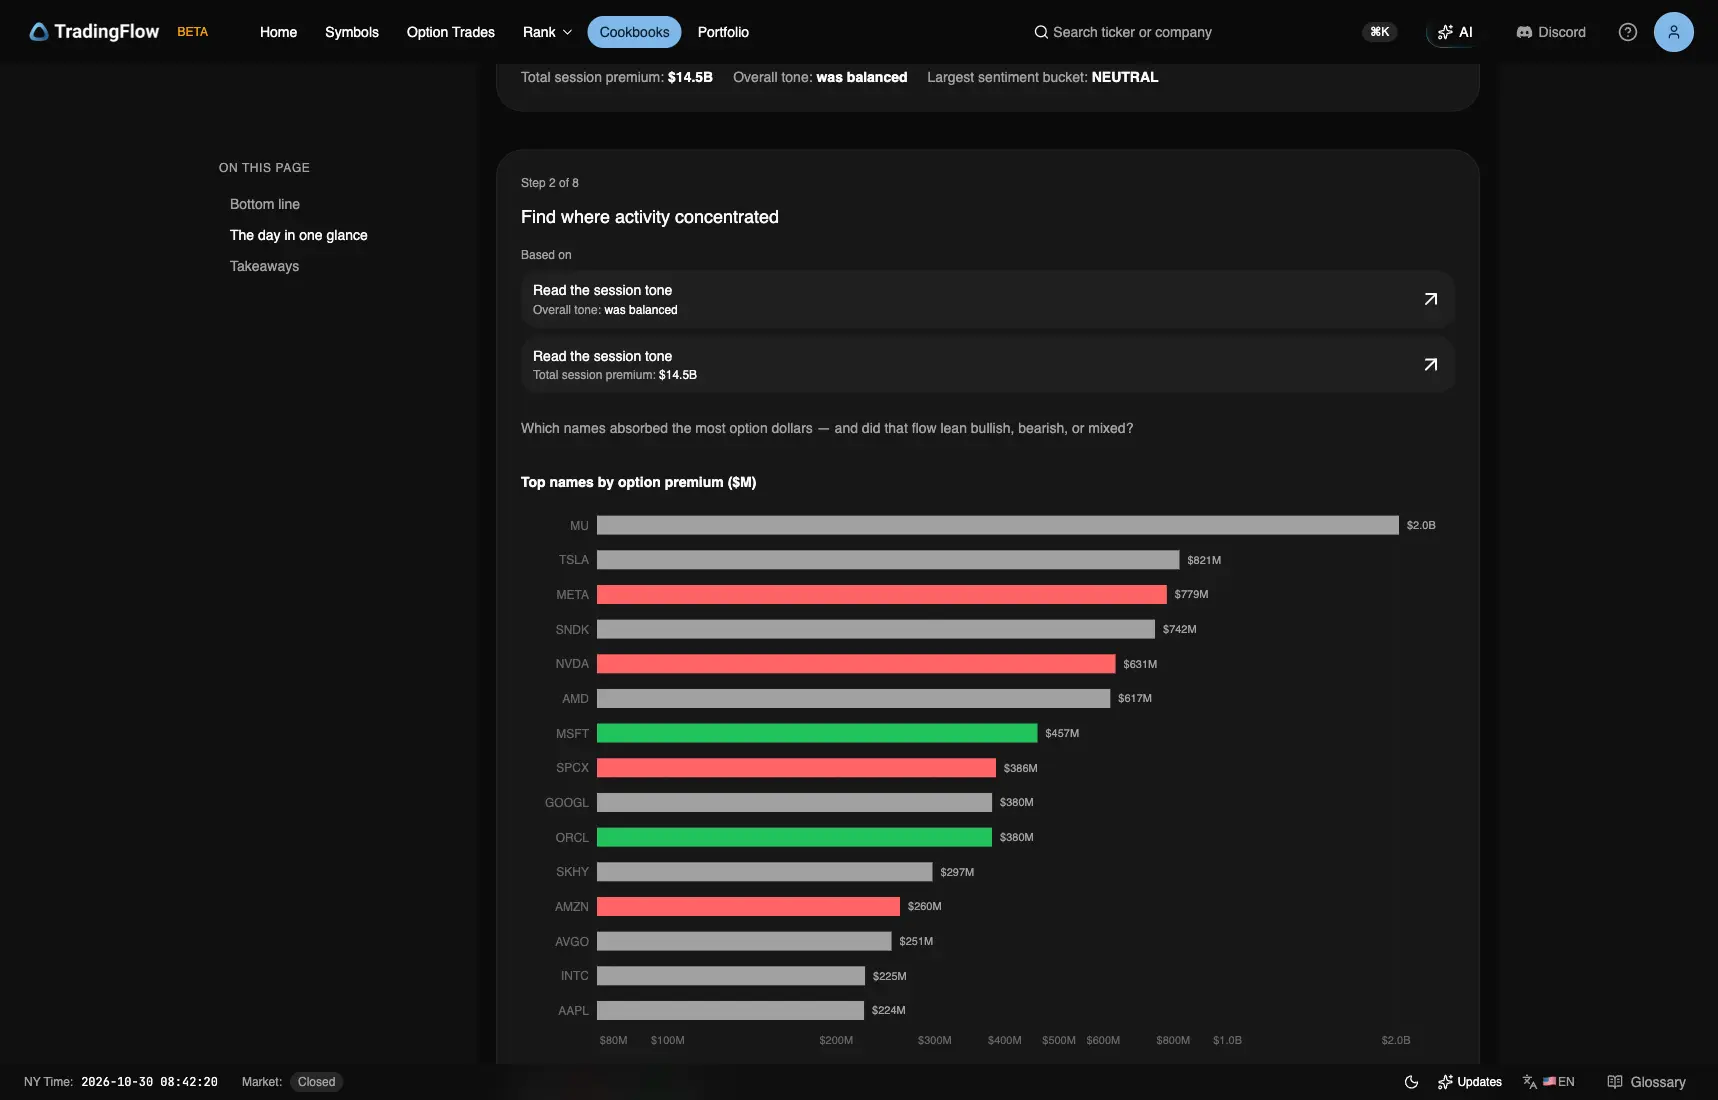
Test app, session 2026-10-28, Step 2. Captured October 30, 2026 (New York time).
| Symbol | Premium | Call | Put | Net bias |
|---|---|---|---|---|
| MU | $2.0B | $1.5B | $531M | Mixed |
| TSLA | $821M | $529M | $292M | Mixed |
| META | $779M | $377M | $402M | Bearish |
| SNDK | $742M | $425M | $317M | Mixed |
| NVDA | $631M | $411M | $220M | Bearish |
| AMD | $617M | $435M | $183M | Mixed |
MU's call premium alone was $1.5B, against $531M in puts. TSLA's tag moved from Bullish to Mixed. META and NVDA were Bearish, and META was the only top-six name with more put than call premium ($402M against $377M).
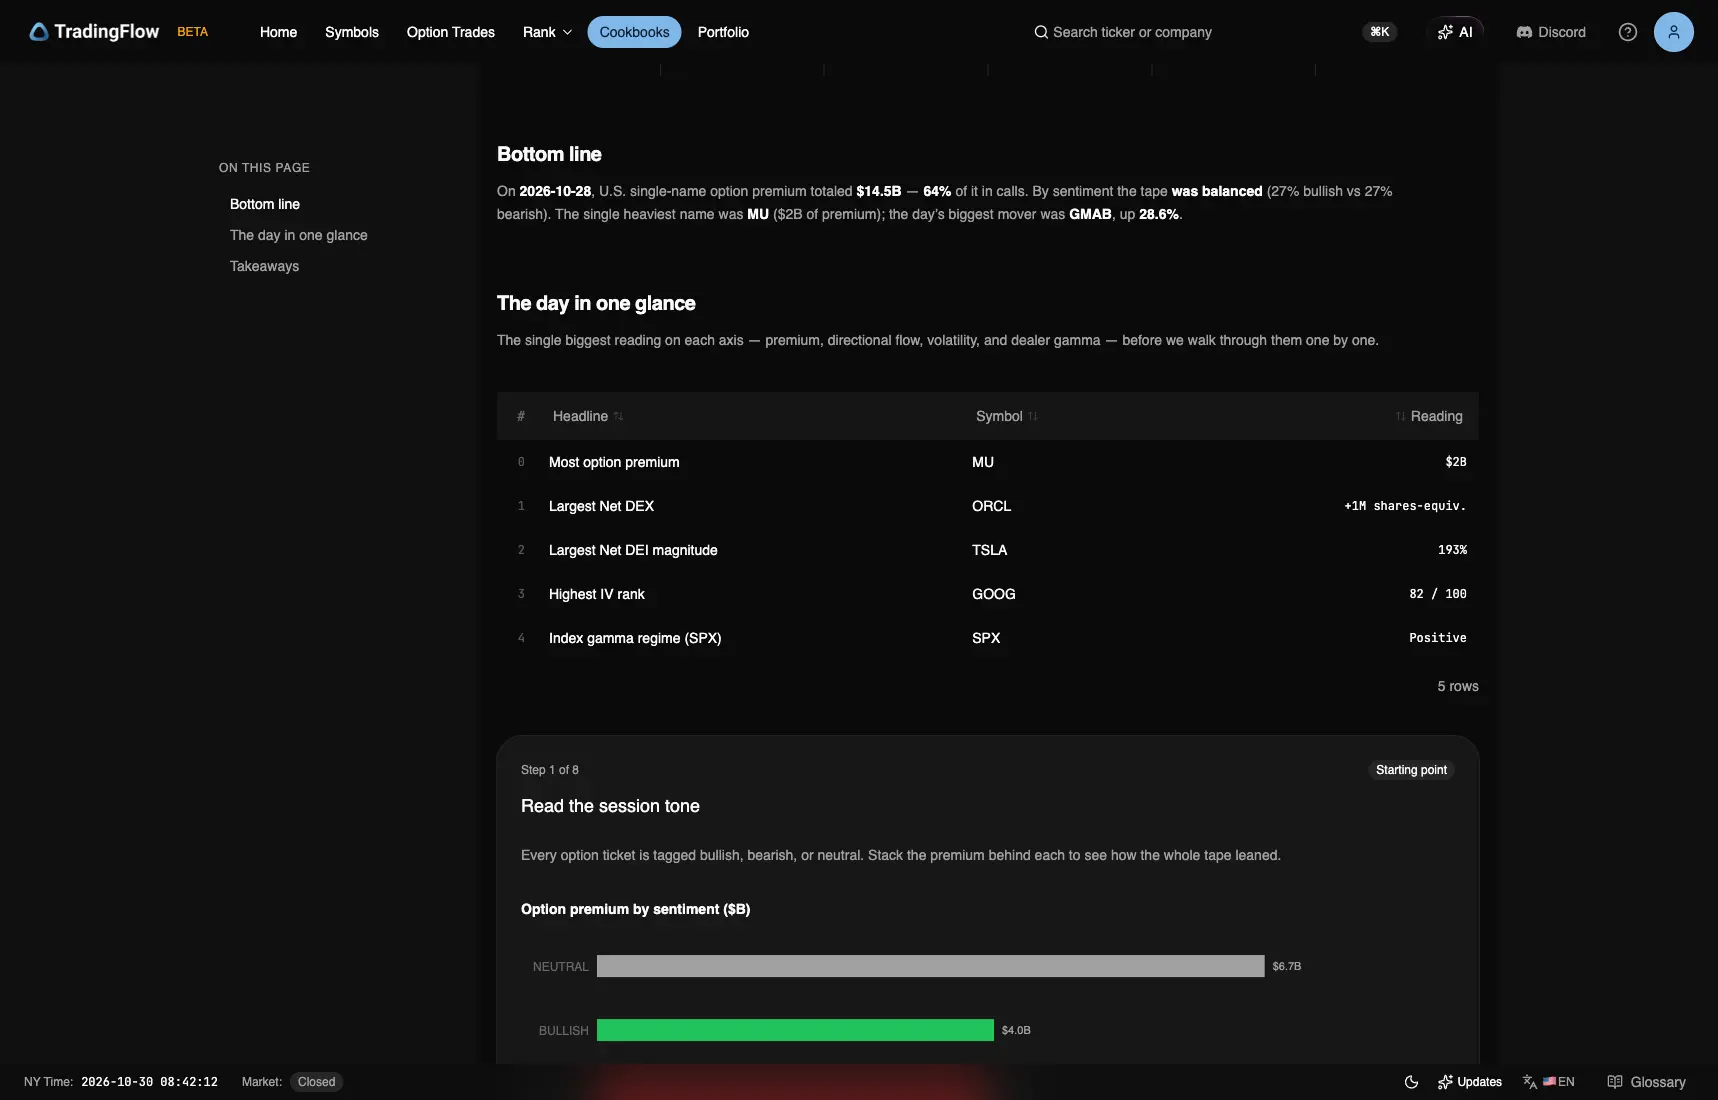
Test app, session 2026-10-28, Bottom line / glance. Captured October 30, 2026 (New York time).
Exposure and volatility context
The glance lists ORCL +1M shares-equiv. as largest Net DEX and TSLA 193% as largest Net DEI magnitude. Step 4 pairs TSLA's 193% with a Negative Net DEX sign; on October 27 the leader was BA at 204%.
Step 5's highest IV rank among active names is GOOG 82 / 100, with 42.6% 30-day implied volatility, against AMZN's 69 / 100 and 43.8% on October 27.
Index GEX: SPX +22.53B, SPY and QQQ flip Negative
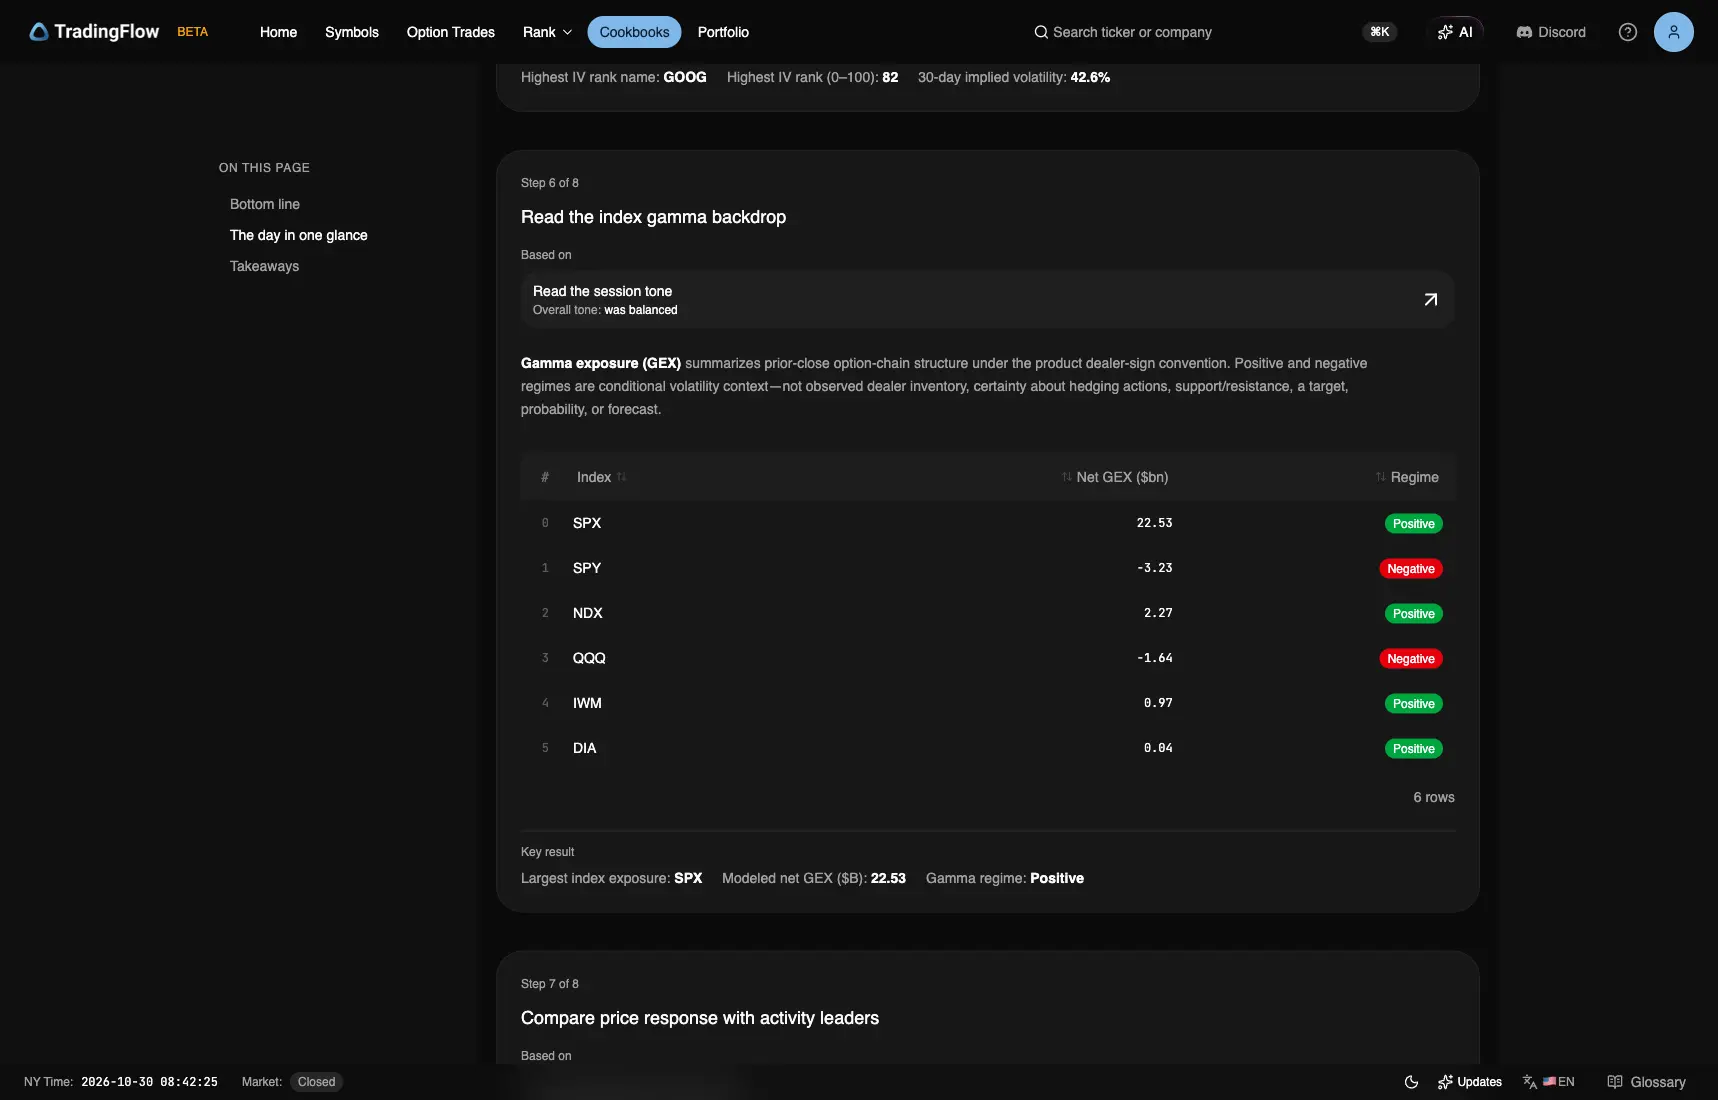
Test app, session 2026-10-28, Step 6 · T+1. Captured October 30, 2026 (New York time).
| Index | Net GEX ($B) | Regime |
|---|---|---|
| SPX | +22.53 | Positive |
| SPY | −3.23 | Negative |
| NDX | +2.27 | Positive |
| QQQ | −1.64 | Negative |
| IWM | +0.97 | Positive |
| DIA | +0.04 | Positive |
SPX rose 5.12B while two ETF rows went the other way: SPY fell from +3.81 to −3.23 and QQQ from +1.5 to −1.64. NDX narrowed from +13.67 to +2.27, IWM eased from +1.13 to +0.97, and DIA rose from 0 to +0.04.
Headline name: MU at $978
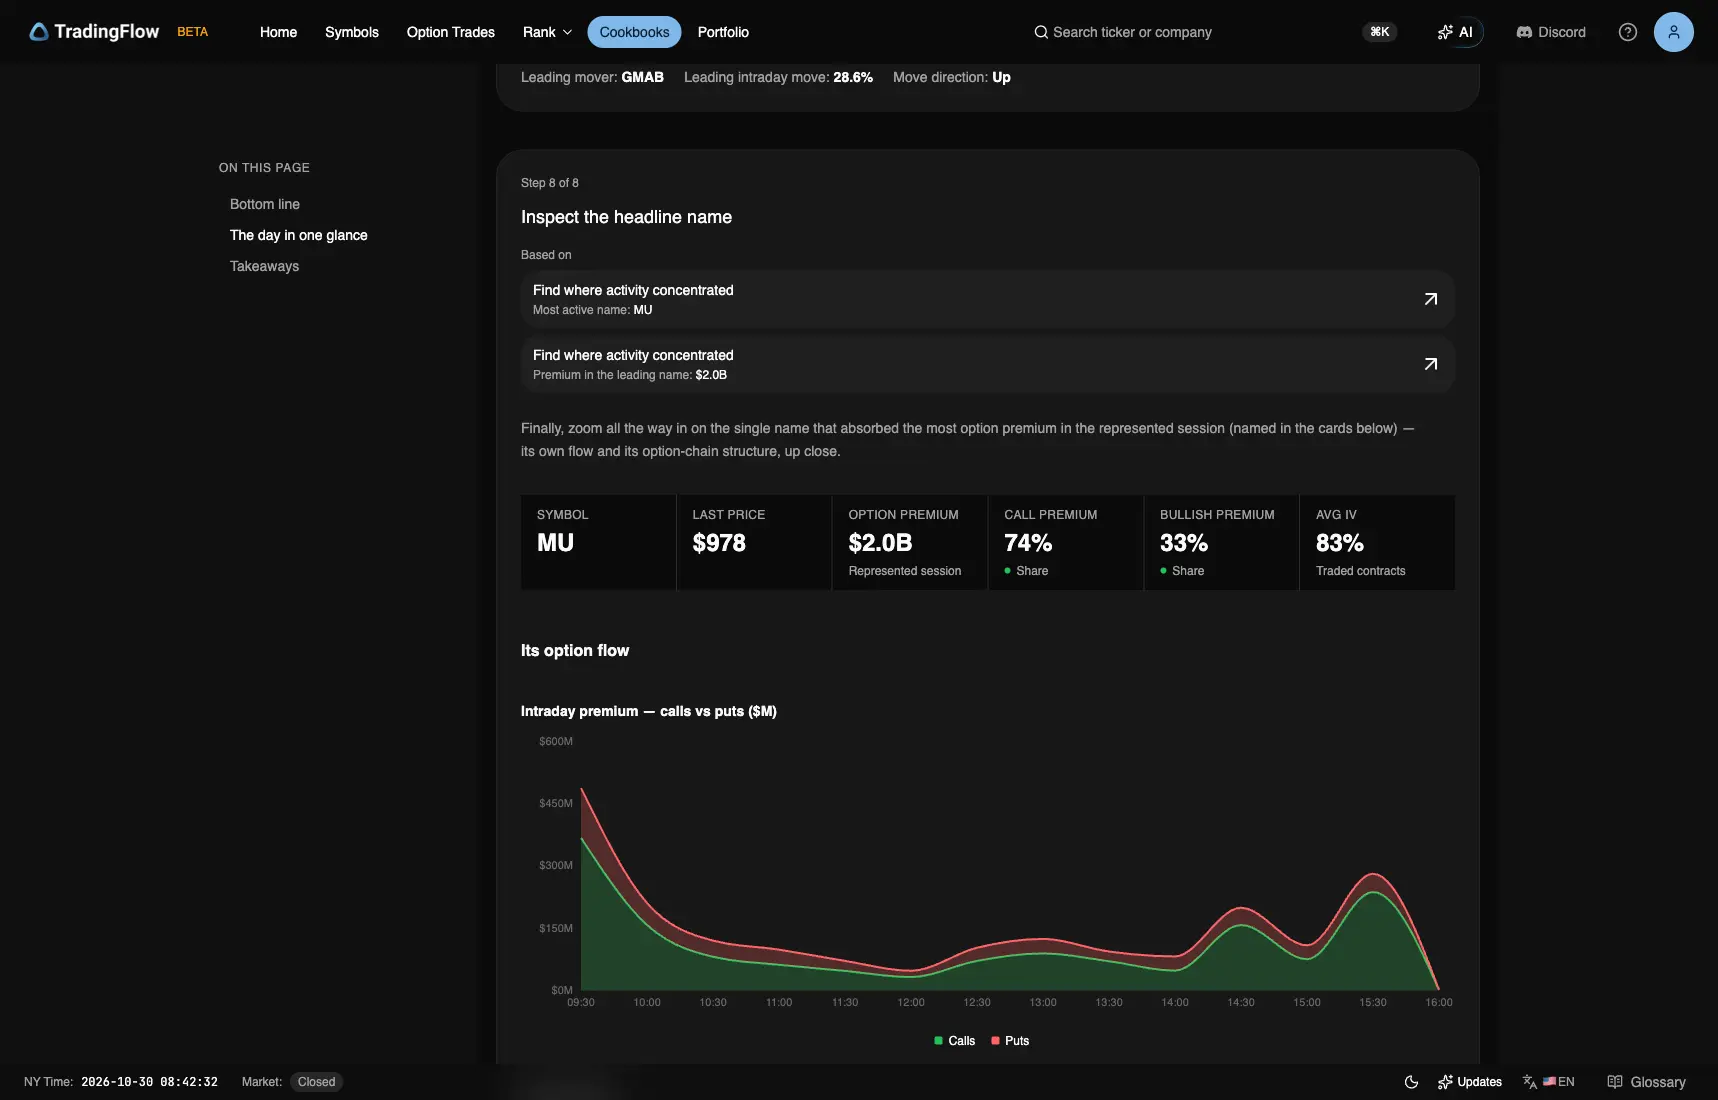
Test app, session 2026-10-28, Step 8. Captured October 30, 2026 (New York time).
Cards: last $978, premium $2.0B, 74% calls, 33% bullish, 83% average IV on traded contracts. On October 27 the headline name was TSLA.
| Time | Type | Strike | Expiry | Premium | Sentiment |
|---|---|---|---|---|---|
| 15:52 | CALL | 980 | 2026-11-20 | $41M | BEARISH |
| 15:52 | CALL | 1,250 | 2027-02-19 | $30M | NEUTRAL |
| 09:36 | CALL | 950 | 2026-10-30 | $20M | BEARISH |
| 14:36 | CALL | 900 | 2027-01-15 | $10M | BEARISH |
| 15:52 | CALL | 1,550 | 2027-02-19 | $9M | NEUTRAL |
| 09:55 | CALL | 1,280 | 2027-12-17 | $9M | BEARISH |
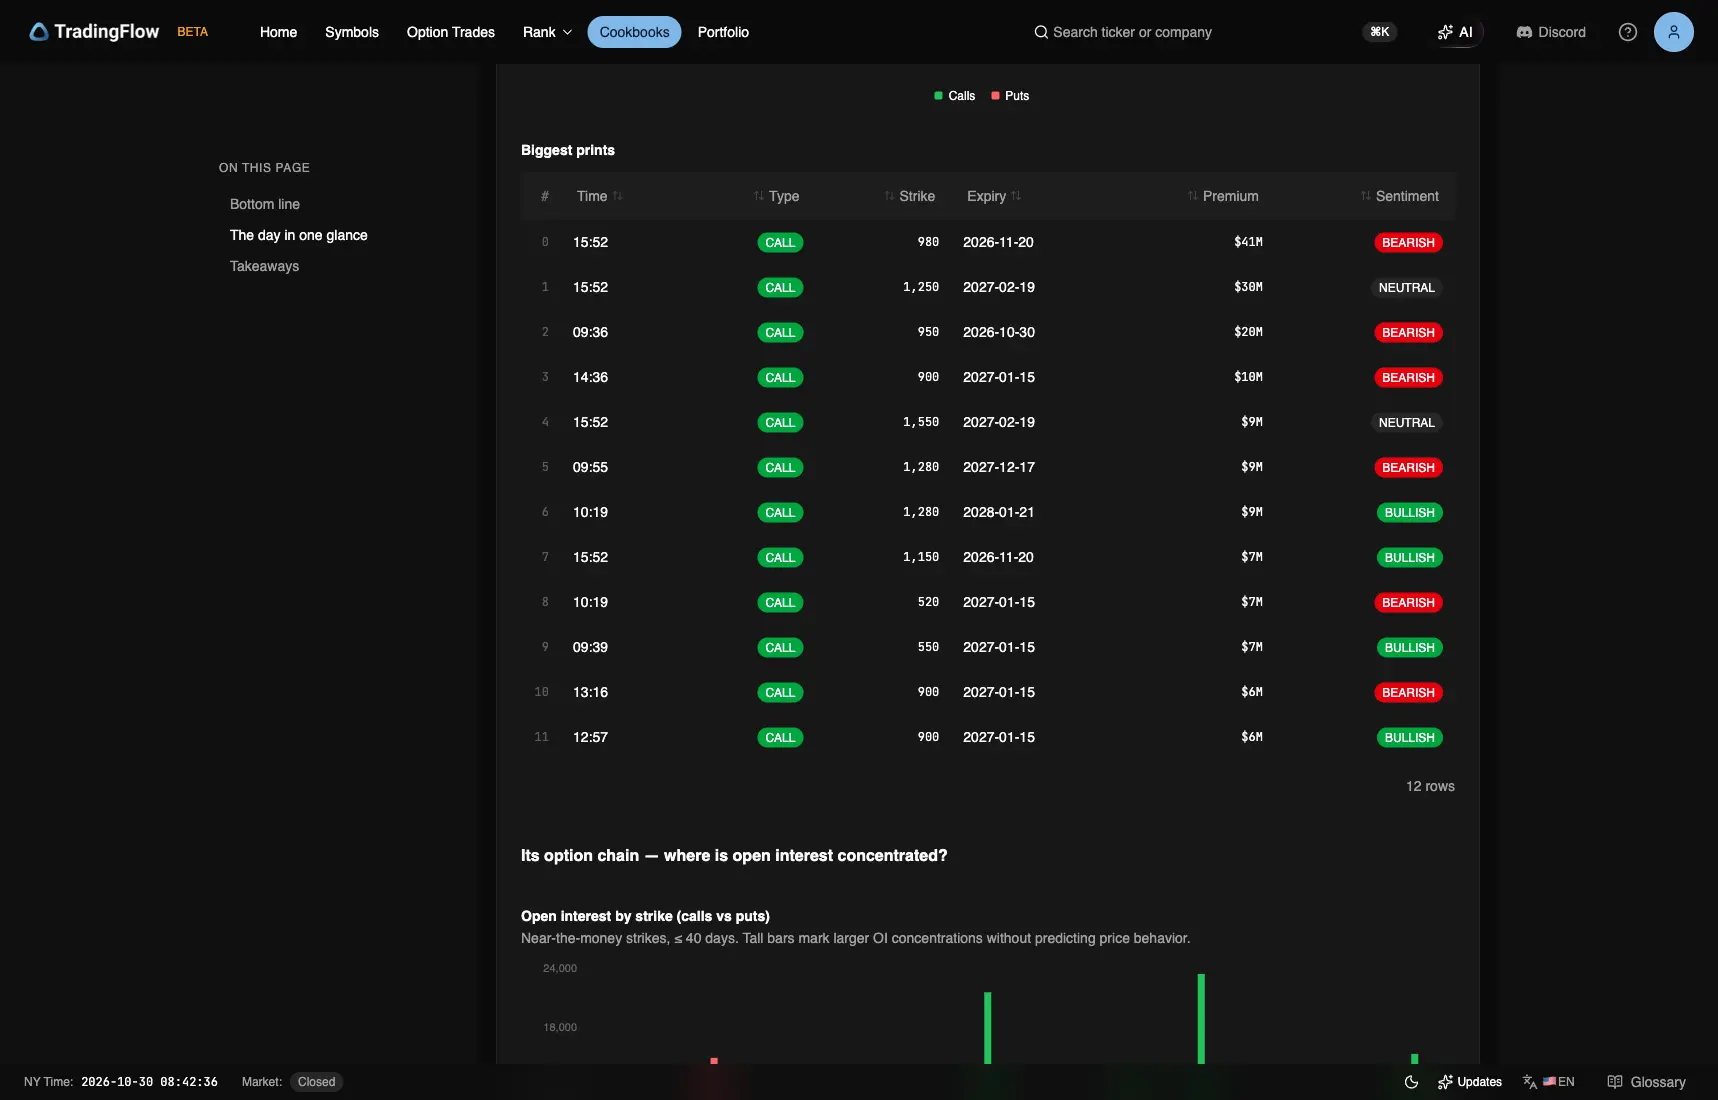
Test app, session 2026-10-28, Step 8 · prints. Captured October 30, 2026 (New York time).
All six of MU's largest tickets were calls. The largest was a $41M 980 call expiring 2026-11-20, tagged Bearish, one of three MU tickets printed at 15:52 that came to $80M together. A $20M 950 call expiring 2026-10-30 printed at 09:36.
Movers: GMAB +28.6%
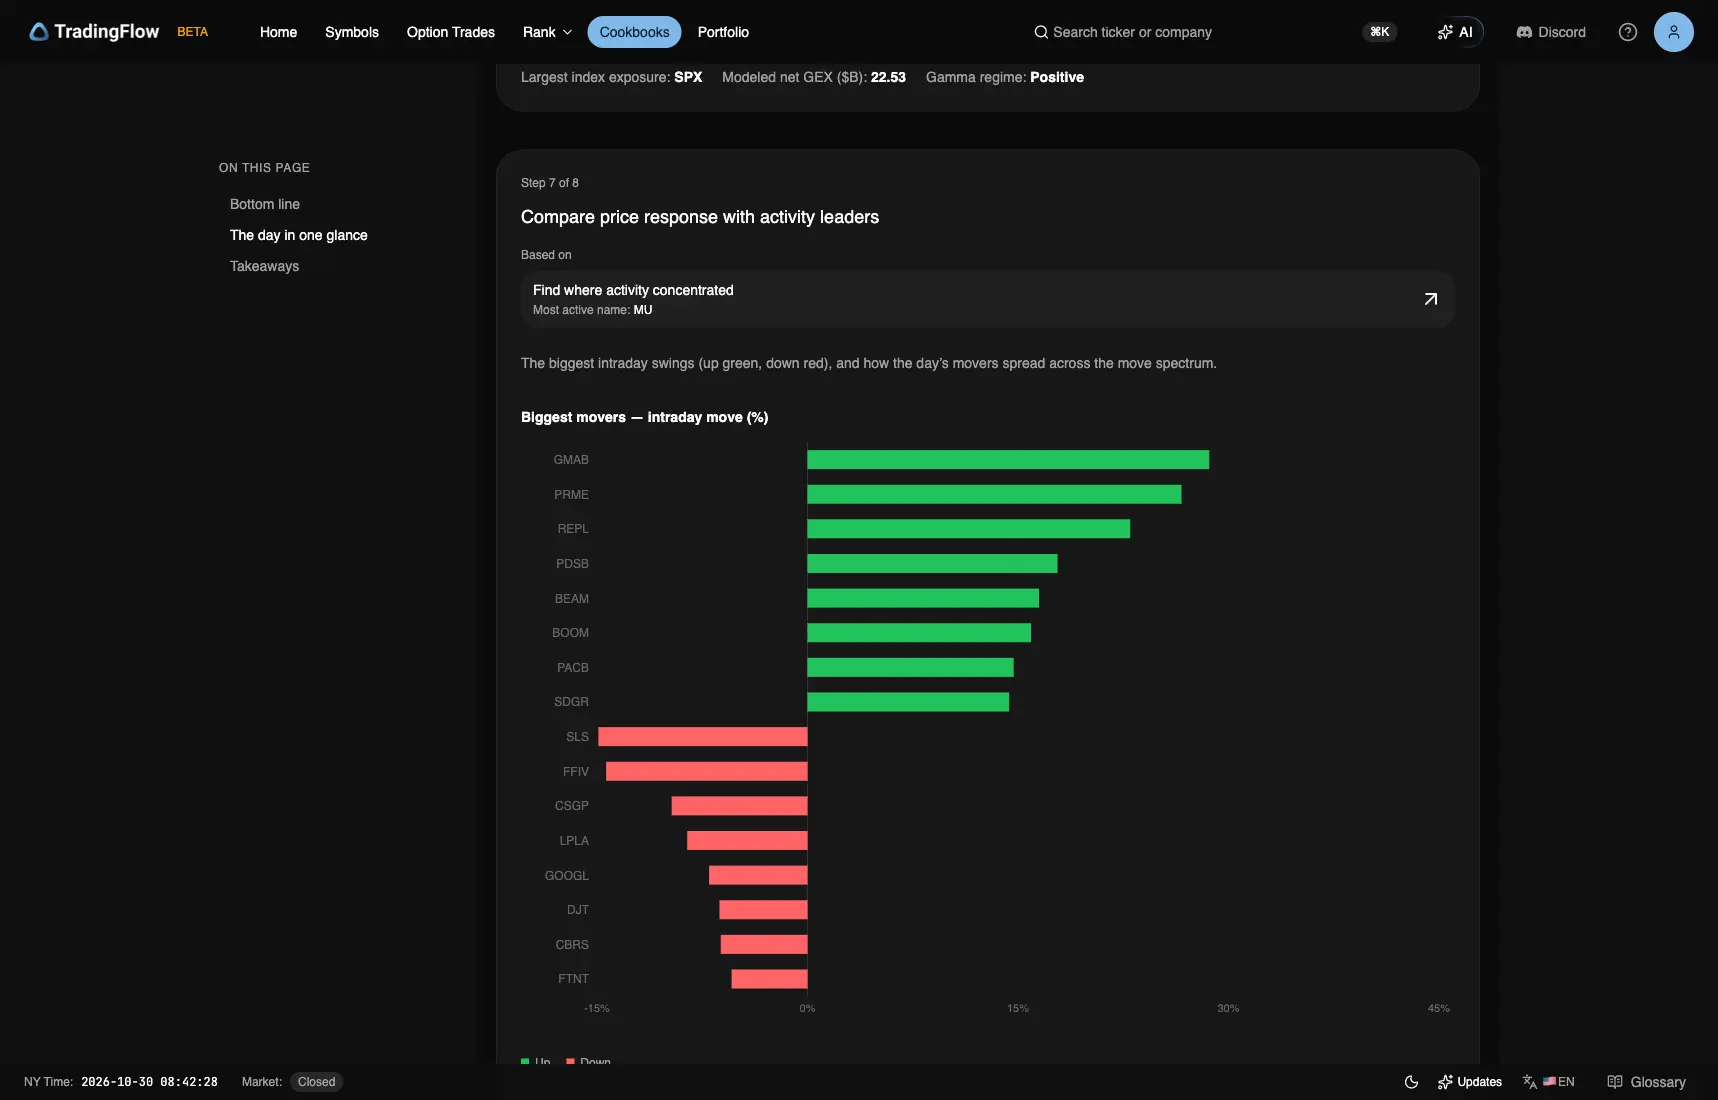
Test app, session 2026-10-28, Step 7. Captured October 30, 2026 (New York time).
The largest gain was GMAB +28.6% (Step 7: 28.6%, Up). October 27's was ENVX, +23.8% in the bottom line and 23.9% in Step 7.
What this session is evidence of
| Question | Oct 28 | Oct 27 | Clock |
|---|---|---|---|
| MU's 15:52 roll | 980C/1,150C Nov against 1,250C/1,550C Feb, ~$13M apart | — | Session tape |
| META December 800 puts | Three tickets, $22.89M, all Bearish | — | Session tape |
| Size / tone | $14.5B · 27% / 27% · was balanced | $14.7B · 26% / 24% · leaned bullish | Session tape |
| Concentration | MU $2.0B Mixed | TSLA $1.3B Bullish | Session leaders |
| Relative exposure | TSLA DEI 193% · DEX Negative | BA DEI 204% · DEX Negative | Session exposure |
| Volatility | GOOG IV rank 82 · IV 42.6% | AMZN IV rank 69 · IV 43.8% | T+1 |
| Index structure | SPX +22.53B Positive · NDX, IWM, DIA Positive | SPX +17.41B Positive · NDX, SPY, QQQ, IWM, DIA Positive | T+1 |
| Largest headline-name print | MU 980 CALL 2026-11-20 $41M BEARISH | Two TSLA 240 CALLs at $9M, NEUTRAL | Session ticket |
How to read these numbers
This edition reads TradingFlow's Daily Market Recap for October 28, 2026, captured on October 30 (New York time). Two runs a minute apart printed the same figures. It is a completed-session report, not a trade recommendation.
Two clocks apply. Premium, sentiment, and prints describe the session tape; GEX and IV are the recap's T+1 / prior-close snapshots, not a live intraday gamma map. Neutral premium supplies no direction, and call share is option type, not bullish sentiment. Net DEI is an unsigned magnitude relative to typical activity; Net DEX is a separate signed classification, and a +0M reading rounds to zero. GEX is modeled chain structure under TradingFlow's dealer-sign convention, not observed dealer inventory, a support level, or the next session's direction. Ticket tags do not prove who bought or sold or whether a position opened, and intraday_pct is a first-to-last underlying-price proxy from the option tape, not a verified daily return.
The Symbols page sums every expiration of one root, while the recap's index GEX table reads the regime scope (SPX with its SPXW weekly root, 0–7 days to expiry, strikes near spot), so their net GEX figures differ. On the Symbols page the walls, flip and magnet are the session's T+1 / prior-close structure, and the open, high, low and close are the session's daily bar. A ticket's feed tag reads the quote side: Bullish is a call bought at the ask or a put sold at the bid, Bearish the reverse.
Reproduce the findings
- Open the October 28 recap; confirm Oct 28, 2026 in the session KPI.
- Open the October 27 recap beside it and compare the KPI strip, leaders, and all six index GEX rows.
- Compare the headline name's cards and largest tickets on both days: MU on October 28, TSLA on October 27.
- Read Steps 4–6 separately: exposure magnitude, volatility rank, and index structure.
- Open Biggest Options Trades for October 28 and find MU's 15:52 calls and META's three 800 puts; the recap's Step 8 lists MU's 1,150 call.
TradingFlow App Home → Cookbooks → Daily Market Recap → select the completed session.
Related reading
Educational and informational only, not financial advice. Options-flow reads are statistical inferences. Dealer exposure levels, including GEX, DEX, DEI, walls, and magnets, are modeled estimates, not guarantees.
Related Articles
November 18 Recap: NVDA Moved 2.9% After Its Report, Well Inside What Its Options Priced
$18.5B in single-name premium, 19% bullish versus 19% bearish. NVDA led at $2.6B Mixed; SPX GEX was −$55.74B.
November 17 Recap: SPX's Low Ran 44 Points Under the Range Monday's Chain Priced
$18.5B in single-name premium, 23% bullish versus 21% bearish. MU led at $2.6B Bullish; SPX GEX was −$62.43B.
November 13 Recap: SPX Opens Above Its Gamma Flip and Closes 31 Points Under It
$19.3B in single-name premium, 23% bullish versus 21% bearish. NVDA led at $2.6B Mixed; SPX GEX was −$37.85B.