October 23 Recap: SPX GEX Deepens to −$73.74B as Premium Falls Back 43%
$14.7B in single-name premium, 25% bullish versus 25% bearish. MU led at $1.1B Bullish; SPX GEX was −$73.74B.

SPX net GEX deepened from −42.68B on October 22 to −73.74B on October 23, and every row except DIA moved further Negative. Single-name premium fell back 43%, from $25.7B to $14.7B, and the call share recovered from 41% to 54%.
$14.7B, 54% calls, 25% bullish versus 25% bearish. MU led at $1.1B Bullish; five of six index GEX rows were Negative.
Open Daily Market Recap or the October 23 session. Sign-in and a paid entitlement may be required.
This edition's figures in 45 seconds. The numbers match the tables below.
What the recap printed
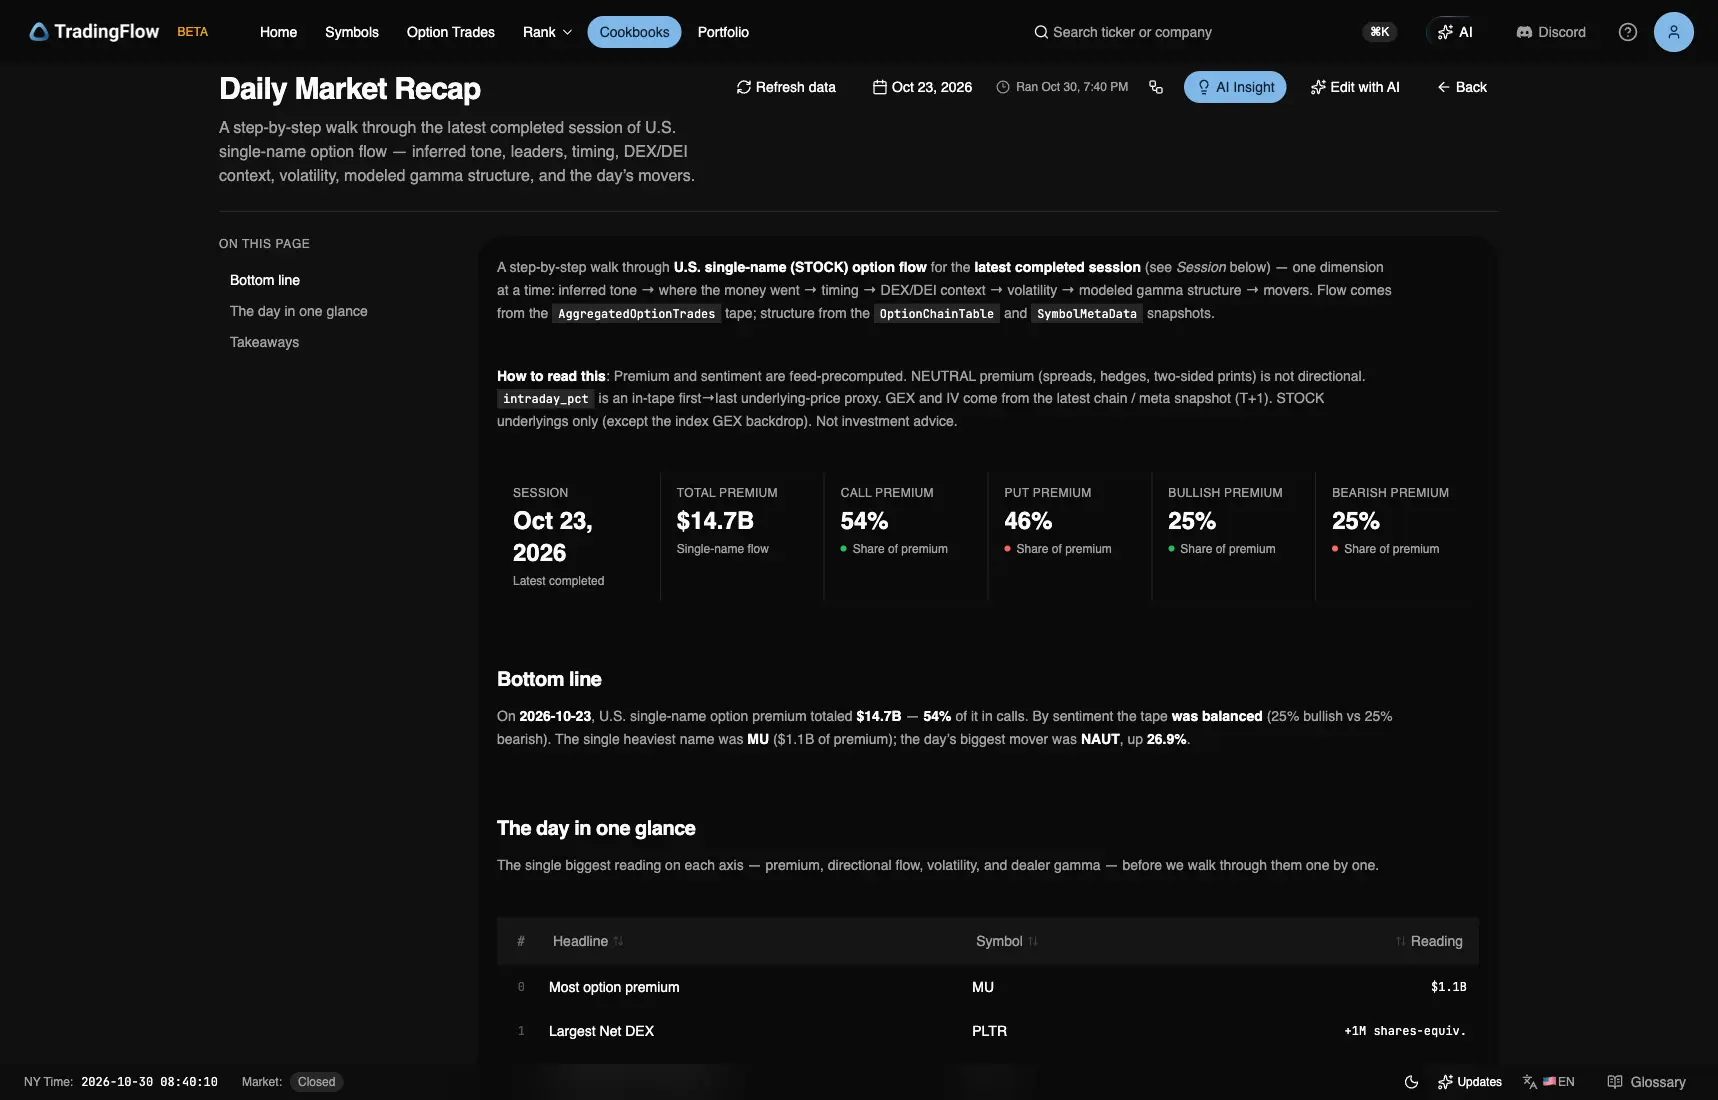
Test app, session 2026-10-23, KPI. Captured October 30, 2026 (New York time).
| Reading | Recap value |
|---|---|
| Single-name premium | $14.7B |
| Call / Put | 54% / 46% |
| Bullish / Bearish | 25% / 25% |
| Overall tone | was balanced |
| First 30-minute window | 09:30 · $2.4B |
Sentiment bars: Neutral $7.3B, Bearish $3.8B, Bullish $3.8B.
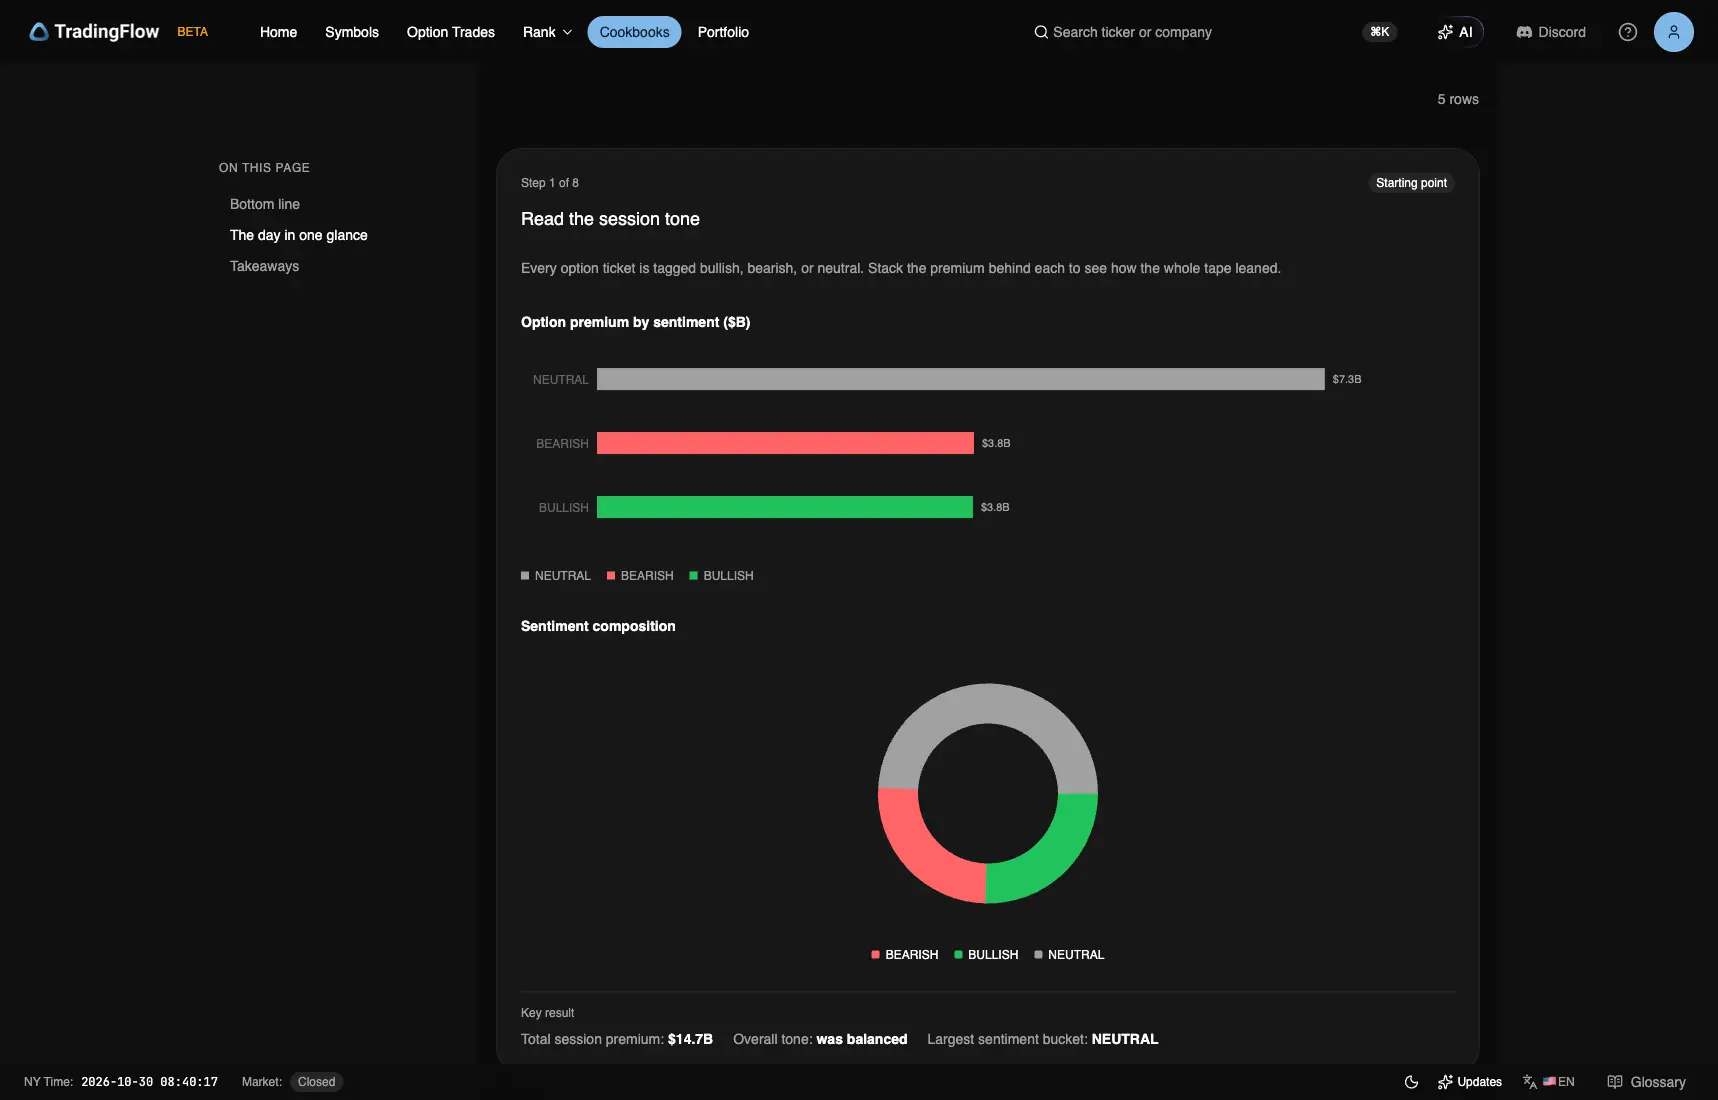
Test app, session 2026-10-23, Step 1. Captured October 30, 2026 (New York time).
What changed since October 22
| Reading | Oct 22 | Oct 23 |
|---|---|---|
| Single-name premium | $25.7B | $14.7B |
| Call / Put | 41% / 59% | 54% / 46% |
| Bullish / Bearish | 27% / 27% | 25% / 25% |
| Tone | was balanced | was balanced |
| Leader | MU $2.1B Mixed | MU $1.1B Bullish |
| SPX net GEX ($B) | −42.68 Negative | −73.74 Negative |
| Positive index rows | DIA | DIA |
| Largest headline-name ticket | MU 1,300 PUT 2026-11-20 $45M NEUTRAL | Three MU tickets at $5M |
The tone stayed balanced, with both directional shares two points lower. MU kept the lead on about half its October 22 premium, its tag moved from Mixed to Bullish, and its largest ticket fell from $45M to $5M.
Leaders: where premium concentrated
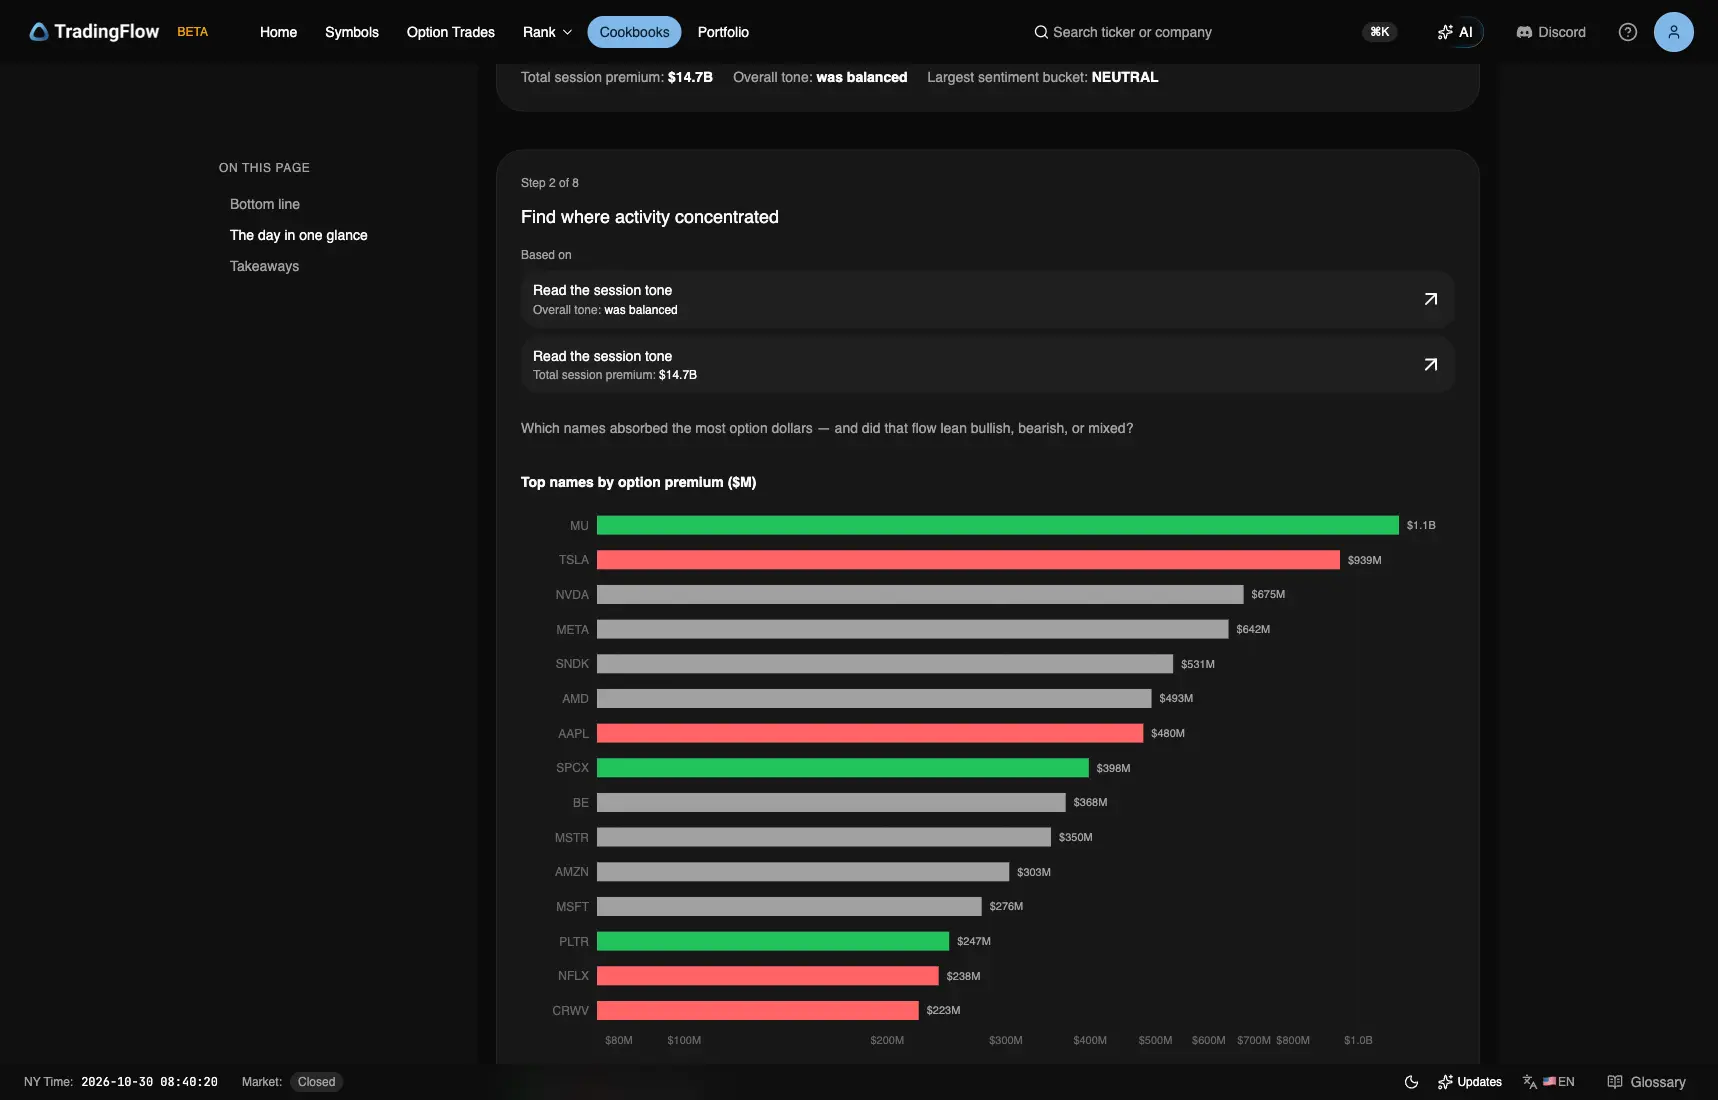
Test app, session 2026-10-23, Step 2. Captured October 30, 2026 (New York time).
| Symbol | Premium | Call | Put | Net bias |
|---|---|---|---|---|
| MU | $1.1B | $647M | $501M | Bullish |
| TSLA | $939M | $543M | $396M | Bearish |
| NVDA | $675M | $400M | $275M | Mixed |
| META | $642M | $365M | $276M | Mixed |
| SNDK | $531M | $243M | $288M | Mixed |
| AMD | $493M | $272M | $222M | Mixed |
MU was the only name above $1B, against all six on October 22. TSLA was the only Bearish name in the top six; META, AMD, and NVDA moved from Bearish to Mixed. SNDK, Bullish on October 22, was Mixed and the only top-six name with more put than call premium ($288M against $243M).
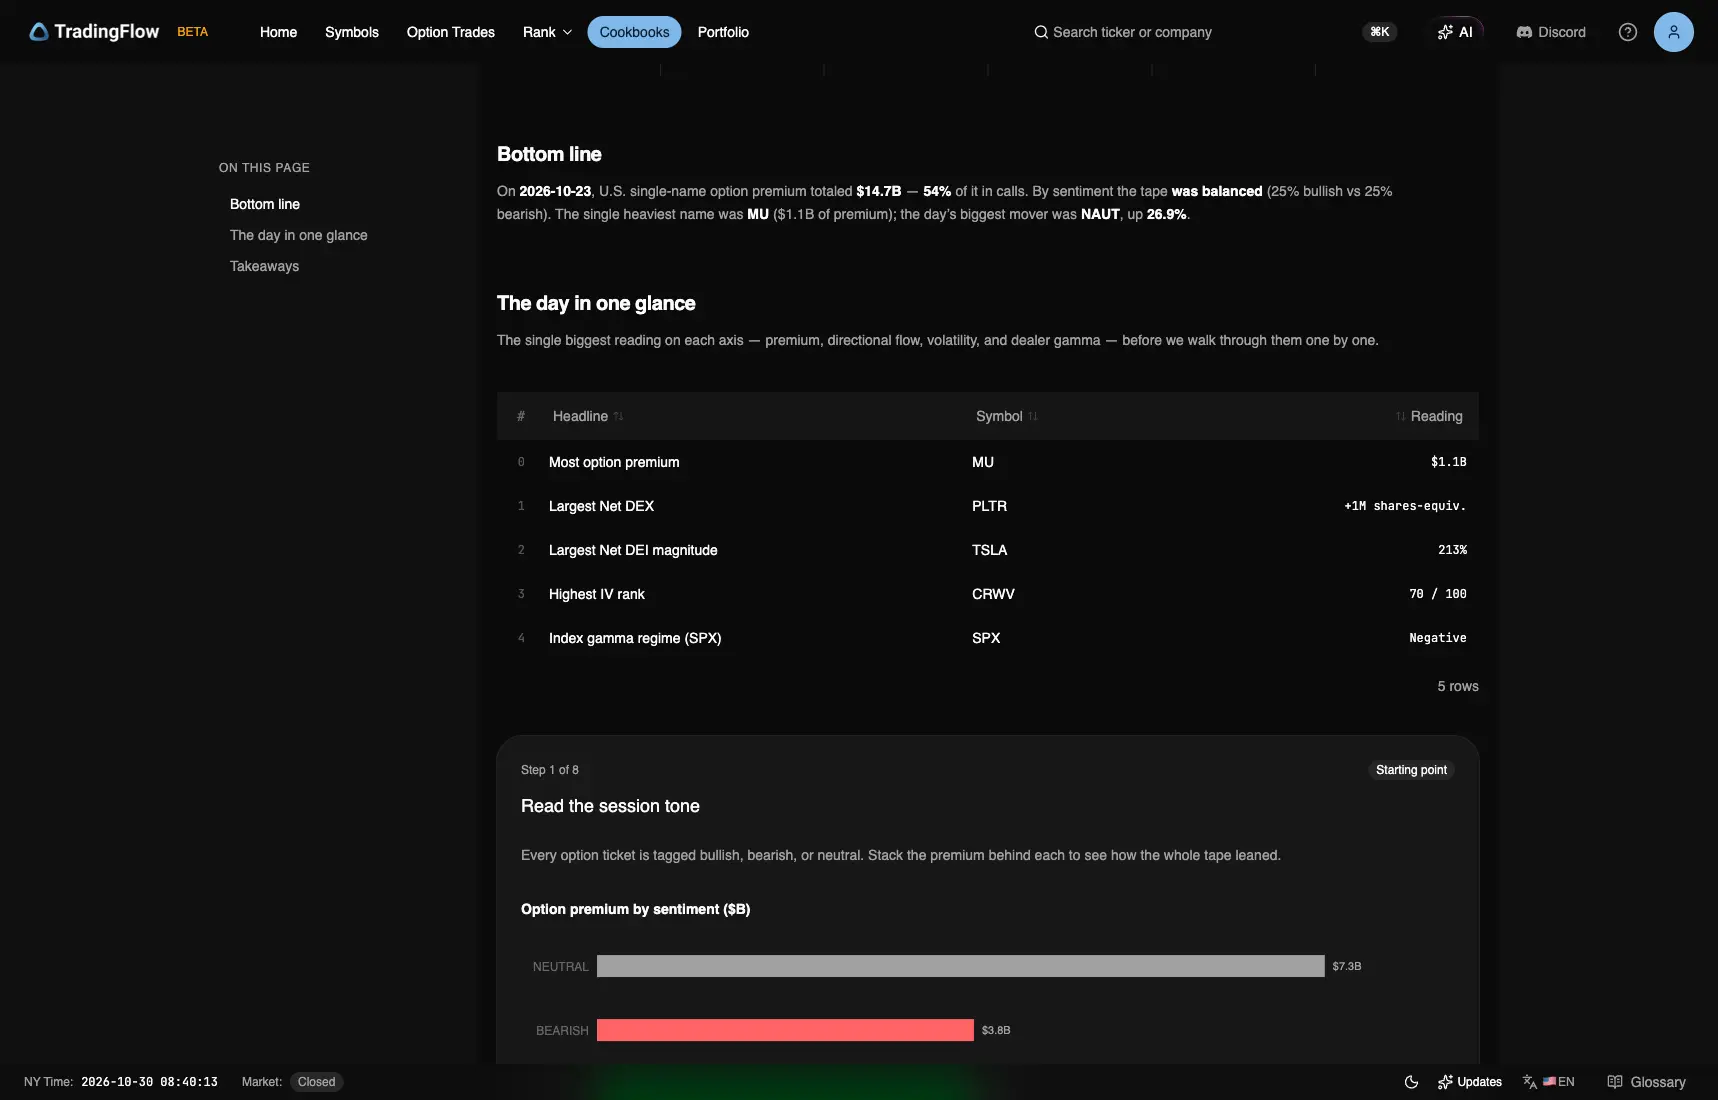
Test app, session 2026-10-23, Bottom line / glance. Captured October 30, 2026 (New York time).
Exposure and volatility context
The glance lists PLTR +1M shares-equiv. as largest Net DEX and TSLA 213% as largest Net DEI magnitude. Step 4 pairs TSLA's 213% with a Negative Net DEX sign; on October 22 the leader was PG at 167%.
Step 5's highest IV rank among active names is CRWV 70 / 100, with 109.0% 30-day implied volatility, against LRCX's 100 / 100 and 151.2% on October 22.
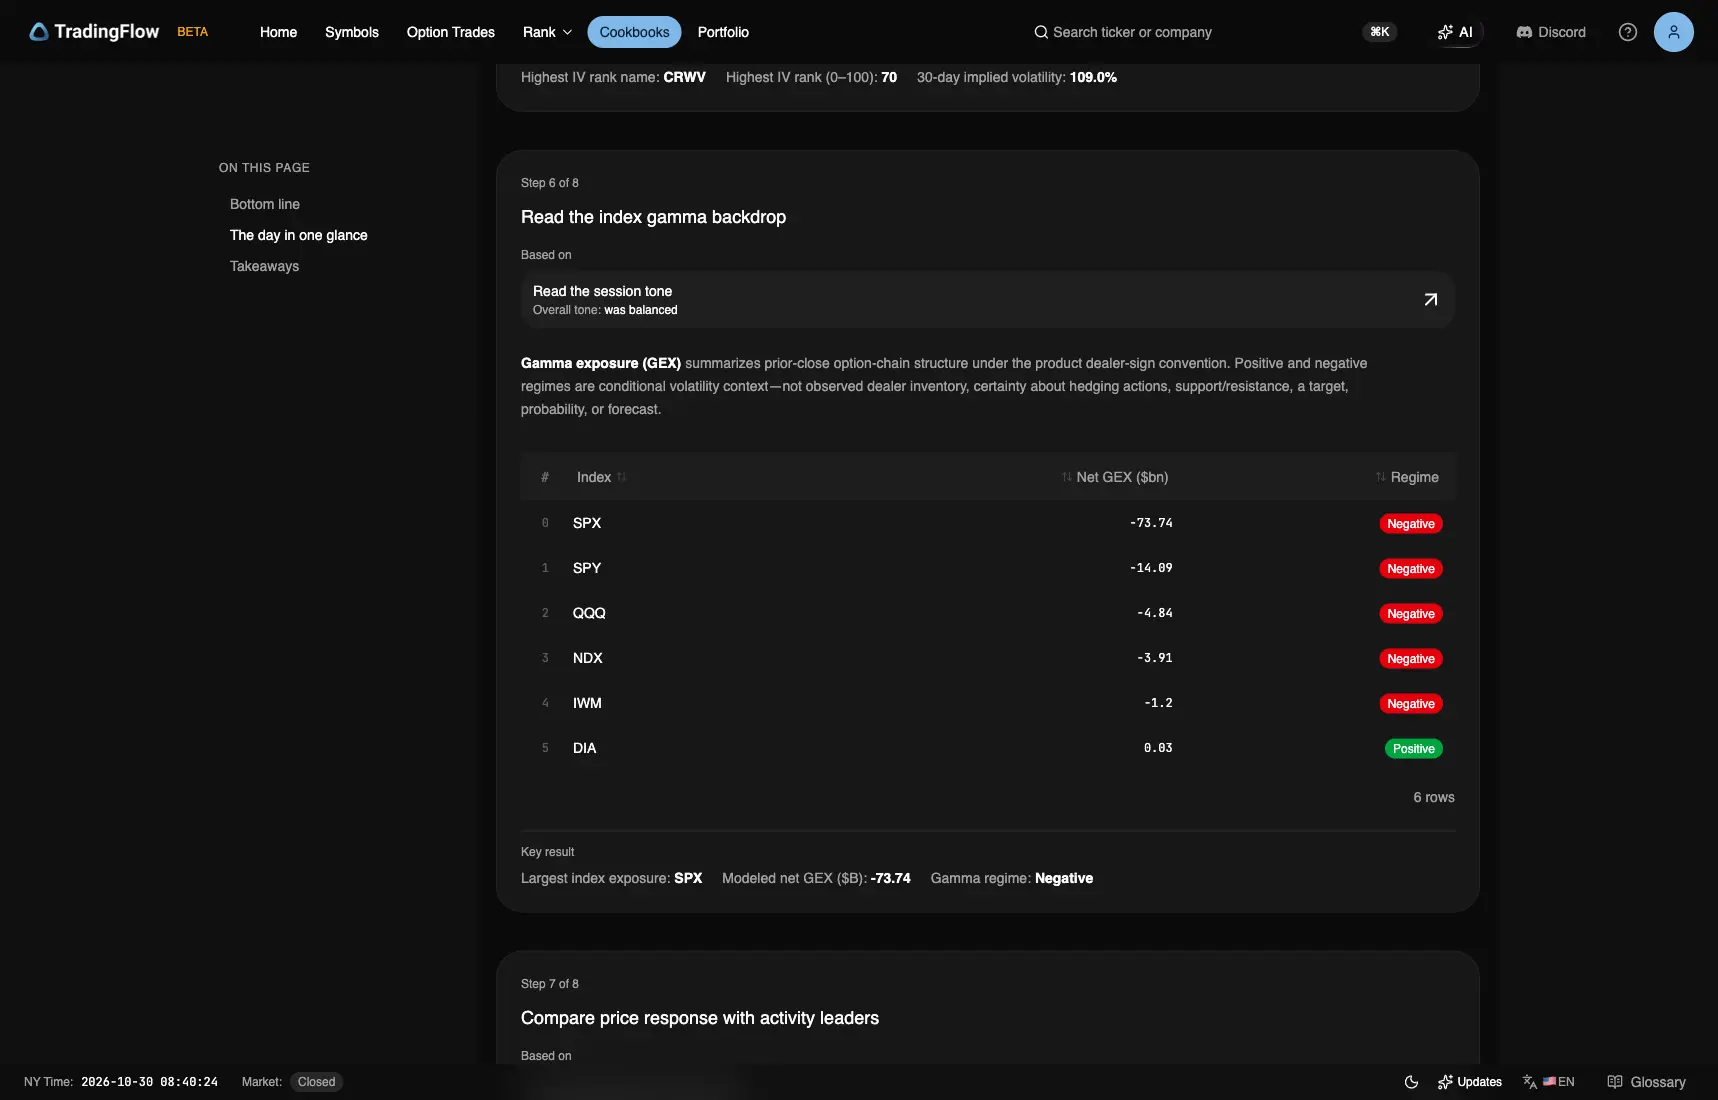
Index GEX: SPX deepens to −73.74B
Test app, session 2026-10-23, Step 6 · T+1. Captured October 30, 2026 (New York time).
| Index | Net GEX ($B) | Regime |
|---|---|---|
| SPX | −73.74 | Negative |
| SPY | −14.09 | Negative |
| QQQ | −4.84 | Negative |
| NDX | −3.91 | Negative |
| IWM | −1.2 | Negative |
| DIA | +0.03 | Positive |
SPX fell another 31.06B, from −42.68 to −73.74, and SPY went from −8 to −14.09. NDX (−1.44 to −3.91), QQQ (−4.12 to −4.84), and IWM (−0.02 to −1.2) also deepened; DIA stayed Positive at +0.03.
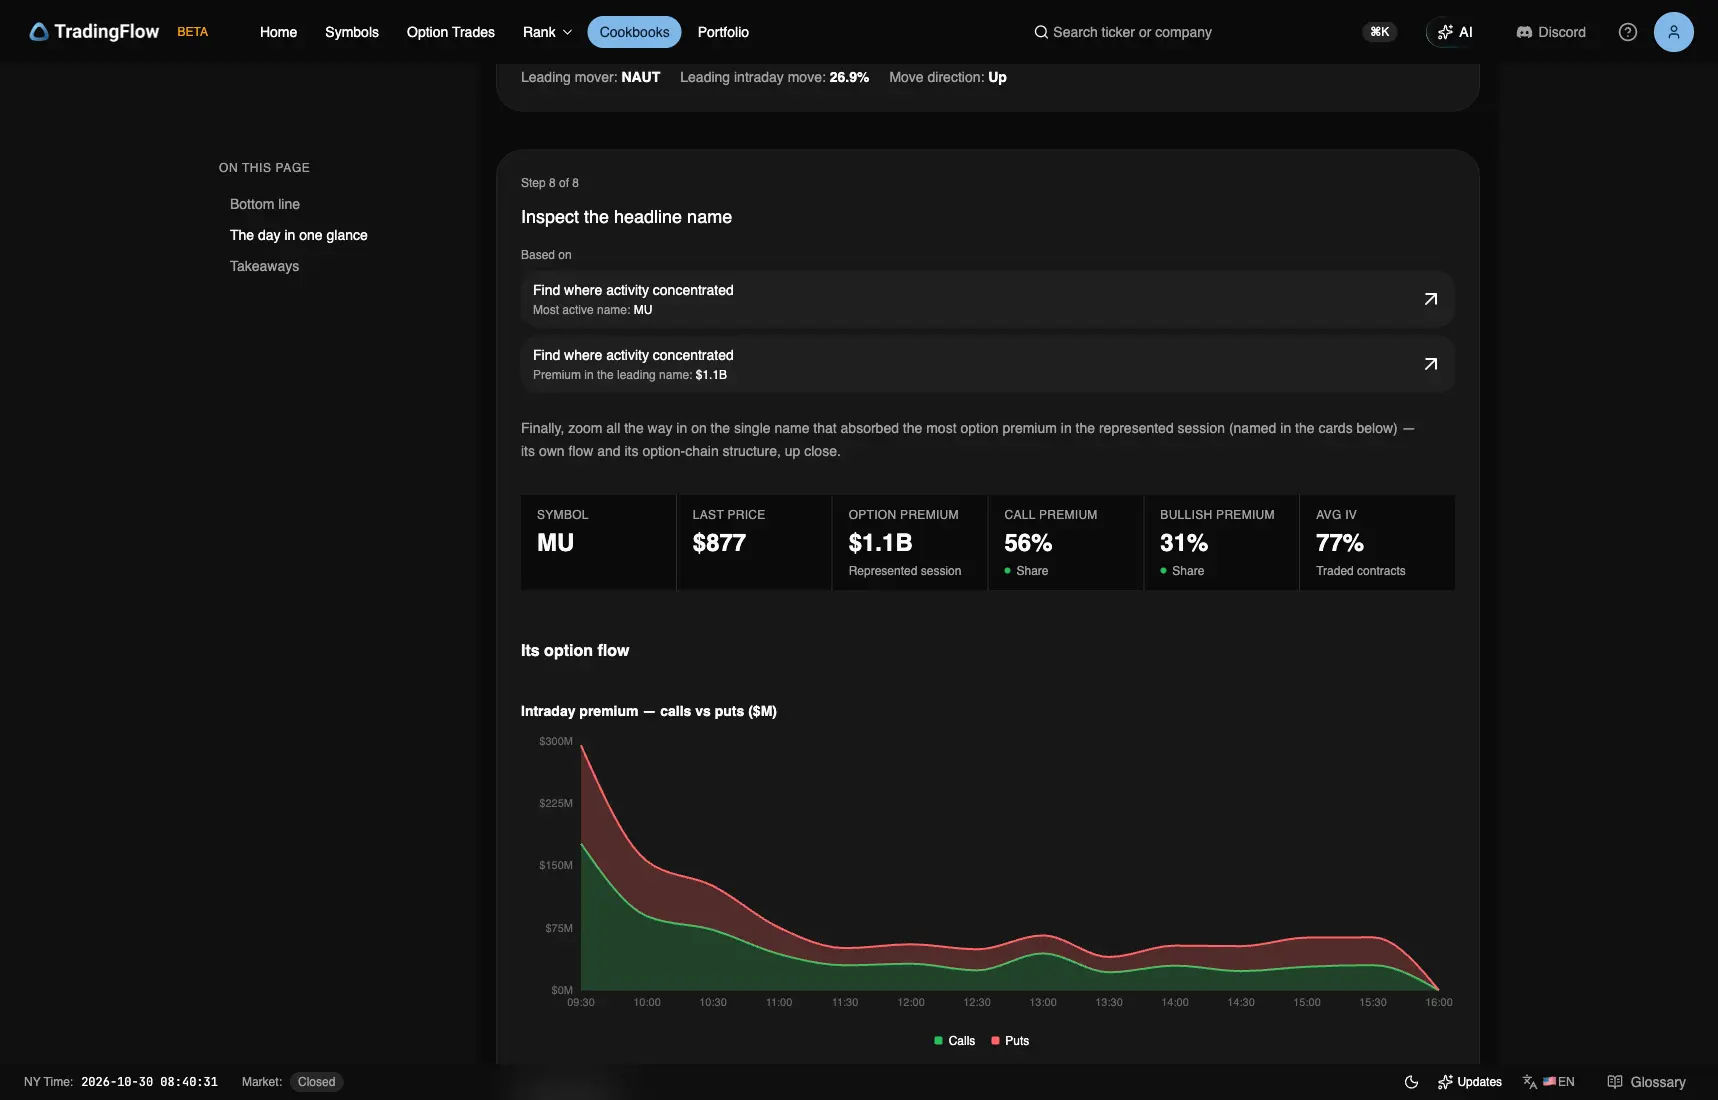
Headline name: MU at $877
Test app, session 2026-10-23, Step 8. Captured October 30, 2026 (New York time).
Cards: last $877, premium $1.1B, 56% calls, 31% bullish, 77% average IV on traded contracts. On October 22 the cards read $865, $2.1B, 46% calls, 27% bullish, and 68%.
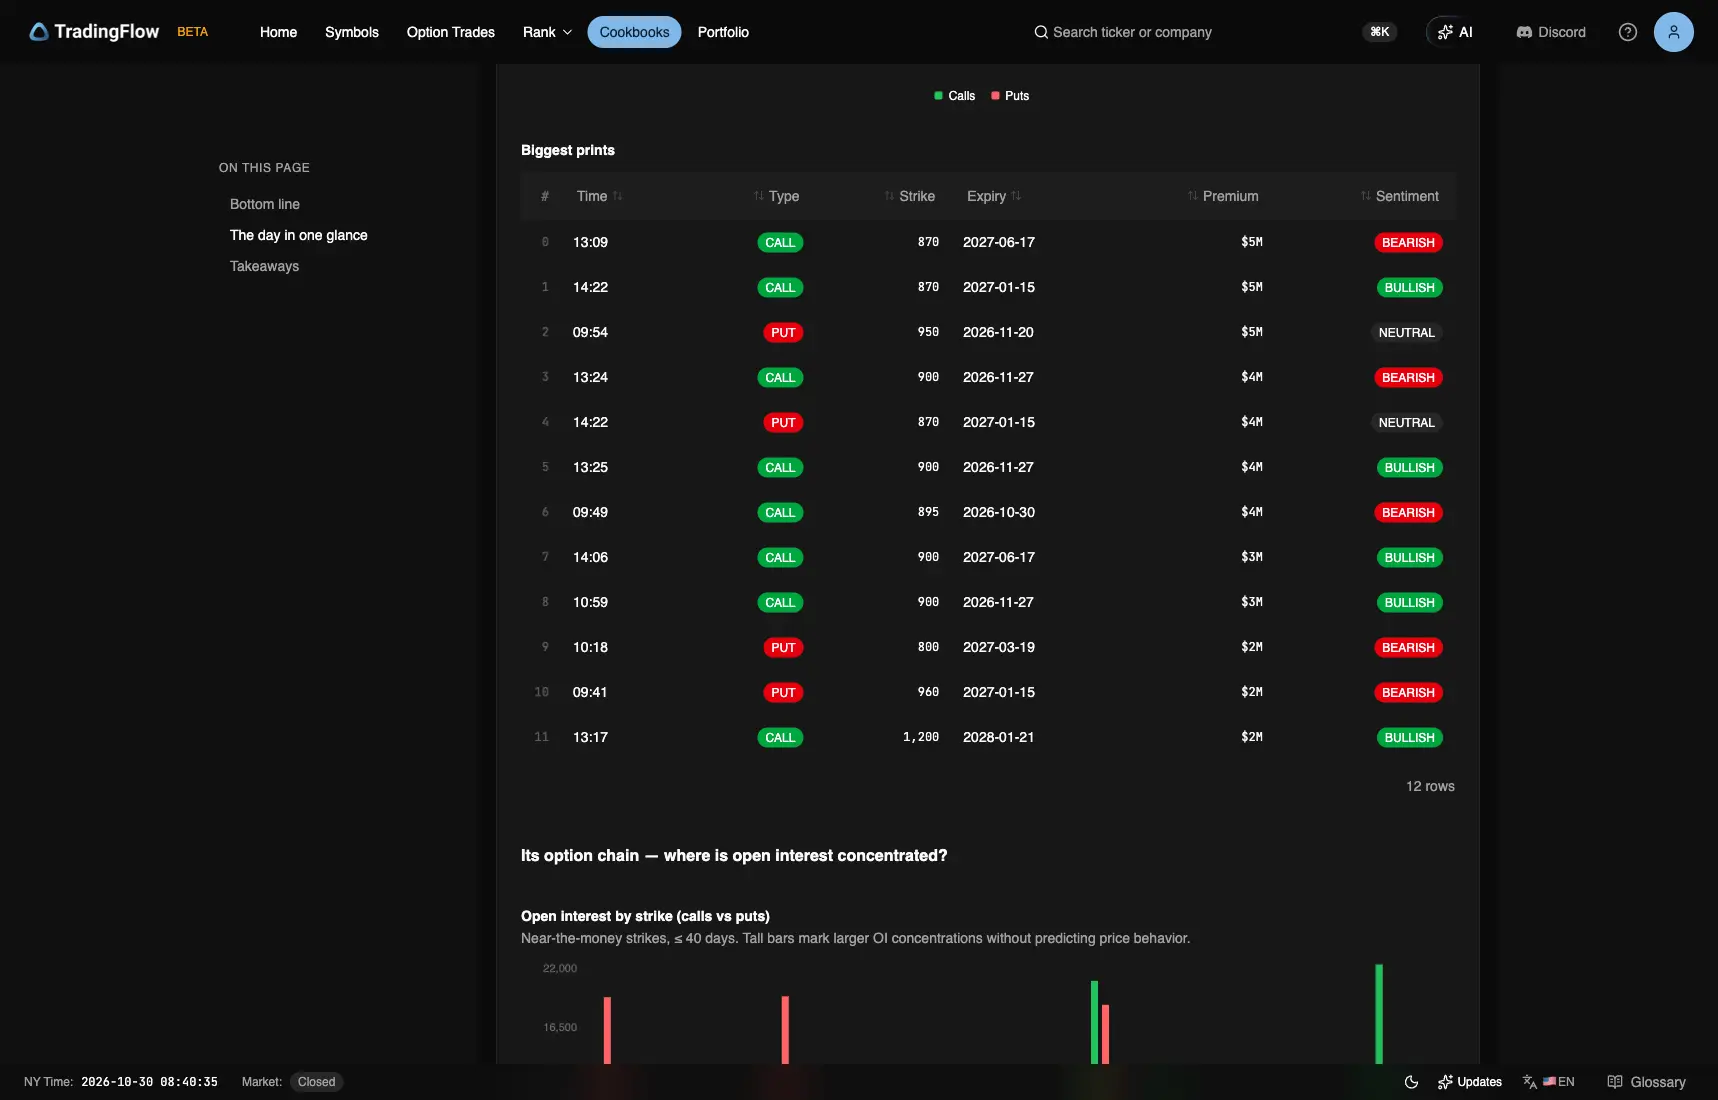
| Time | Type | Strike | Expiry | Premium | Sentiment |
|---|---|---|---|---|---|
| 13:09 | CALL | 870 | 2027-06-17 | $5M | BEARISH |
| 14:22 | CALL | 870 | 2027-01-15 | $5M | BULLISH |
| 09:54 | PUT | 950 | 2026-11-20 | $5M | NEUTRAL |
| 13:24 | CALL | 900 | 2026-11-27 | $4M | BEARISH |
| 14:22 | PUT | 870 | 2027-01-15 | $4M | NEUTRAL |
| 13:25 | CALL | 900 | 2026-11-27 | $4M | BULLISH |
Test app, session 2026-10-23, Step 8 · prints. Captured October 30, 2026 (New York time).
Three MU tickets tied for largest at $5M: an 870 call expiring 2027-06-17 (Bearish), an 870 call expiring 2027-01-15 (Bullish), and a 950 put expiring 2026-11-20 (Neutral). On October 22 the largest was a $45M 1,300 put.
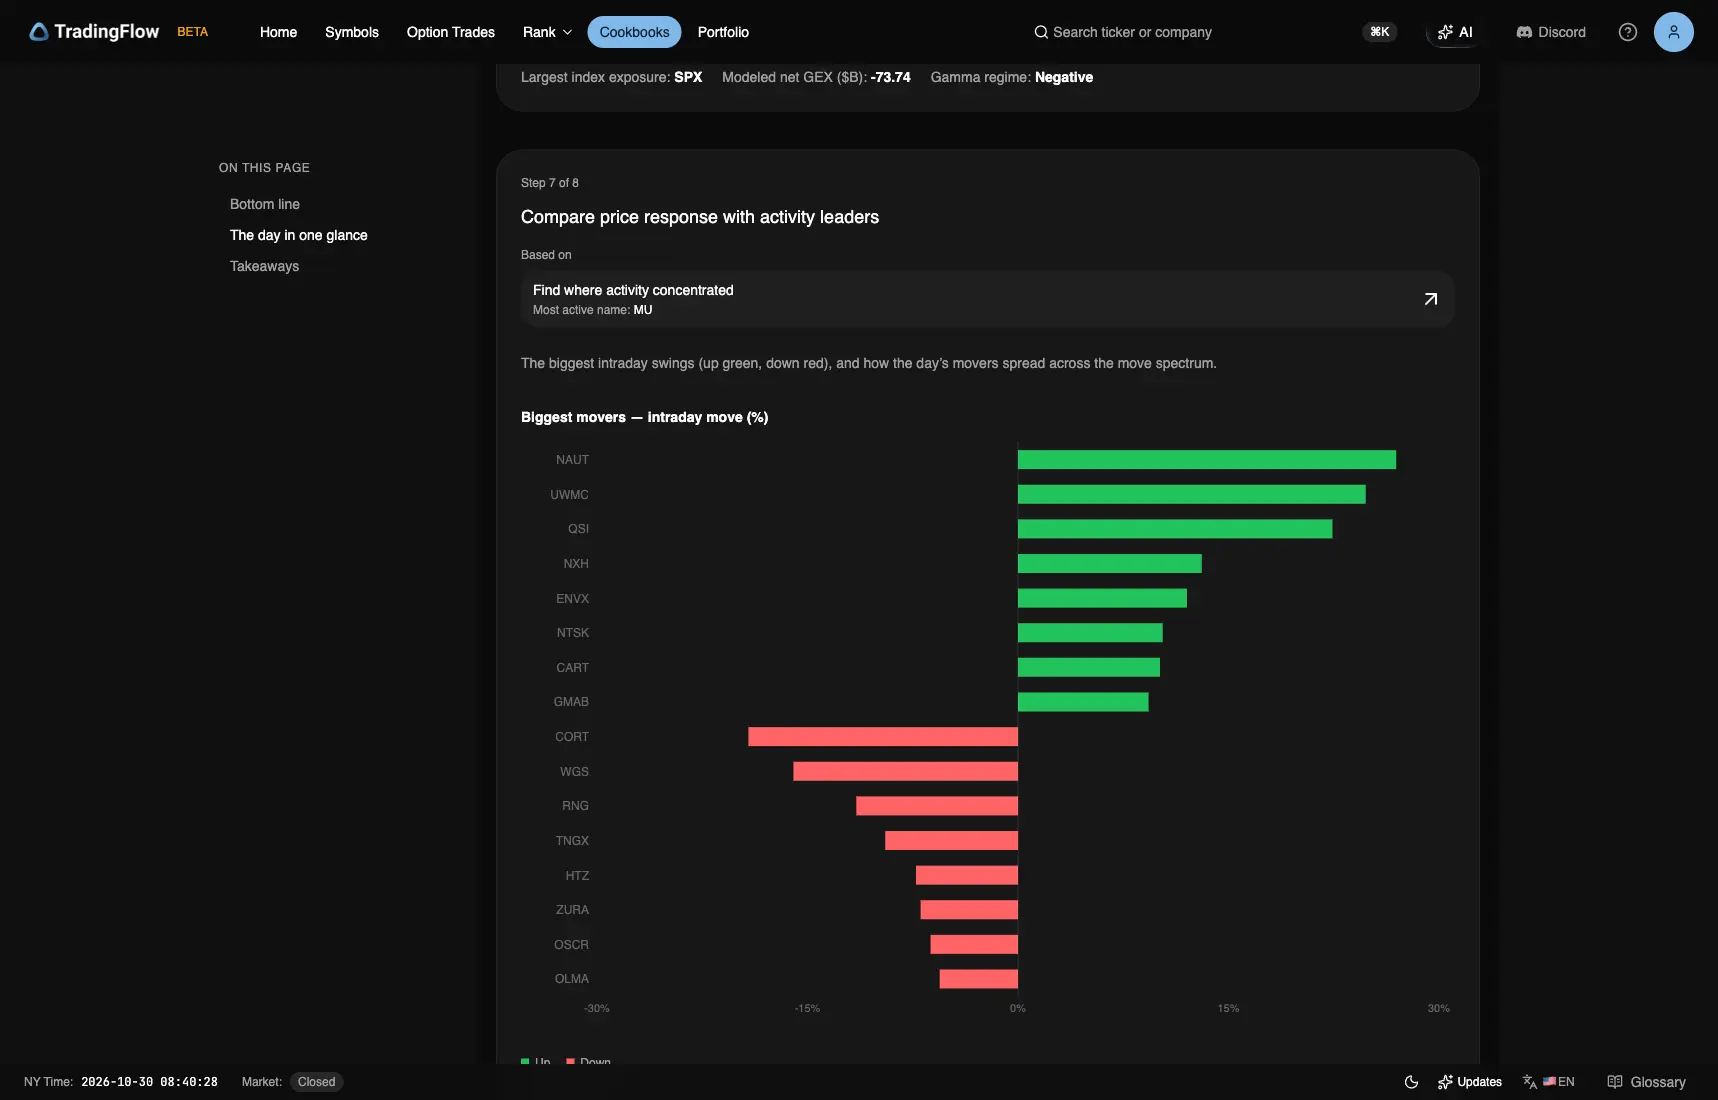
Movers: NAUT +26.9%
Test app, session 2026-10-23, Step 7. Captured October 30, 2026 (New York time).
The largest gain was NAUT +26.9% (Step 7: 26.9%, Up). October 22's was POOL, +12% in the bottom line and 12.1% in Step 7.
What this session is evidence of
| Question | Oct 23 | Oct 22 | Clock |
|---|---|---|---|
| Size / tone | $14.7B · 25% / 25% · was balanced | $25.7B · 27% / 27% · was balanced | Session tape |
| Concentration | MU $1.1B Bullish | MU $2.1B Mixed | Session leaders |
| Relative exposure | TSLA DEI 213% · DEX Negative | PG DEI 167% · DEX Positive | Session exposure |
| Volatility | CRWV IV rank 70 · IV 109.0% | LRCX IV rank 100 · IV 151.2% | T+1 |
| Index structure | SPX −73.74B Negative · DIA Positive | SPX −42.68B Negative · DIA Positive | T+1 |
| Largest headline-name print | Three MU tickets at $5M | MU 1,300 PUT 2026-11-20 $45M NEUTRAL | Session ticket |
How to read these numbers
This edition reads TradingFlow's Daily Market Recap for October 23, 2026, captured on October 30 (New York time). Two runs a minute apart printed the same figures. It is a completed-session report, not a trade recommendation.
Two clocks apply. Premium, sentiment, and prints describe the session tape; GEX and IV are the recap's T+1 / prior-close snapshots, not a live intraday gamma map. Neutral premium supplies no direction, and call share is option type, not bullish sentiment. Net DEI is an unsigned magnitude relative to typical activity; Net DEX is a separate signed classification, and a +0M reading rounds to zero. GEX is modeled chain structure under TradingFlow's dealer-sign convention, not observed dealer inventory, a support level, or the next session's direction. Ticket tags do not prove who bought or sold or whether a position opened, and intraday_pct is a first-to-last underlying-price proxy from the option tape, not a verified daily return.
Reproduce the findings
- Open the October 23 recap; confirm Oct 23, 2026 in the session KPI.
- Open the October 22 recap beside it and compare the KPI strip, leaders, and all six index GEX rows.
- Compare MU's leaders-table tag, headline cards, and largest tickets on both days.
- Read Steps 4–6 separately: exposure magnitude, volatility rank, and index structure.
TradingFlow App Home → Cookbooks → Daily Market Recap → select the completed session.
Related reading
Educational and informational only, not financial advice. Options-flow reads are statistical inferences. Dealer exposure levels, including GEX, DEX, DEI, walls, and magnets, are modeled estimates, not guarantees.
Related Articles
October 29 Recap: GOOGL Leads a 51% Premium Jump as the Tone Leans Bearish
$21.9B in single-name premium, 26% bullish versus 27% bearish. GOOGL led at $2.1B Bearish; SPX GEX was −$18.16B.
October 28 Recap: MU Retakes the Lead at $2.0B as SPY and QQQ Flip Negative
$14.5B in single-name premium, 27% bullish versus 27% bearish. MU led at $2.0B Mixed; SPX GEX was +$22.53B.
October 27 Recap: All Six Index GEX Rows Turn Positive as SPX Flips to +$17.41B
$14.7B in single-name premium, 26% bullish versus 24% bearish. TSLA led at $1.3B Bullish; SPX GEX was +$17.41B.