October 20 Recap: SPX GEX Widens to −$36.72B as SPY and IWM Turn Positive
$12.6B in single-name premium, 25% bullish versus 26% bearish. MU led at $1.2B Mixed; SPX GEX was −$36.72B.

SPX net GEX widened from −11B on October 19 to −36.72B on October 20, while SPY (−2.15 to +0.95) and IWM (−0.91 to +0.97) turned Positive. Single-name premium fell for a third straight edition, from $14.2B to $12.6B (−11%), less than half of October 15's $27.1B.
$12.6B, 60% calls, 25% bullish versus 26% bearish. MU led at $1.2B Mixed; three of six index GEX rows were Positive.
Open Daily Market Recap or the October 20 session. Sign-in and a paid entitlement may be required.
What the recap printed
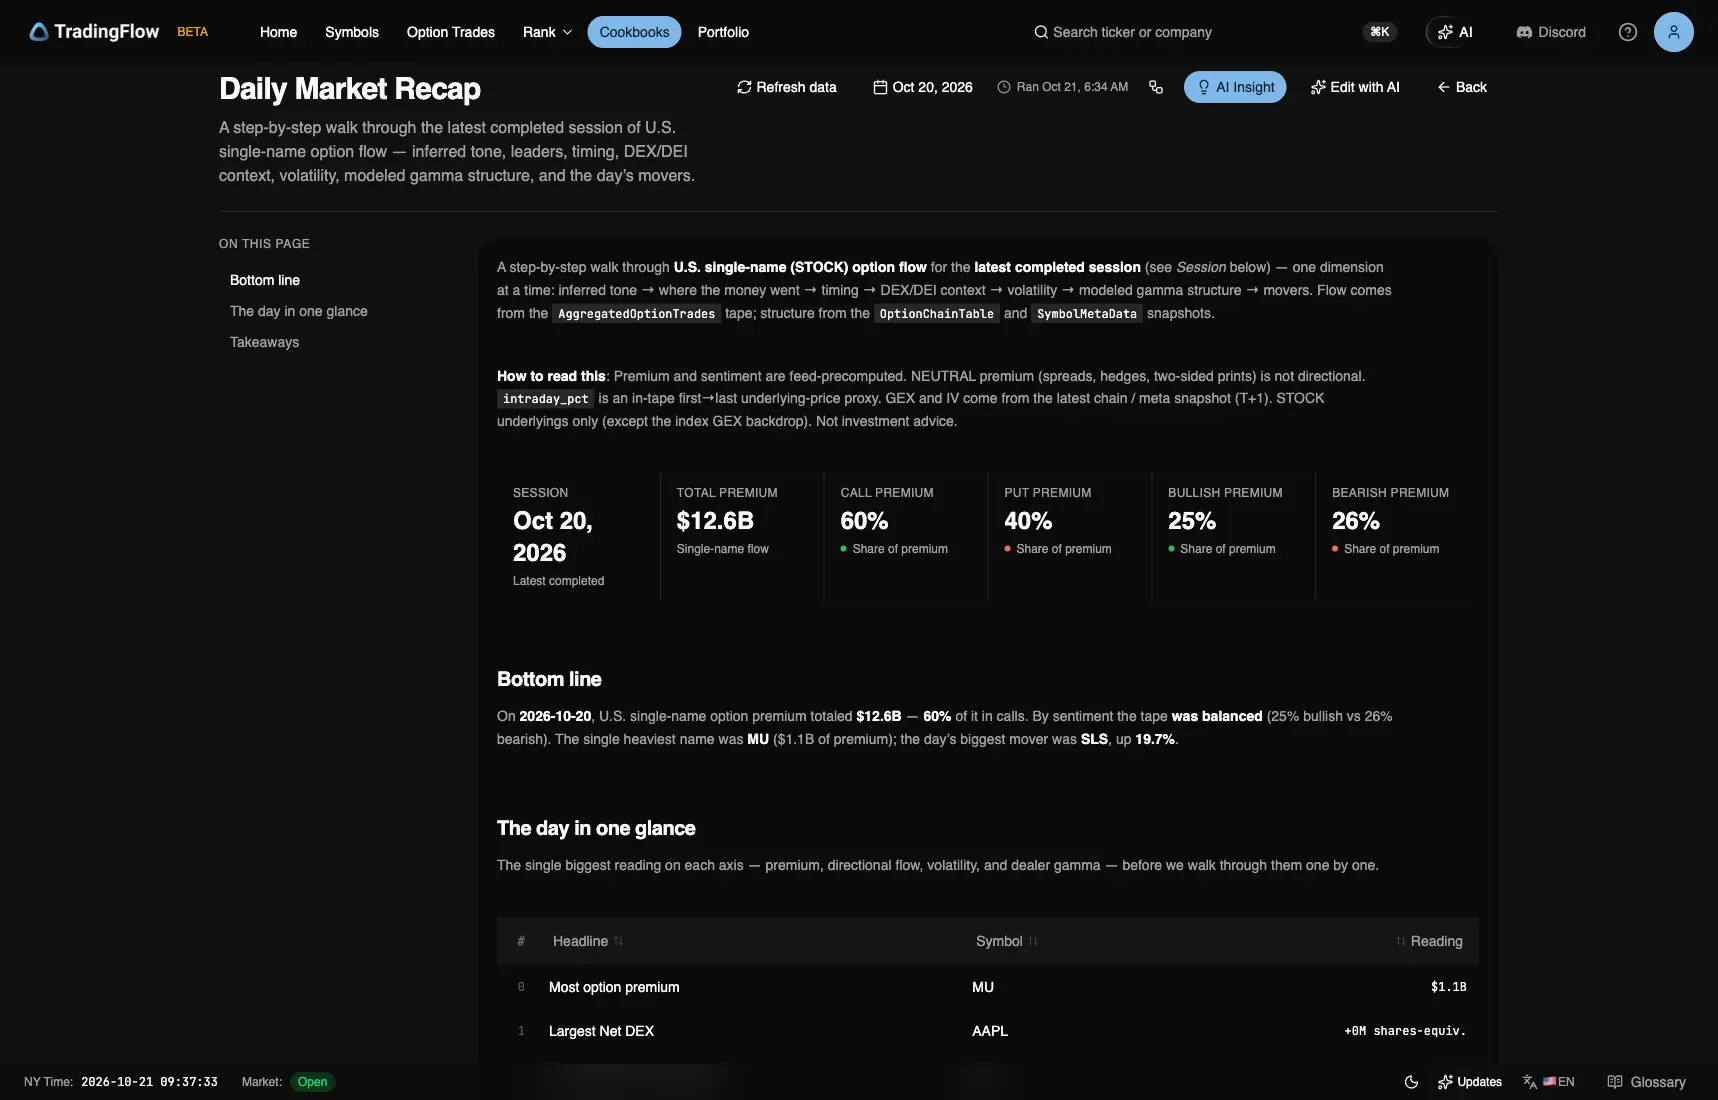
Test app, session 2026-10-20, KPI. Captured October 21, 2026 (Pacific time).
| Reading | Recap value |
|---|---|
| Single-name premium | $12.6B |
| Call / Put | 60% / 40% |
| Bullish / Bearish | 25% / 26% |
| Overall tone | was balanced |
| First 30-minute window | 09:30 · $2.0B |
Sentiment bars: Neutral $6.2B, Bearish $3.2B, Bullish $3.1B.
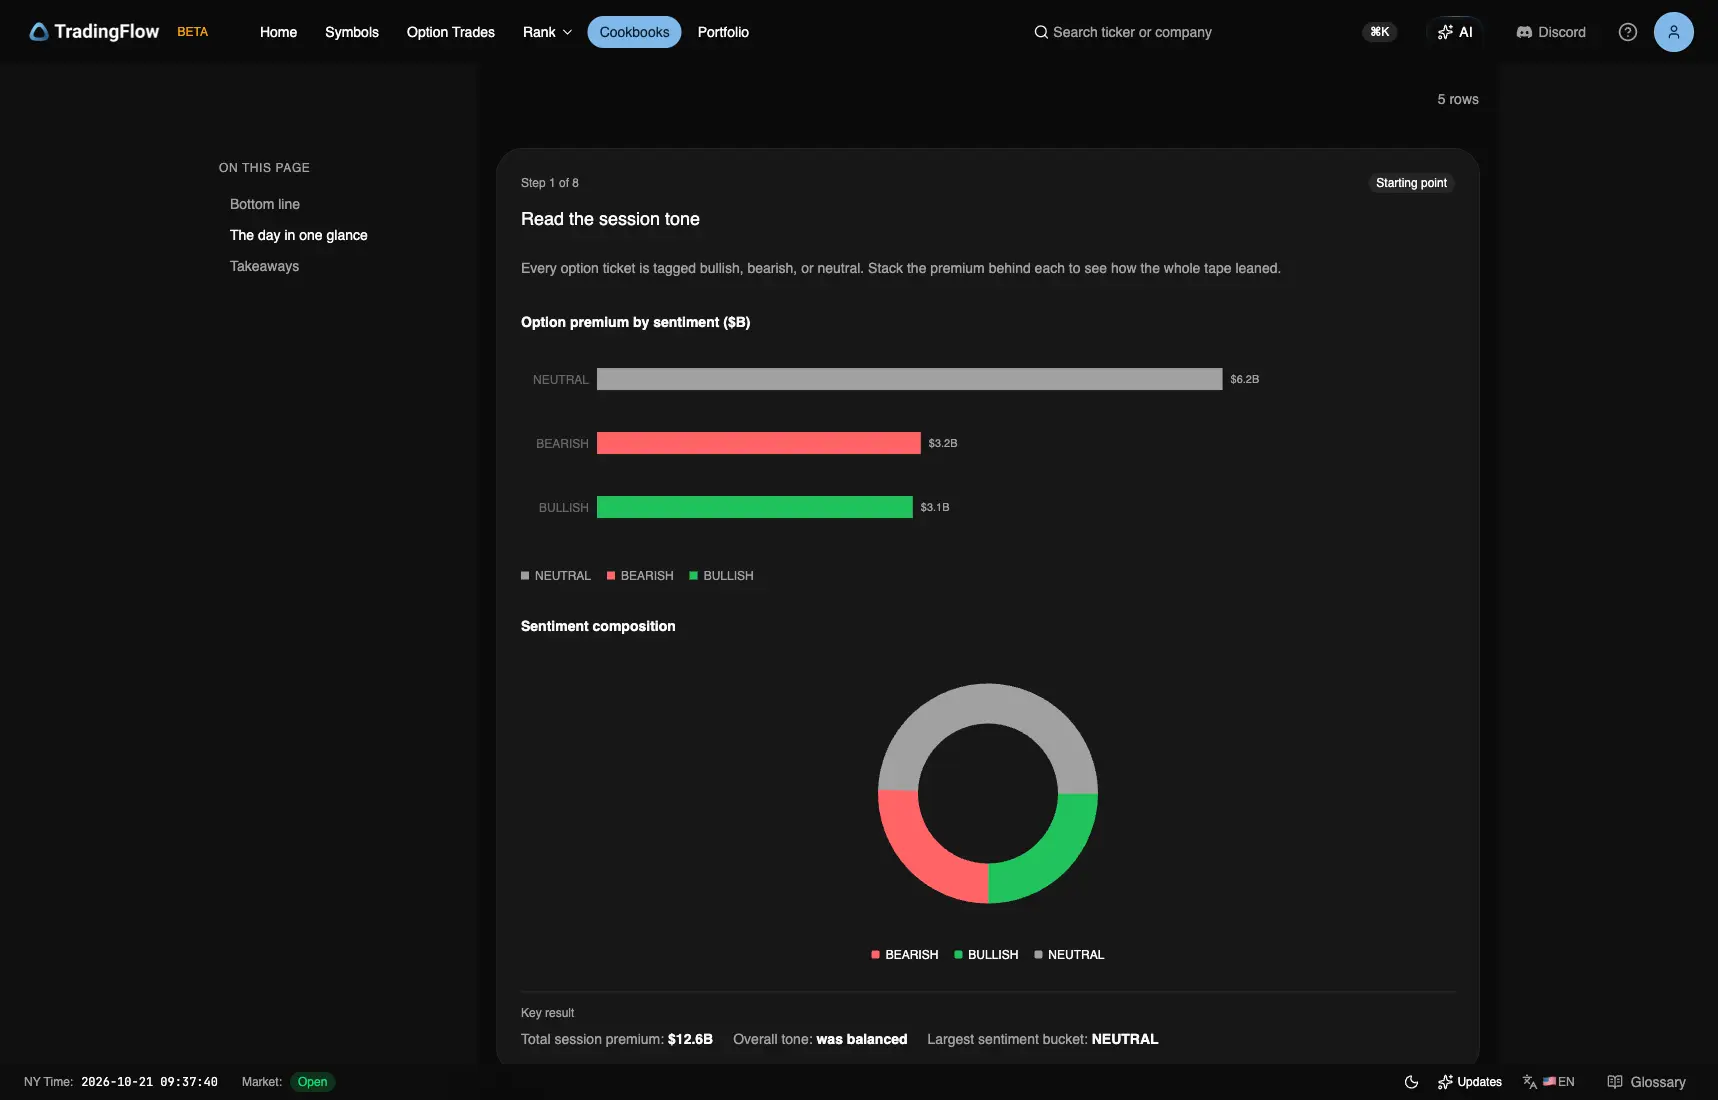
Test app, session 2026-10-20, Step 1. Captured October 21, 2026 (Pacific time).
What changed since October 19
| Reading | Oct 19 | Oct 20 |
|---|---|---|
| Single-name premium | $14.2B | $12.6B |
| Call / Put | 60% / 40% | 60% / 40% |
| Bullish / Bearish | 25% / 24% | 25% / 26% |
| Tone | was balanced | was balanced |
| Leader | MU $1.6B Mixed | MU $1.2B Mixed |
| SPX net GEX ($B) | −11 Negative | −36.72 Negative |
| Positive index rows | DIA | SPY · IWM · DIA |
| Largest MU ticket | $8M, 2027-01-15 | 1,300 PUT 2026-11-20 $20M |
The call share and the balanced tone did not change; the bearish share rose two points. Premium has now fallen from $27.1B (October 15) to $18.8B, $14.2B, and $12.6B.
Leaders: where premium concentrated
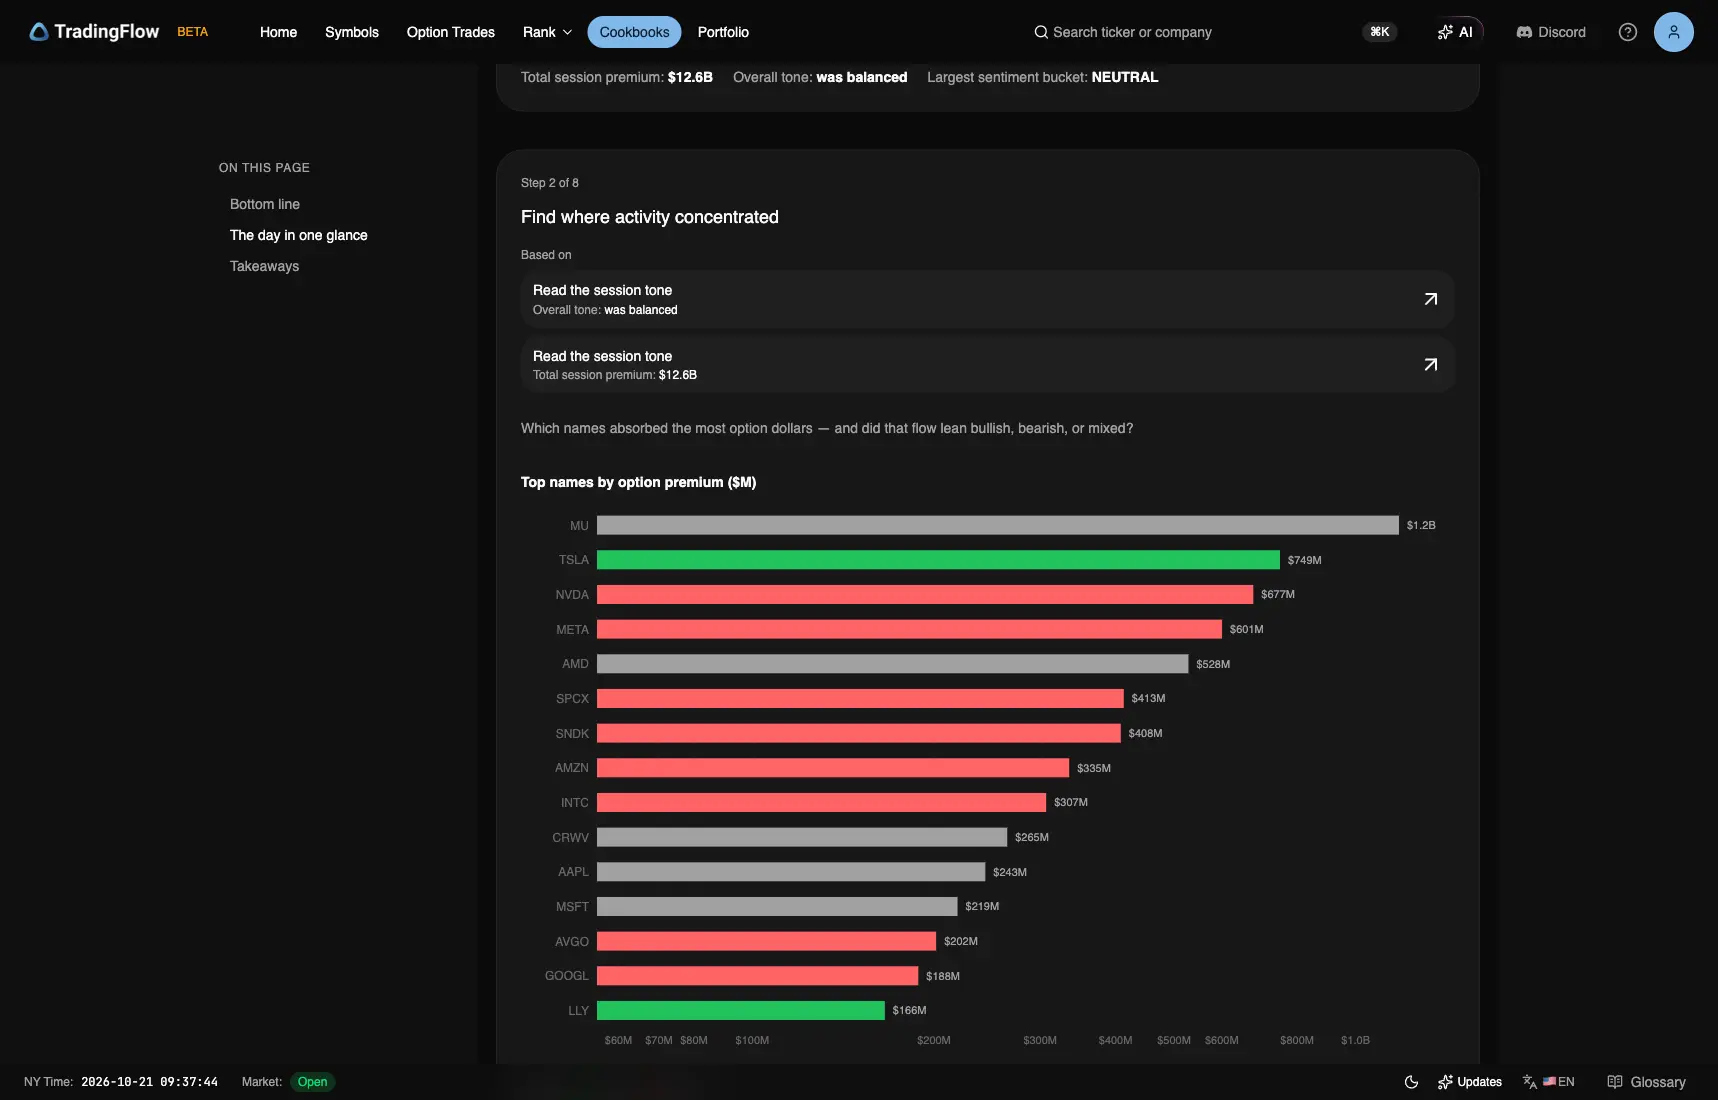
Test app, session 2026-10-20, Step 2. Captured October 21, 2026 (Pacific time).
| Symbol | Premium | Call | Put | Net bias |
|---|---|---|---|---|
| MU | $1.2B | $645M | $535M | Mixed |
| TSLA | $749M | $470M | $280M | Bullish |
| NVDA | $677M | $427M | $250M | Bearish |
| META | $601M | $365M | $236M | Bearish |
| AMD | $528M | $269M | $259M | Mixed |
| SPCX | $413M | $232M | $181M | Bearish |
TSLA was the only Bullish name in the top six; NVDA moved from Mixed to Bearish, SNDK fell out of the top six, and SPCX entered it. Every top-six name showed more call than put premium.
The bottom line and glance print MU at $1.1B; the leaders table and headline cards print $1.2B.
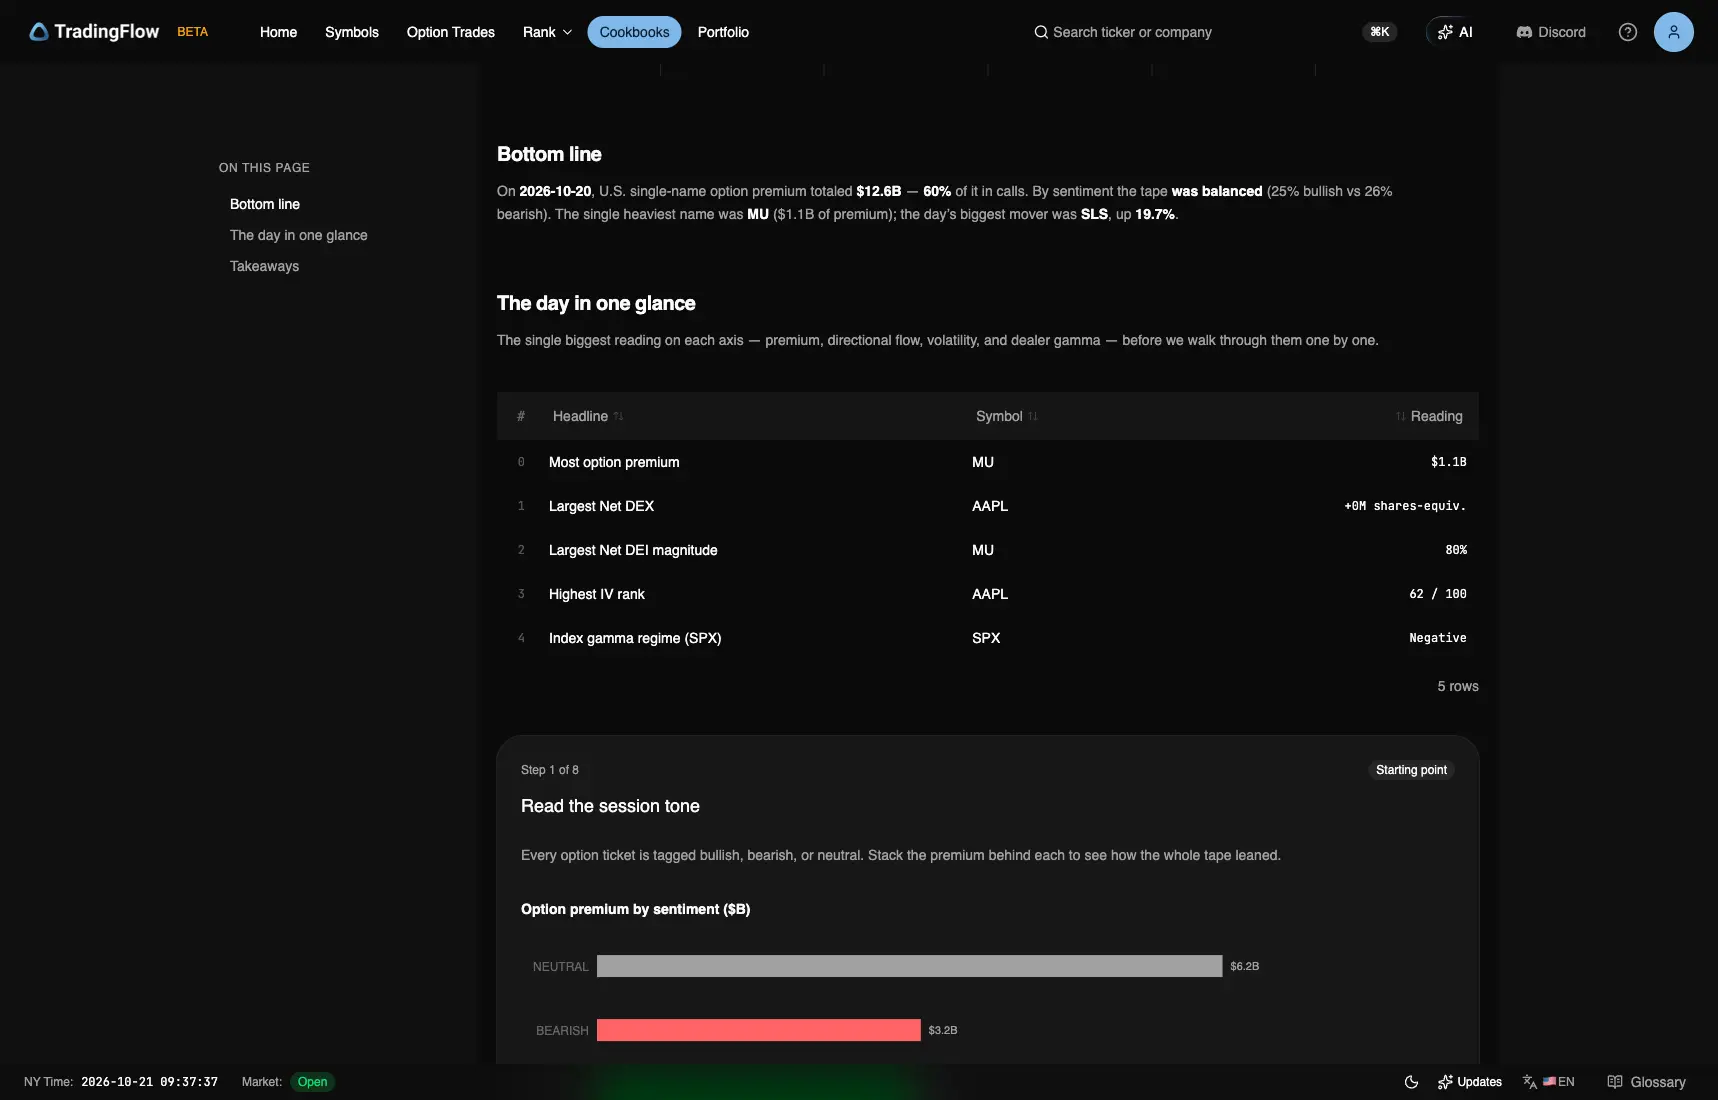
Test app, session 2026-10-20, Bottom line / glance. Captured October 21, 2026 (Pacific time).
Exposure and volatility context
The glance lists AAPL +0M shares-equiv. as largest Net DEX and MU 80% as largest Net DEI magnitude. Step 4 pairs MU's 80% with a Negative Net DEX sign; the leader on October 19 was TSLA at 217%.
Step 5's highest IV rank among active names is AAPL 62 / 100, with 28.0% 30-day implied volatility, against AAPL's 63 / 100 and 28.2% on October 19.
Index GEX: SPX −36.72B, three rows Positive
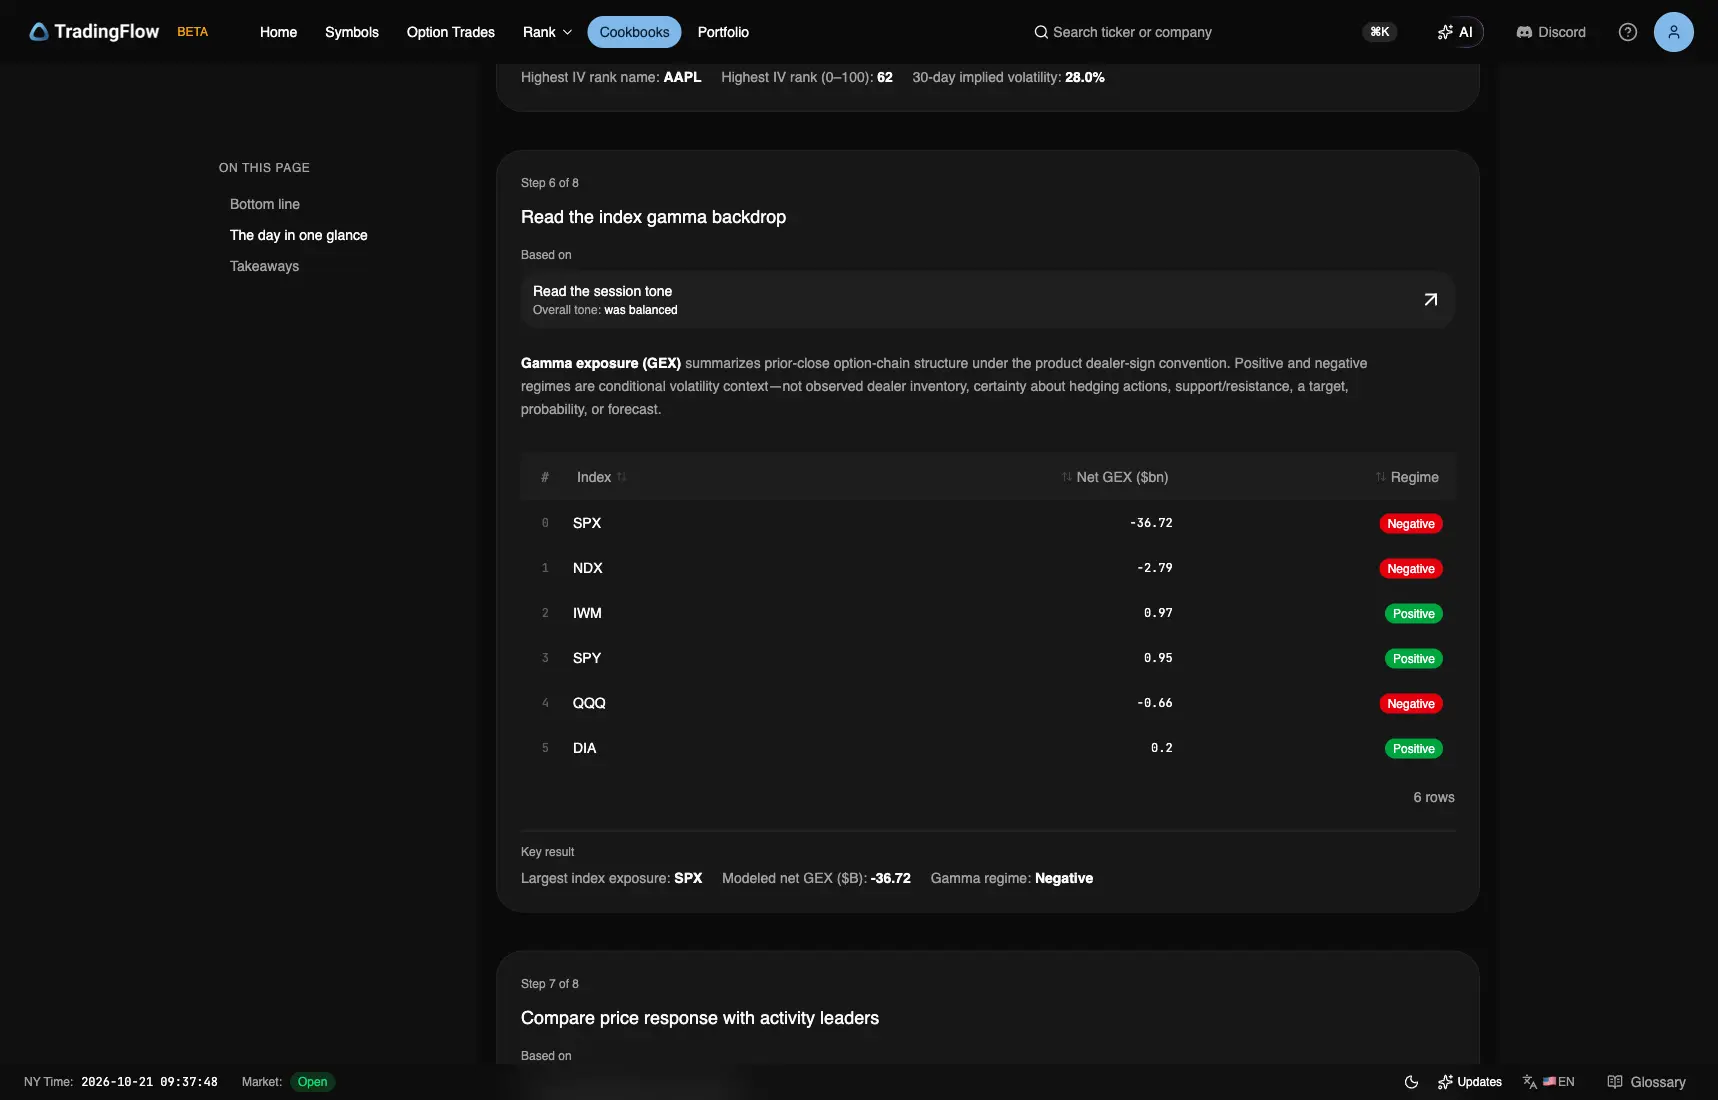
Test app, session 2026-10-20, Step 6 · T+1. Captured October 21, 2026 (Pacific time).
| Index | Net GEX ($B) | Regime |
|---|---|---|
| SPX | −36.72 | Negative |
| NDX | −2.79 | Negative |
| IWM | +0.97 | Positive |
| SPY | +0.95 | Positive |
| QQQ | −0.66 | Negative |
| DIA | +0.2 | Positive |
The index rows split. SPX deepened from −11 to −36.72 and NDX from −1.84 to −2.79, while SPY and IWM crossed from Negative to Positive and DIA rose from +0.04 to +0.2. On October 16 every row but DIA had been Negative, with SPX at −143.34.
Headline name: MU at $897
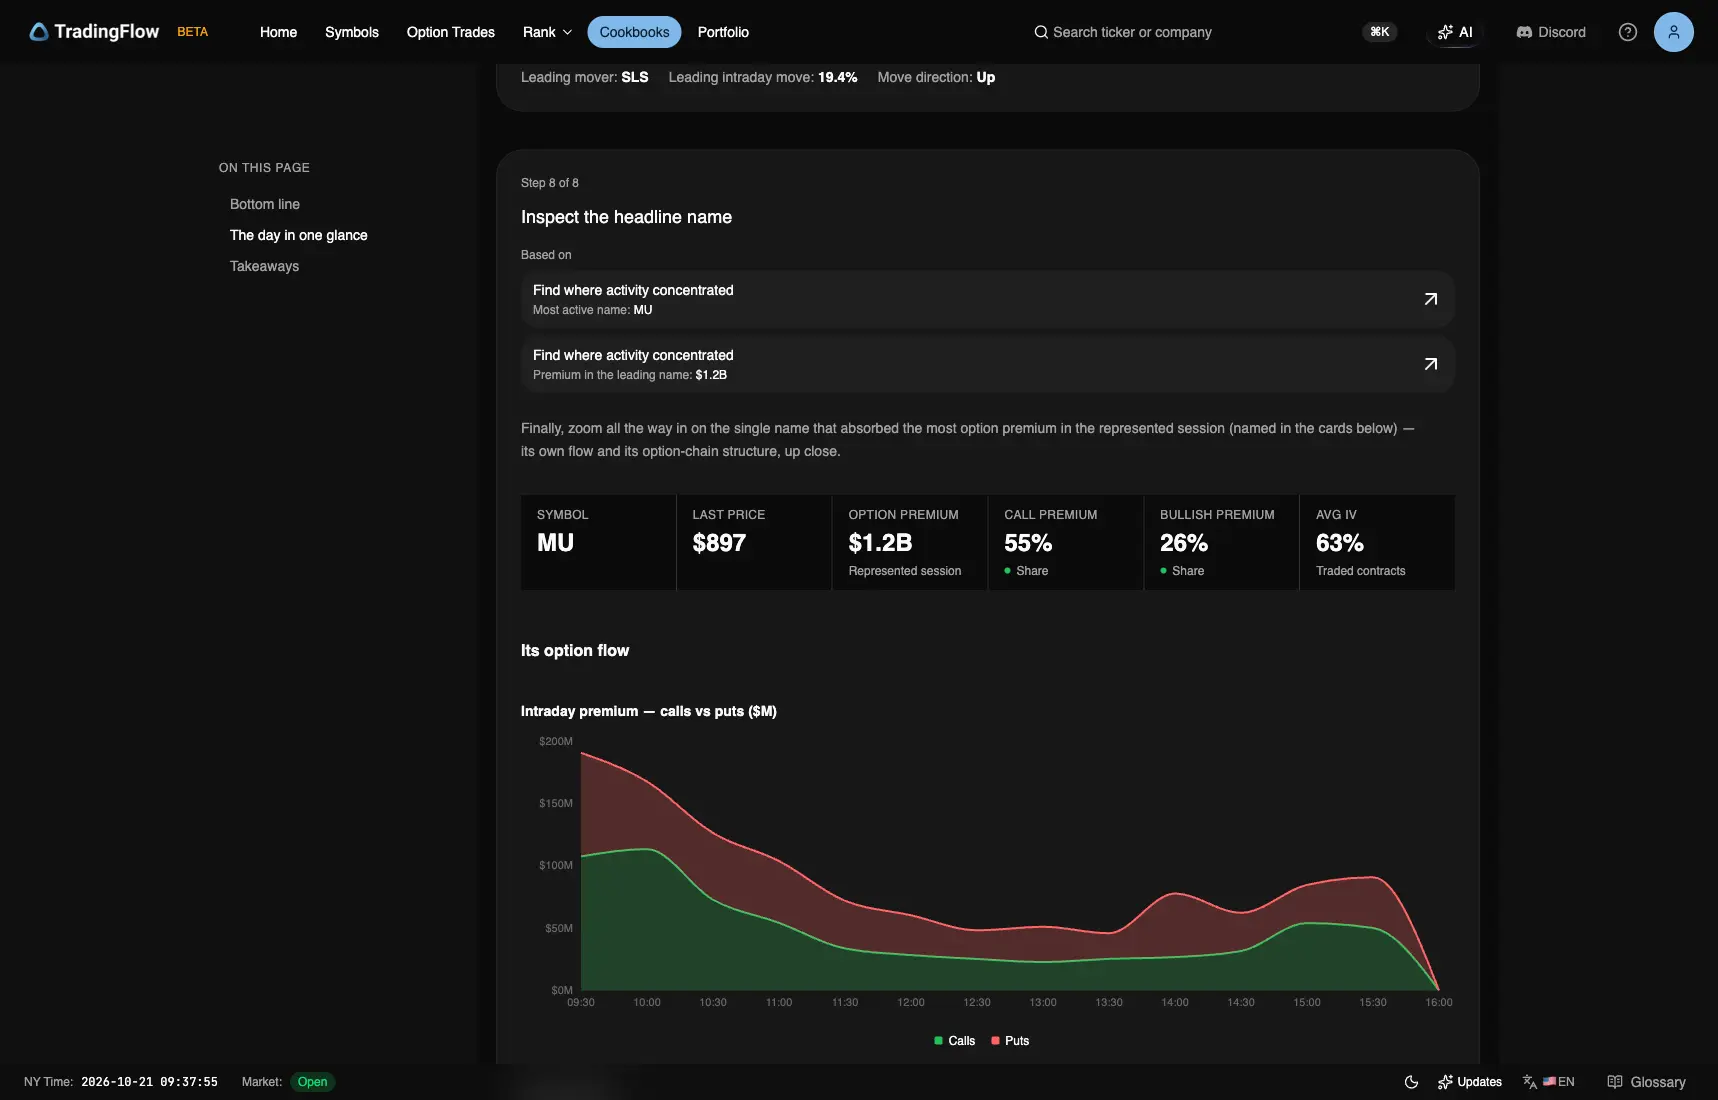
Test app, session 2026-10-20, Step 8. Captured October 21, 2026 (Pacific time).
Cards: last $897, premium $1.2B, 55% calls, 26% bullish, 63% average IV on traded contracts. On October 19 the cards read $905, $1.6B, 49% calls, 23% bullish, and 67%.
| Time | Type | Strike | Expiry | Premium | Sentiment |
|---|---|---|---|---|---|
| 14:22 | PUT | 1,300 | 2026-11-20 | $20M | NEUTRAL |
| 14:22 | PUT | 1,110 | 2026-10-23 | $10M | NEUTRAL |
| 10:59 | PUT | 900 | 2026-11-27 | $6M | BEARISH |
| 09:43 | PUT | 1,130 | 2027-03-19 | $5M | NEUTRAL |
| 09:43 | PUT | 1,150 | 2026-12-18 | $5M | NEUTRAL |
| 13:40 | CALL | 870 | 2026-10-23 | $4M | NEUTRAL |
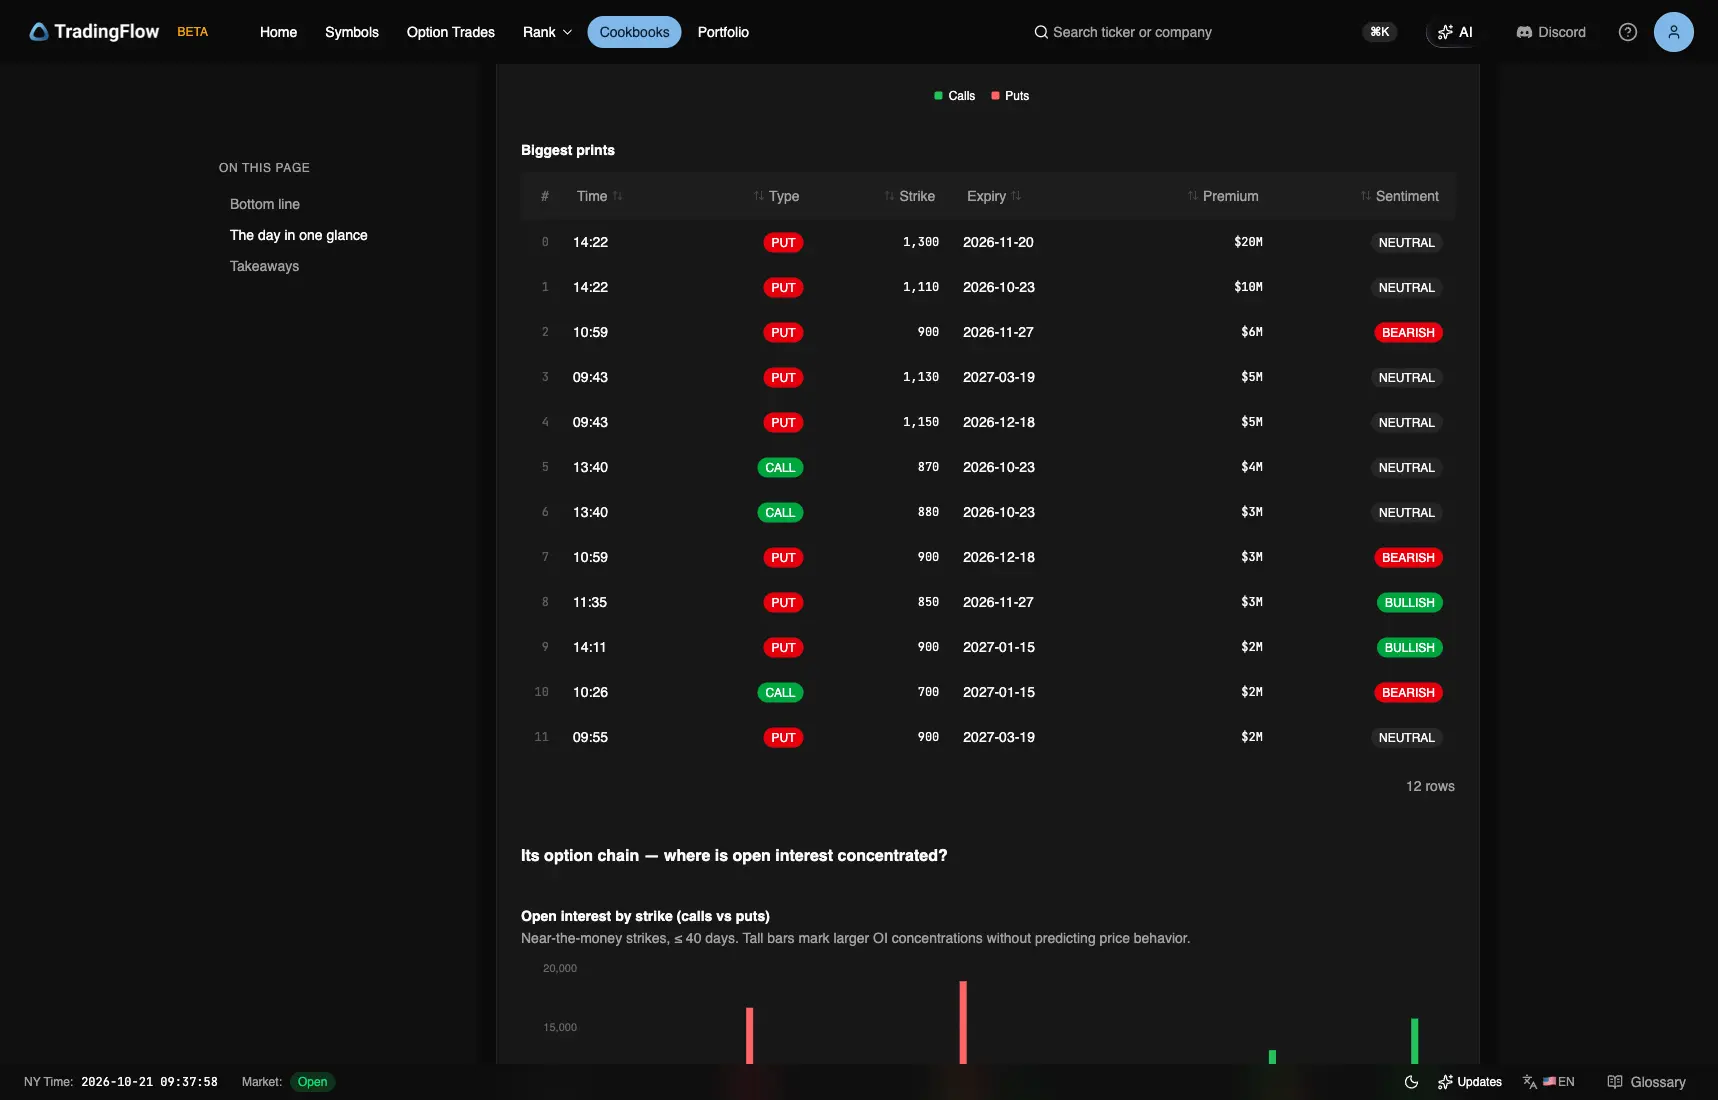
Test app, session 2026-10-20, Step 8 · prints. Captured October 21, 2026 (Pacific time).
The largest MU ticket was a $20M 1,300 put expiring 2026-11-20, tagged Neutral, at more than twice the $8M top tickets of October 16 and 19. Two of the top six expire that same week, on 2026-10-23; on October 19 all six shared the 2027-01-15 expiry.
Movers: SLS +19.7%
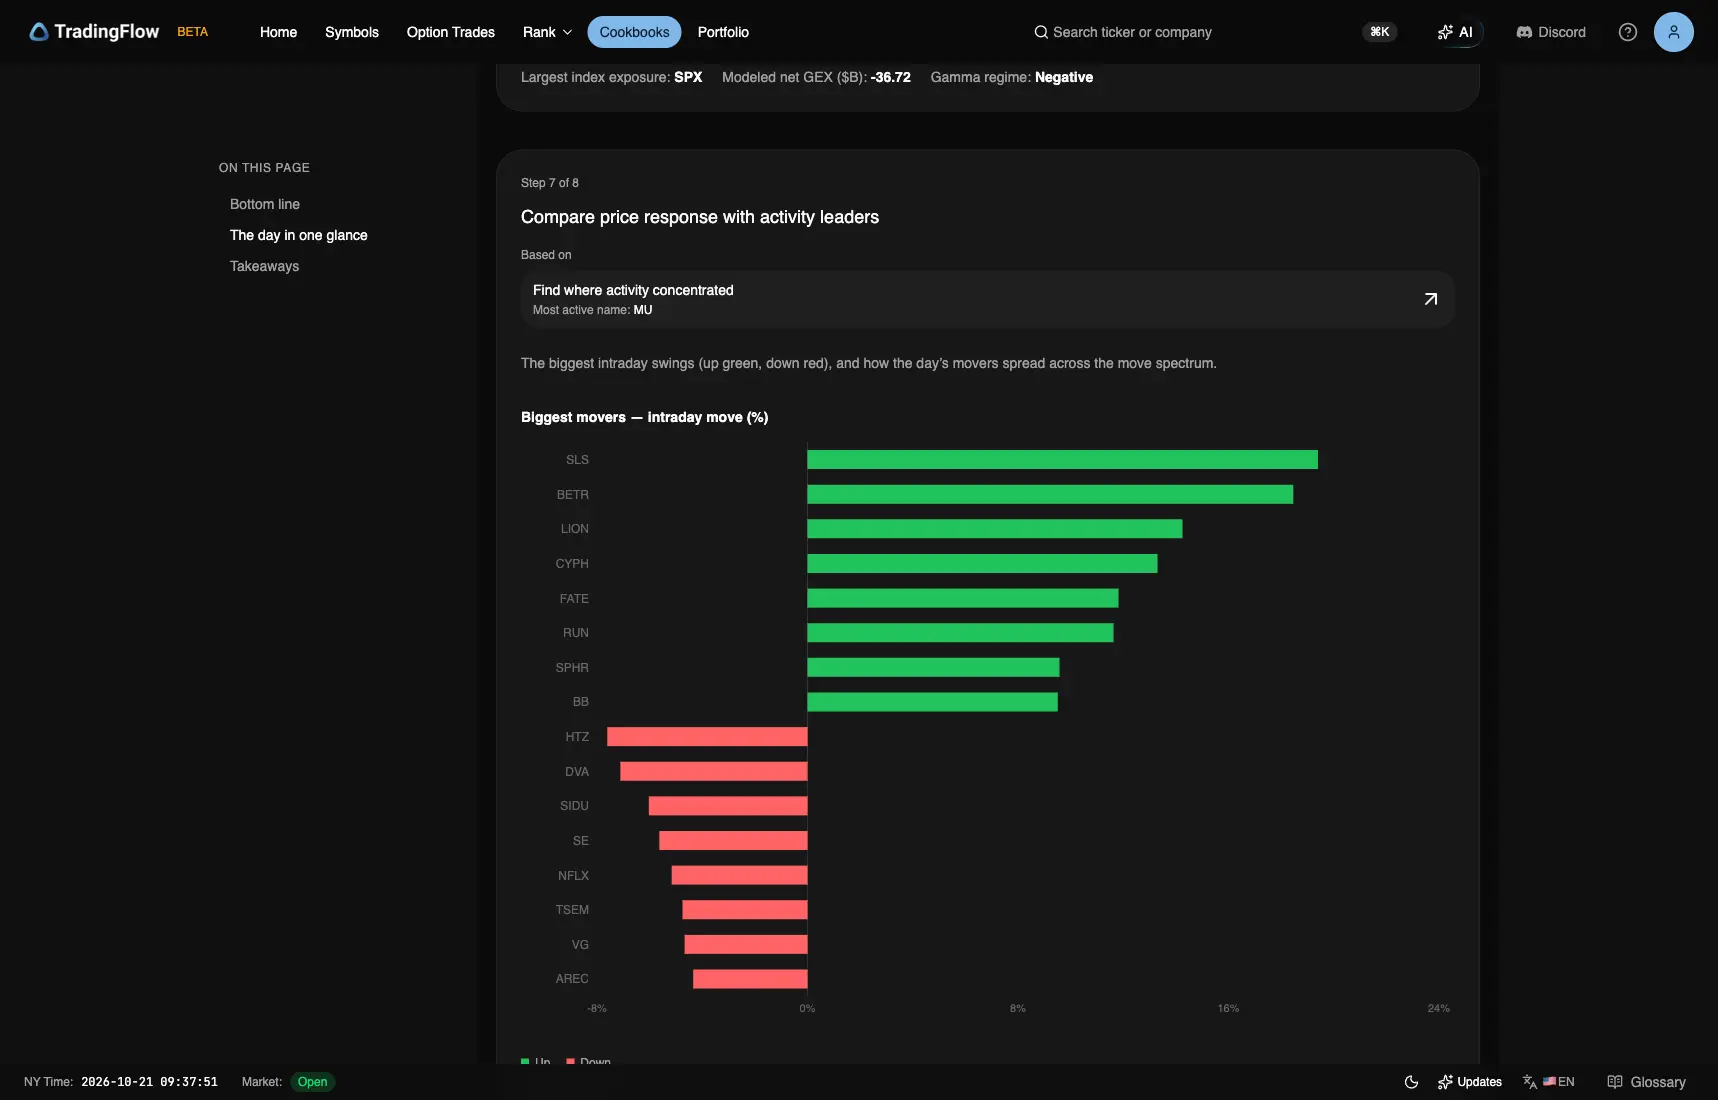
Test app, session 2026-10-20, Step 7. Captured October 21, 2026 (Pacific time).
Bottom line: SLS +19.7%. Step 7: SLS 19.8%, Up. Across eight runs each field printed 19.4% once, including the Step 7 key in the run captured here. October 19's largest gain was NAUT +30%.
What this session is evidence of
| Question | Oct 20 | Oct 19 | Clock |
|---|---|---|---|
| Size / tone | $12.6B · 25% / 26% · was balanced | $14.2B · 25% / 24% · was balanced | Session tape |
| Concentration | MU $1.2B Mixed | MU $1.6B Mixed | Session leaders |
| Relative exposure | MU DEI 80% · DEX Negative | TSLA DEI 217% · DEX Positive | Session exposure |
| Volatility | AAPL IV rank 62 · IV 28.0% | AAPL IV rank 63 · IV 28.2% | T+1 |
| Index structure | SPX −36.72B Negative · SPY, IWM, DIA Positive | SPX −11B Negative · DIA Positive | T+1 |
| Largest MU print | 1,300 PUT 2026-11-20 $20M NEUTRAL | Three $8M tickets, all 2027-01-15 | Session ticket |
How to read these numbers
This edition reads TradingFlow's Daily Market Recap for October 20, 2026, captured on October 21 (Pacific time). Eight runs between 5:22 and 6:34 AM Pacific printed the same figures apart from the SLS move above, including identical index GEX before and after 9:30 AM Eastern. It is a completed-session report, not a trade recommendation.
Two clocks apply. Premium, sentiment, and prints describe the session tape; GEX and IV are the recap's T+1 / prior-close snapshots, not a live intraday gamma map. Neutral premium supplies no direction, and call share is option type, not bullish sentiment. Net DEI is an unsigned magnitude relative to typical activity; Net DEX is a separate signed classification, and a +0M reading rounds to zero. GEX is modeled chain structure under TradingFlow's dealer-sign convention, not observed dealer inventory, a support level, or the next session's direction. Ticket tags do not prove who bought or sold or whether a position opened, and intraday_pct is a first-to-last underlying-price proxy from the option tape, not a verified daily return.
Reproduce the findings
- Open the October 20 recap; confirm Oct 20, 2026 in the session KPI.
- Open the October 19 recap beside it and compare the KPI strip, leaders, and all six index GEX rows.
- Compare MU's leaders-table tag, headline cards, and largest tickets on both days.
- Read Steps 4–6 separately: exposure magnitude, volatility rank, and index structure.
TradingFlow App Home → Cookbooks → Daily Market Recap → select the completed session.
Related reading
Related Articles
October 19 Recap: SPX GEX Shrinks to −$11B From −$143.34B
$14.2B in single-name premium, 25% bullish versus 24% bearish. MU led at $1.6B Mixed; SPX GEX was −$11B.
October 16 Recap: SPX GEX Deepens to −$143.34B as Premium Falls 31%
$18.8B in single-name premium, 25% bullish versus 28% bearish. MU led at $1.8B Bearish; SPX GEX was −$143.34B.
October 15 Recap: Leaned Bullish, MU $2.8B Bullish, SPX GEX Negative
$27.1B in single-name premium, 27% bullish versus 24% bearish. MU led at $2.8B Bullish; SPX GEX was −$13.69B.