
October 15 Recap: Leaned Bullish, MU $2.8B Bullish, SPX GEX Negative
$27.1B in single-name premium, 27% bullish versus 24% bearish. MU led at $2.8B Bullish; SPX GEX was −$13.69B.
This edition reads TradingFlow’s Daily Market Recap for October 15, 2026, captured on October 16 (Pacific time). The quoted figures agreed across two runs. This is a completed-session report, not a trade recommendation.
Keep two clocks separate: premium, sentiment, and prints describe the session tape; GEX and IV are the recap’s T+1 / prior-close snapshots. This historical recap is not a live intraday gamma map.
$27.1B, 47% calls, 27% bullish versus 24% bearish. MU led at $2.8B Bullish; SPX net GEX printed −13.69B, Negative.
Open Daily Market Recap or the October 15 session. Sign-in and a paid entitlement may be required.
What the recap printed
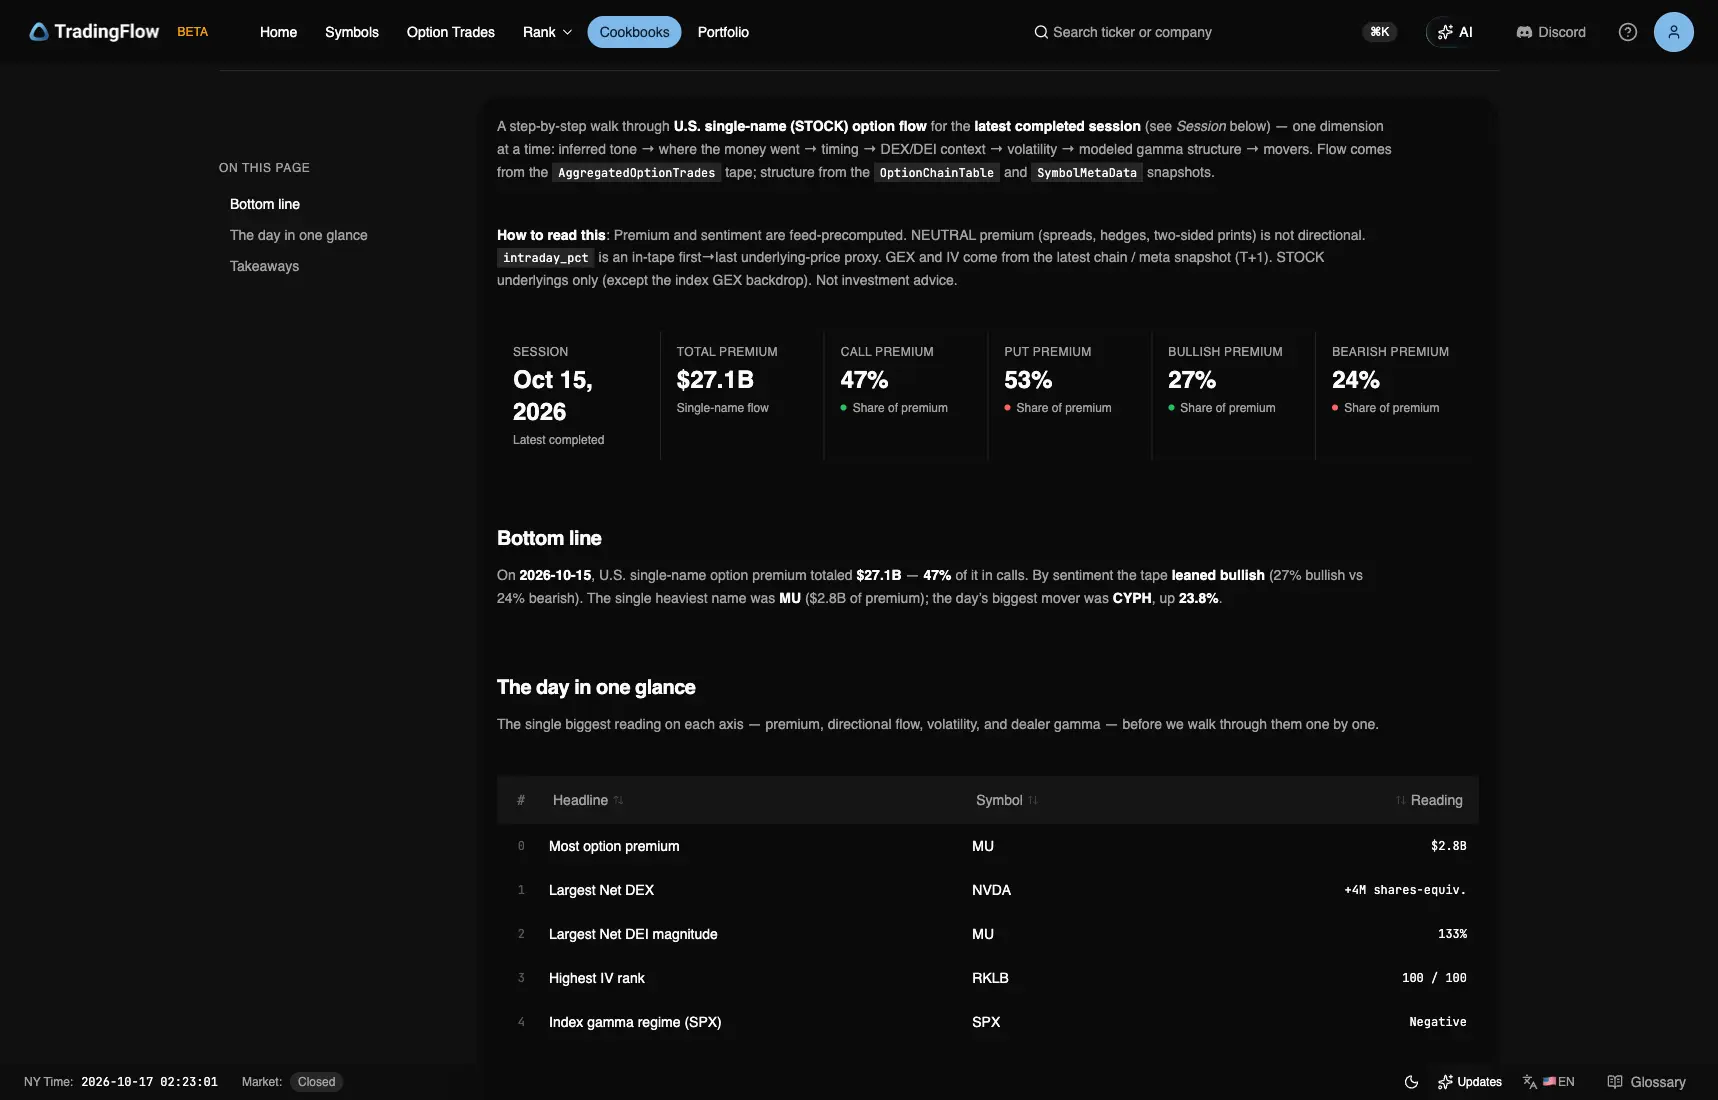
Test app, session 2026-10-15, KPI. Captured October 16, 2026 (Pacific time).
| Reading | Recap value |
|---|---|
| Single-name premium | $27.1B |
| Call / Put | 47% / 53% |
| Bullish / Bearish | 27% / 24% |
| Overall tone | leaned bullish |
| First 30-minute window | 09:30 · $3.9B |
Sentiment bars: Neutral $13.1B, Bullish $7.5B, Bearish $6.7B. Call share is option type, not bullish sentiment. Neutral premium supplies no direction; chapter values and the KPI total are separate displayed fields, which need not reconcile exactly.
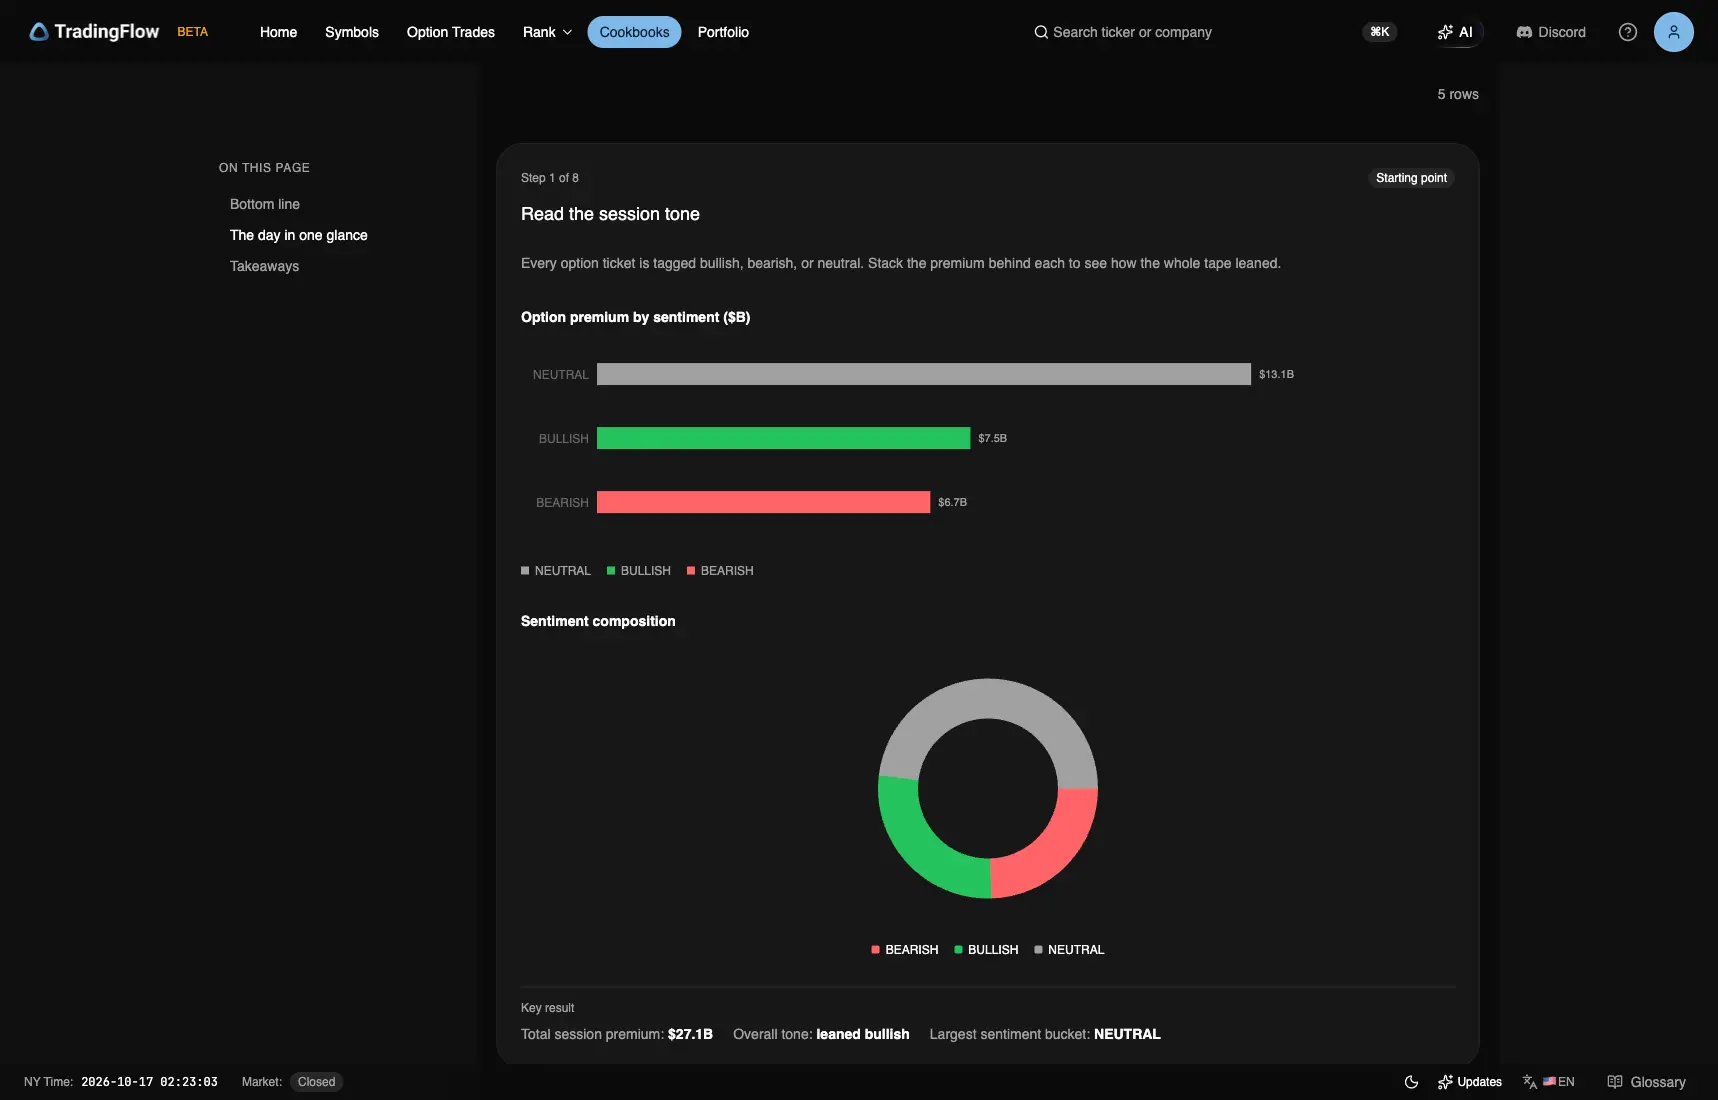
Test app, session 2026-10-15, Step 1. Captured October 16, 2026 (Pacific time).
Leaders: where premium concentrated
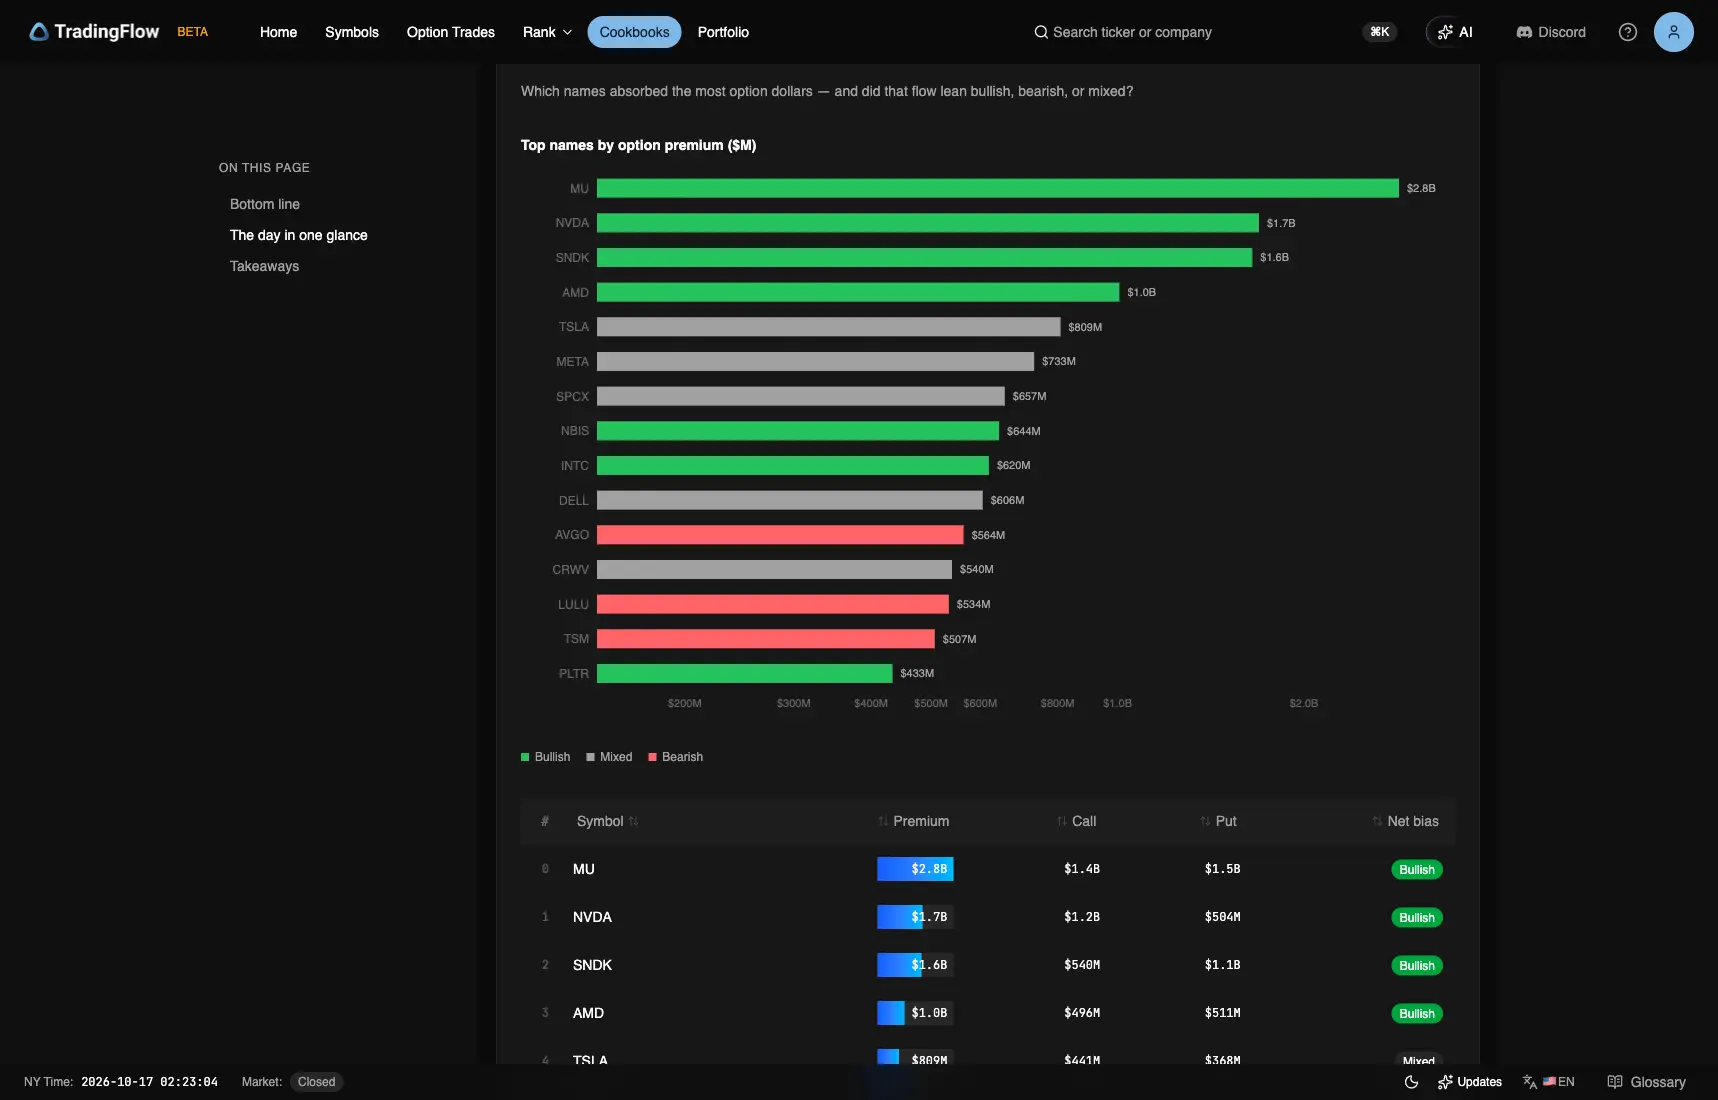
Test app, session 2026-10-15, Step 2. Captured October 16, 2026 (Pacific time).
| Symbol | Premium | Call | Put | Net bias |
|---|---|---|---|---|
| MU | $2.8B | $1.4B | $1.5B | Bullish |
| NVDA | $1.7B | $1.2B | $504M | Bullish |
| SNDK | $1.6B | $540M | $1.1B | Bullish |
| AMD | $1.0B | $496M | $511M | Bullish |
| TSLA | $809M | $441M | $368M | Mixed |
| META | $733M | $574M | $159M | Mixed |
MU, NVDA, SNDK, and AMD carried Bullish tags, while TSLA and META were Mixed. MU, SNDK, and AMD each showed more put than call premium. A put-heavy mix can coexist with a Bullish classification.
The bottom line and glance show MU $2.8B; the leaders table and headline cards show MU $2.8B. Preserve these field readings rather than reconciling them into a new number.
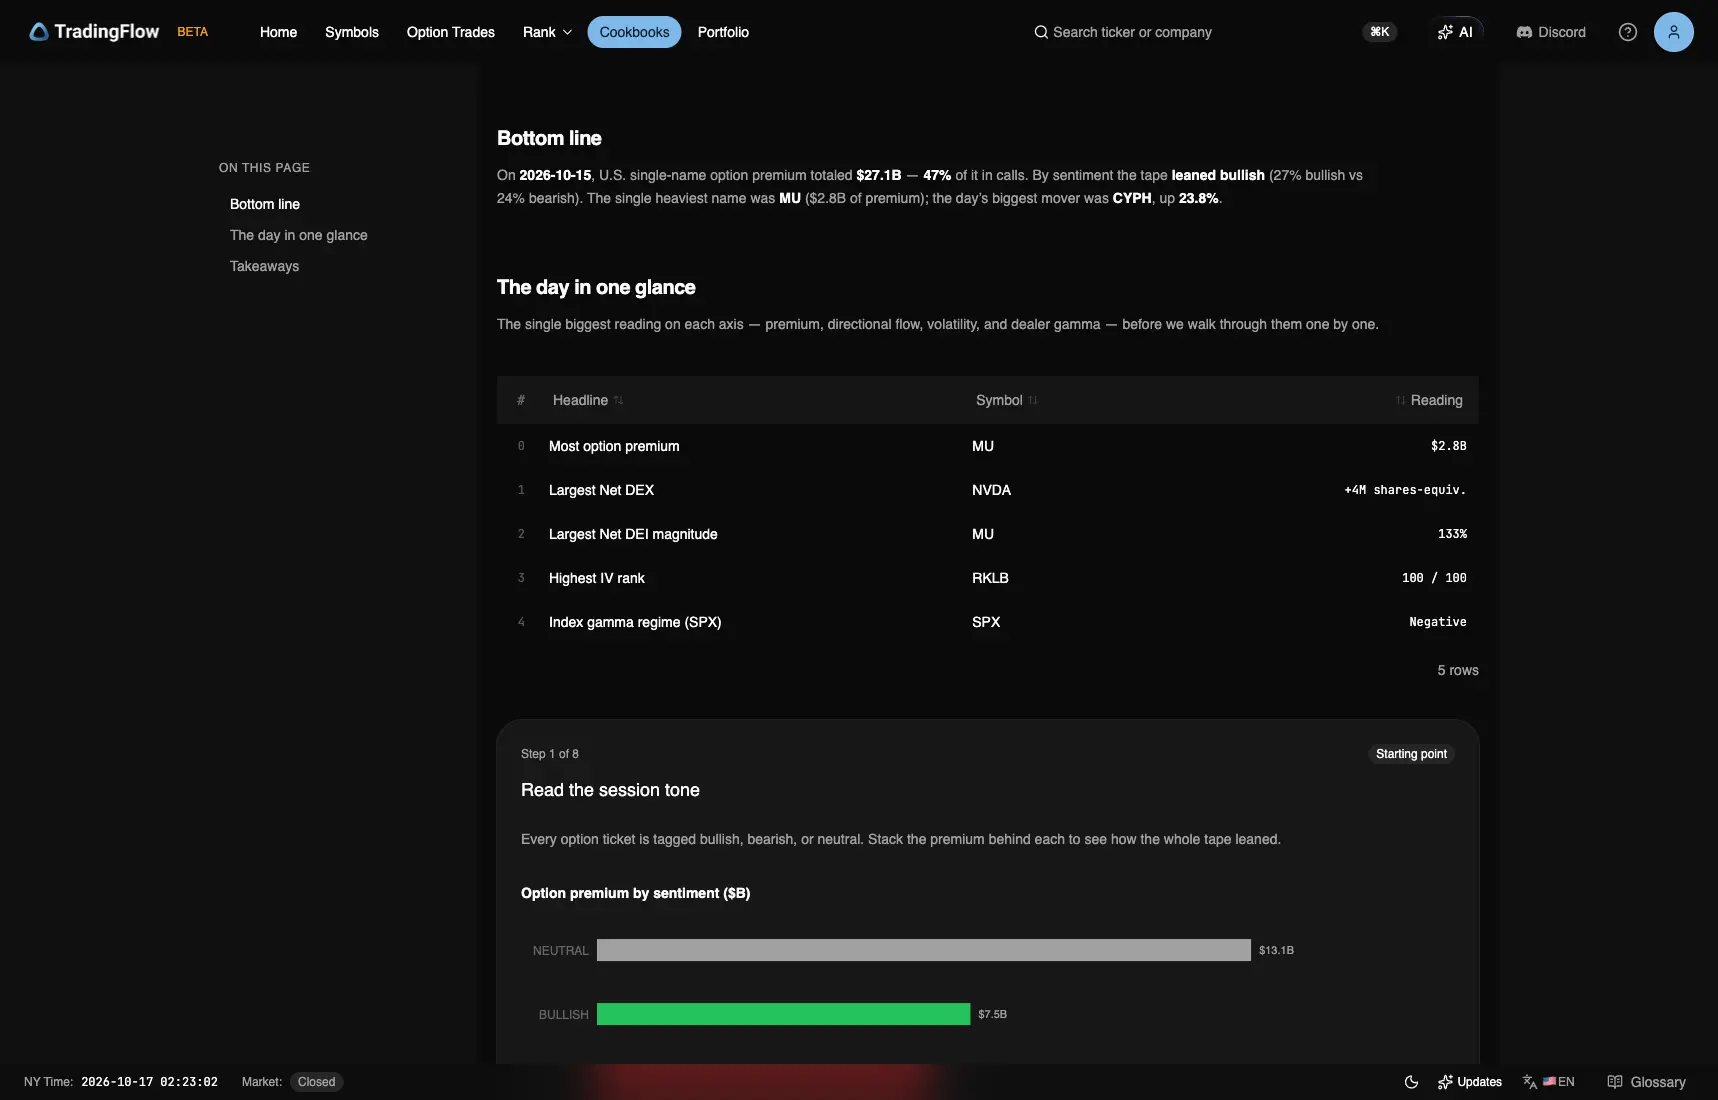
Test app, session 2026-10-15, Bottom line / glance. Captured October 16, 2026 (Pacific time).
Exposure and volatility context
The glance lists NVDA +4M shares-equiv. as largest Net DEX and MU 133% as largest Net DEI magnitude. Step 4 prints MU 133%, with Positive Net DEX. DEI is an unsigned activity-relative magnitude; DEX provides a separate signed classification. Neither proves opening intent or actual dealer inventory.
Step 5’s highest IV rank among active names is RKLB 100 / 100, with 130.5% 30-day implied volatility. This is snapshot volatility context, not realized session volatility.
Index GEX: SPX Negative
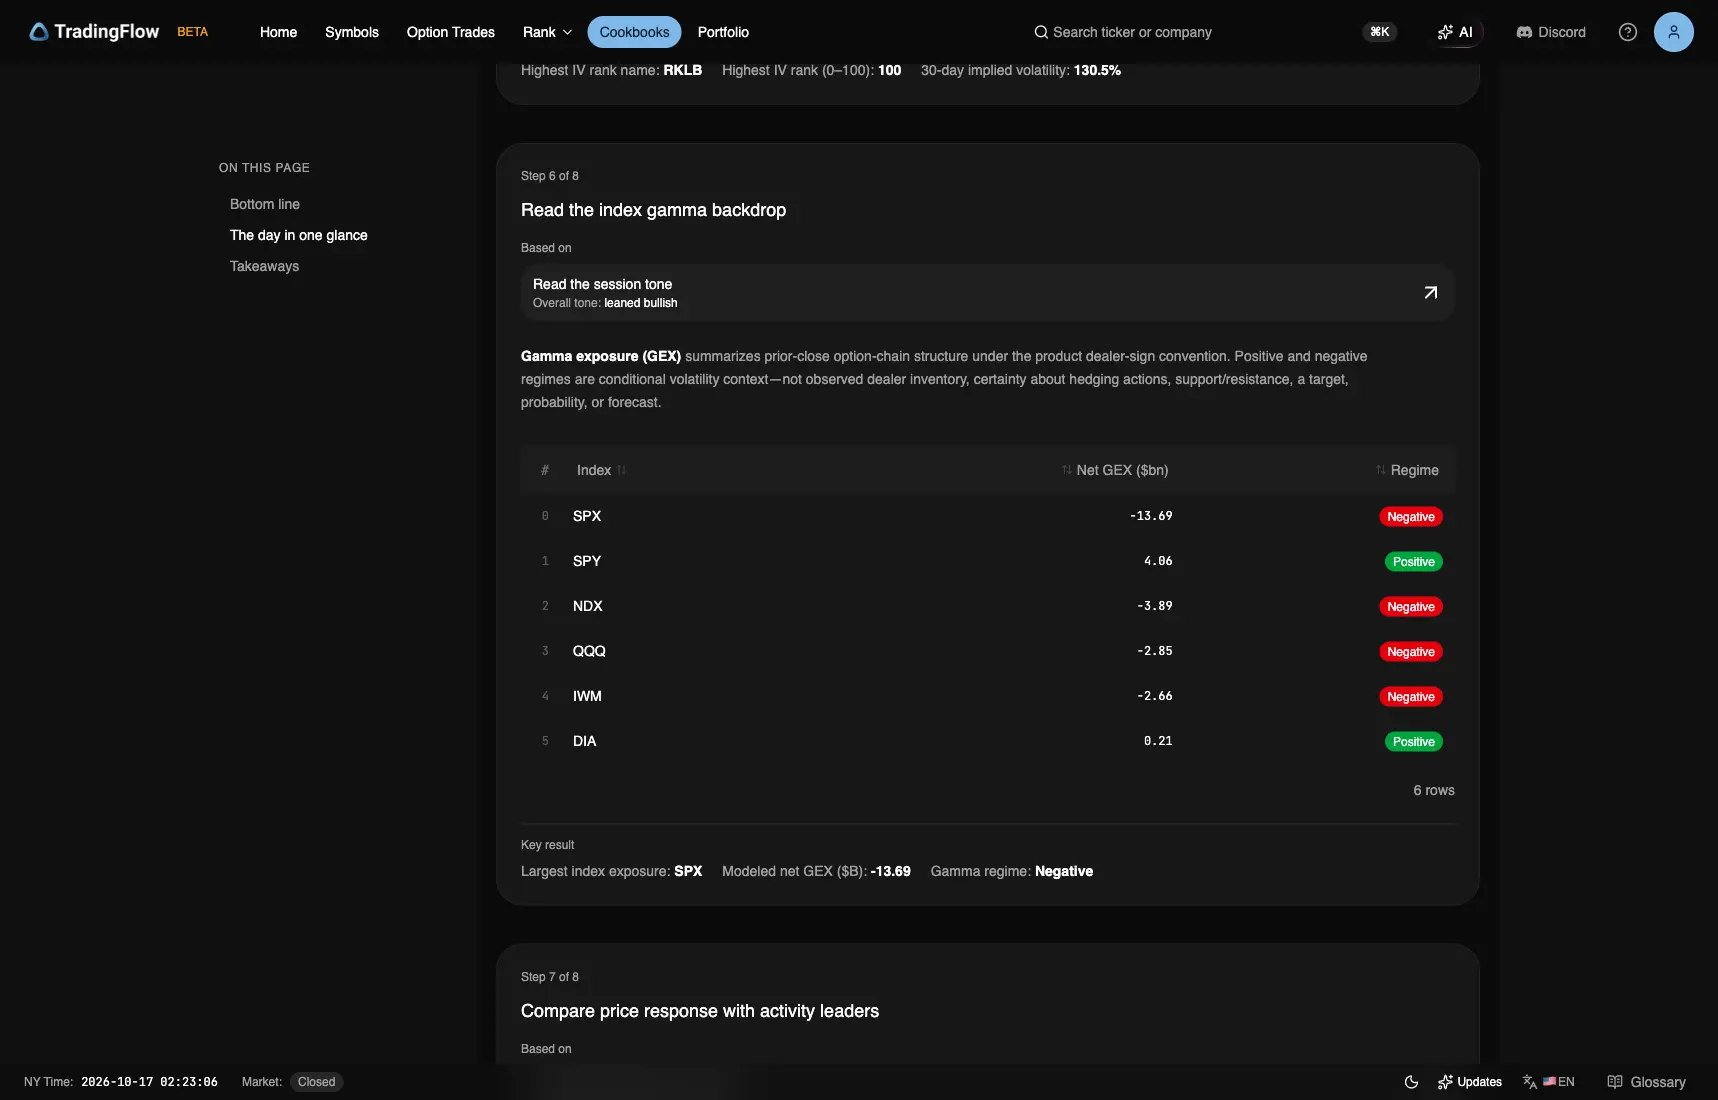
Test app, session 2026-10-15, Step 6 · T+1. Captured October 16, 2026 (Pacific time).
| Index | Net GEX ($B) | Regime |
|---|---|---|
| SPX | −13.69 | Negative |
| SPY | +4.06 | Positive |
| NDX | −3.89 | Negative |
| QQQ | −2.85 | Negative |
| IWM | −2.66 | Negative |
| DIA | +0.21 | Positive |
SPX, NDX, QQQ, and IWM were Negative; SPY and DIA were Positive. A bullish session tape did not make every modeled index gamma book Positive.
GEX describes modeled chain structure under TradingFlow’s dealer-sign convention. The regime does not establish observed dealer inventory, a support level, a pin target, or the next session’s direction.
Headline name: MU at $931
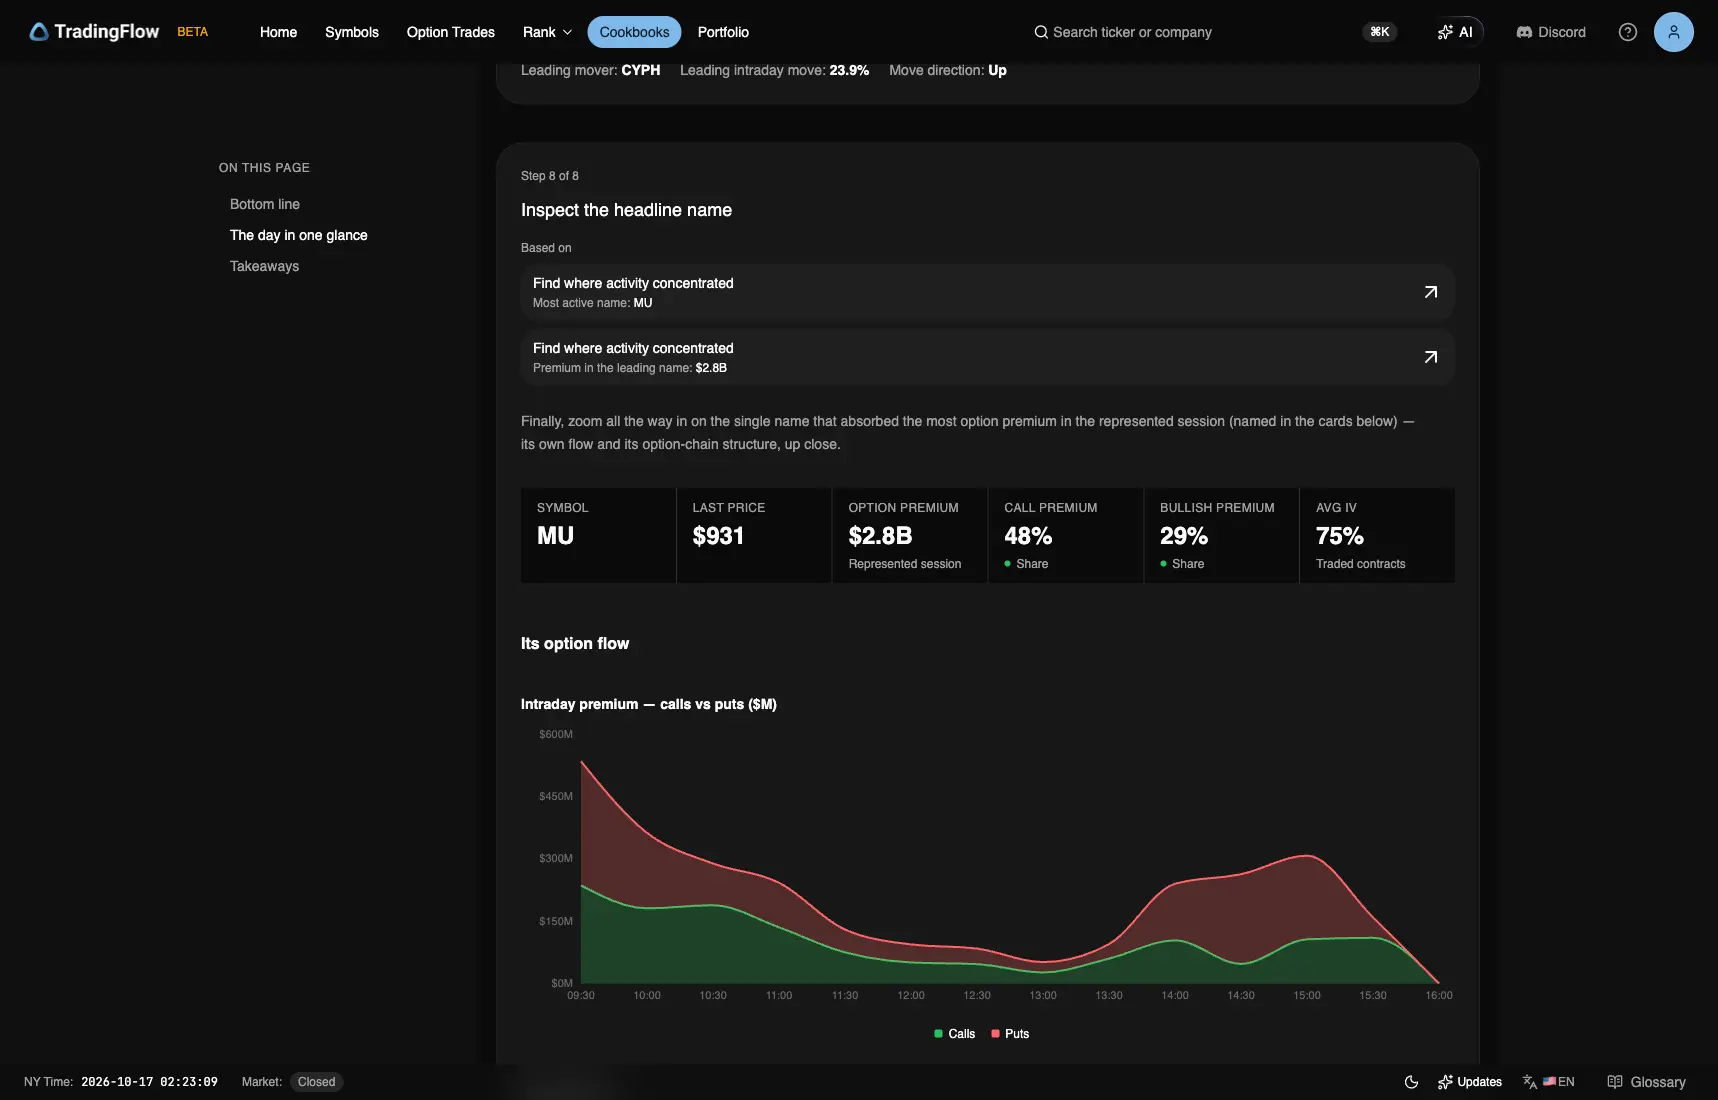
Test app, session 2026-10-15, Step 8. Captured October 16, 2026 (Pacific time).
Cards: last $931, premium $2.8B, 48% calls, 29% bullish, 75% average IV on traded contracts. The headline name is selected by premium, not by the largest price move.
| Time | Type | Strike | Expiry | Premium | Sentiment |
|---|---|---|---|---|---|
| 14:37 | PUT | 1,070 | 2026-10-16 | $42M | BULLISH |
| 15:22 | PUT | 1,060 | 2026-10-16 | $36M | BULLISH |
| 14:25 | PUT | 1,070 | 2026-10-16 | $36M | NEUTRAL |
| 14:37 | PUT | 1,100 | 2026-10-16 | $33M | BULLISH |
| 15:22 | PUT | 1,070 | 2026-10-16 | $28M | NEUTRAL |
| 14:37 | PUT | 1,100 | 2026-10-16 | $28M | NEUTRAL |
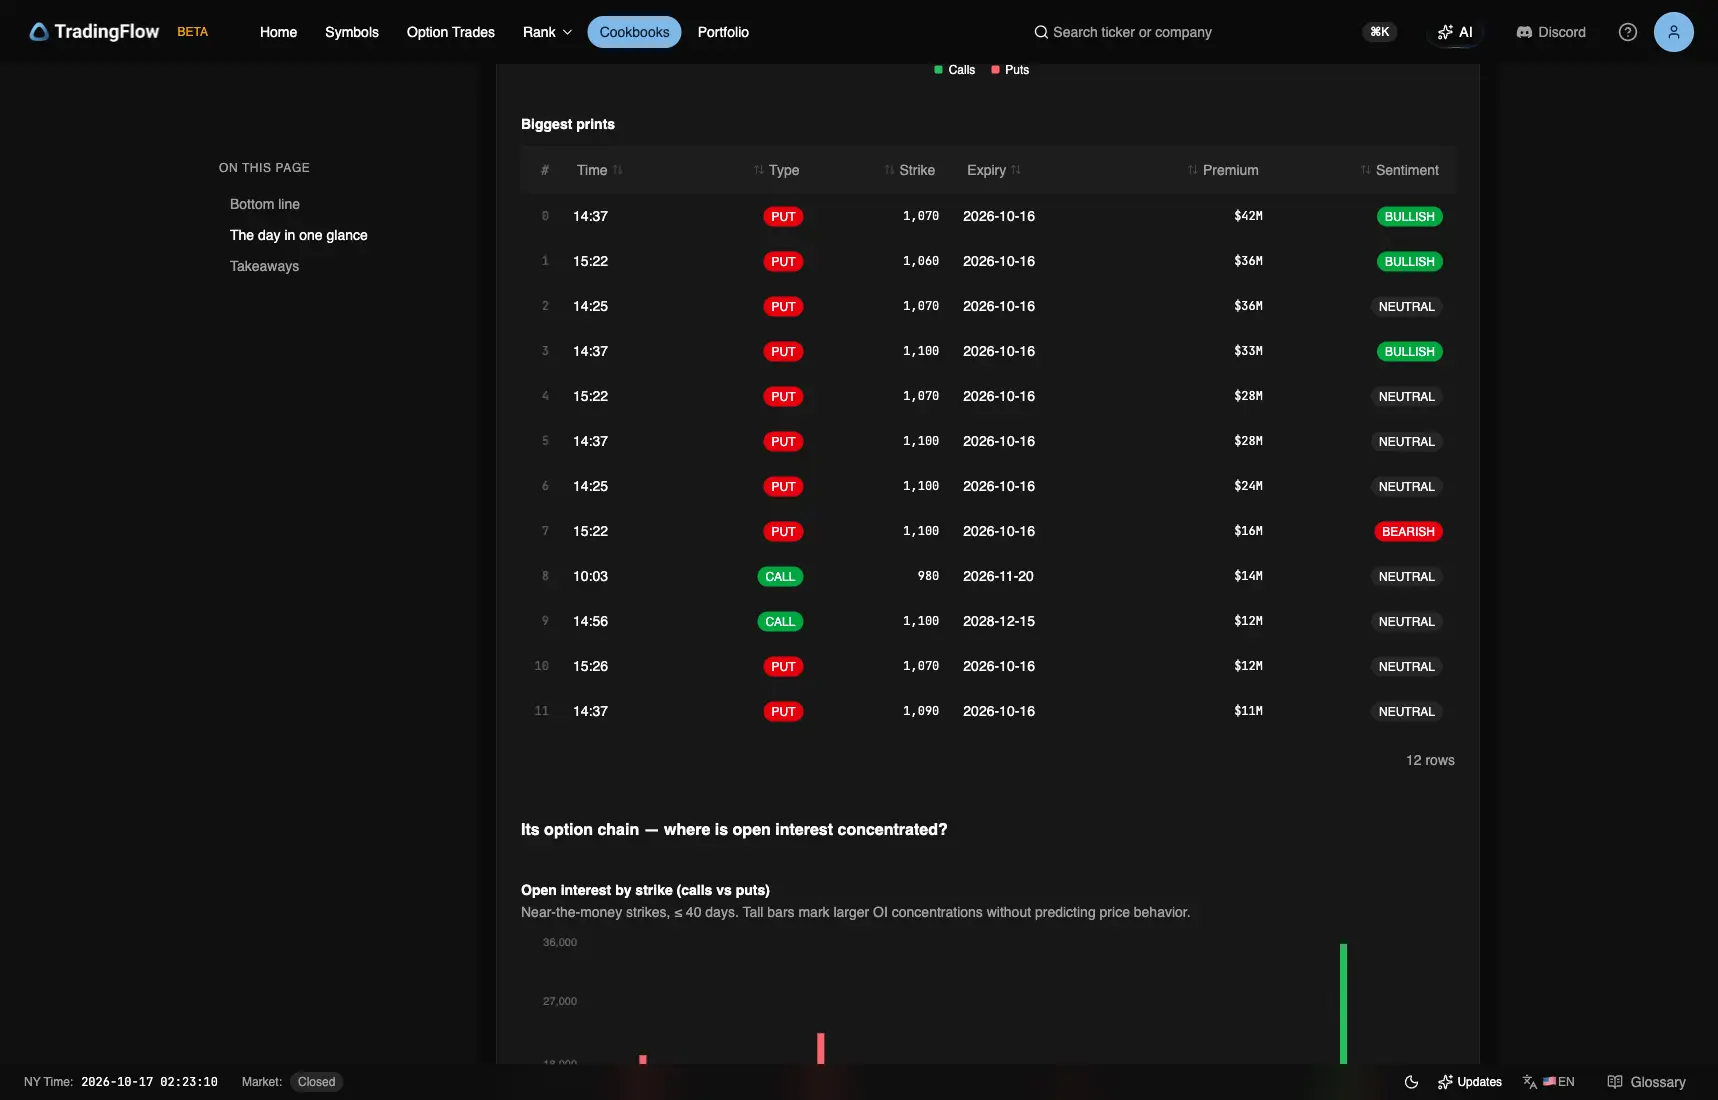
Test app, session 2026-10-15, Step 8 · prints. Captured October 16, 2026 (Pacific time).
The largest listed ticket was 14:37 1,070 PUT, expiry 2026-10-16, premium $42M, tagged BULLISH. The largest ticket was a Bullish put, followed by another Bullish put. The table also shows Neutral puts at nearby strikes and the same expiry. The report’s classification must be read separately from option type.
Ticket tags do not prove who bought or sold, whether a position opened, or whether adjacent prints form a single strategy.
Movers: CYPH +23.8%
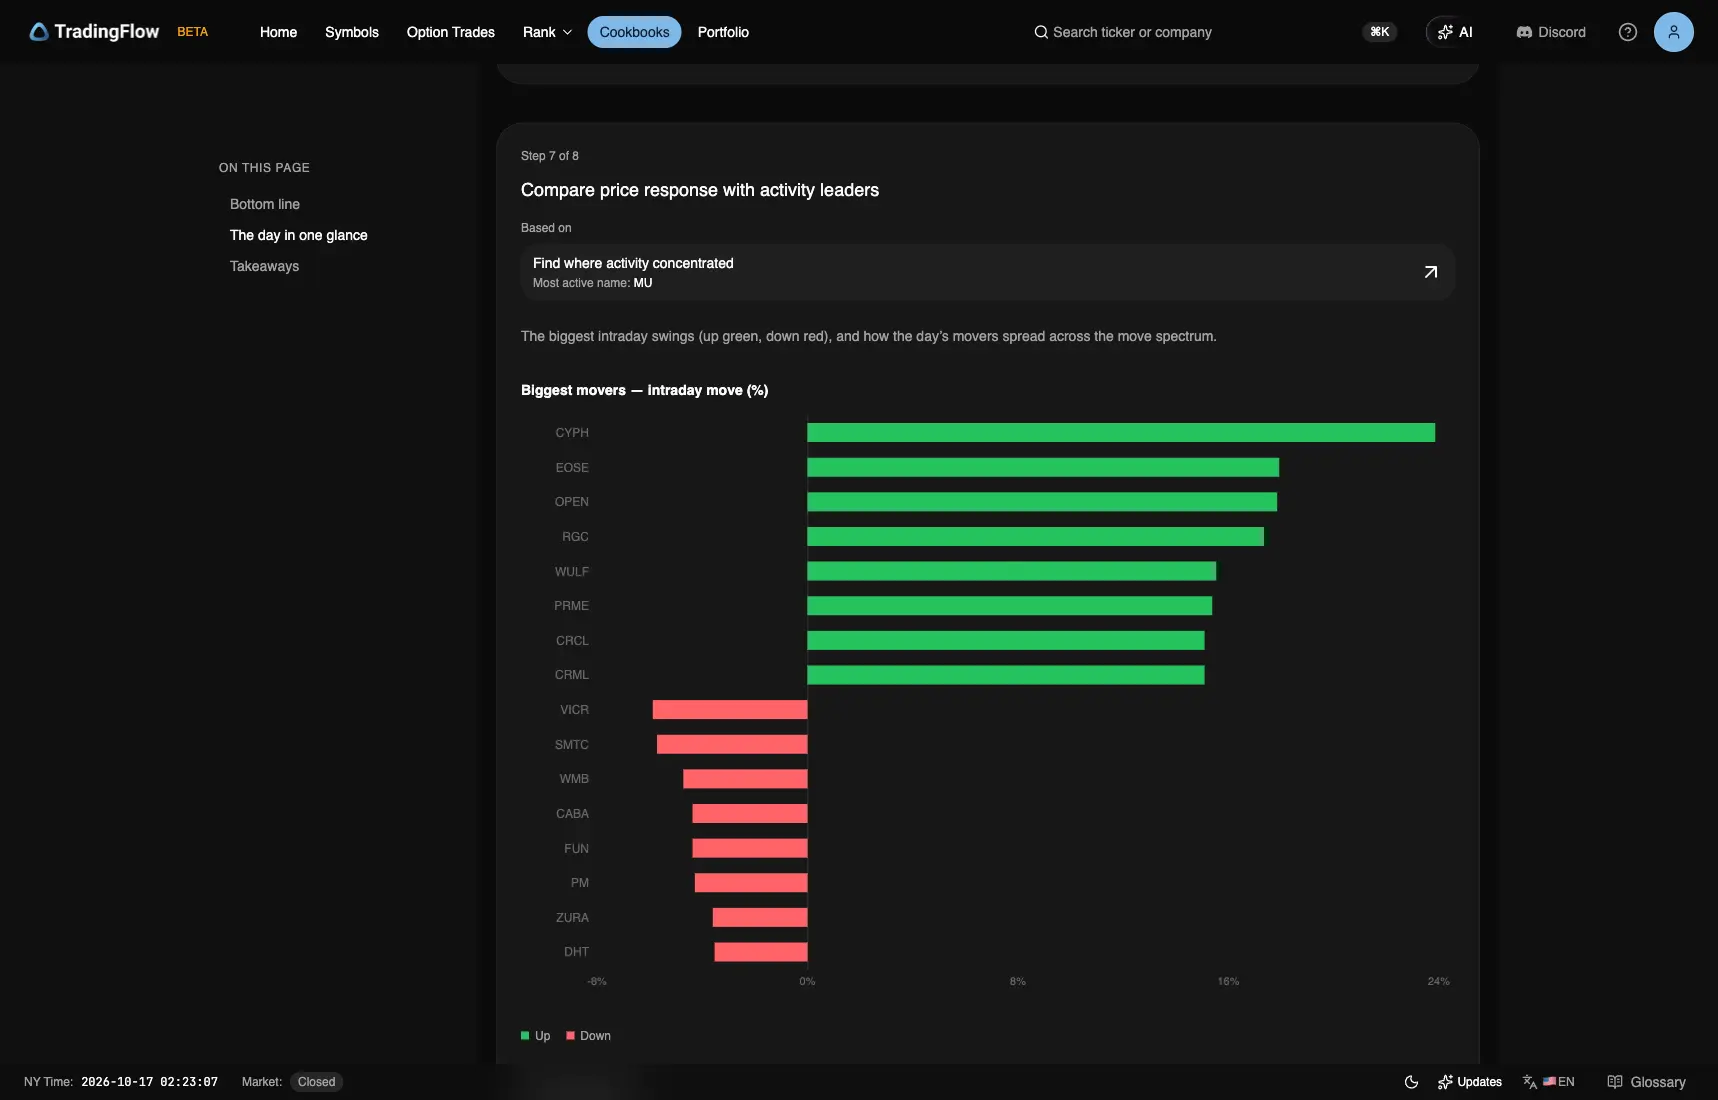
Test app, session 2026-10-15, Step 7. Captured October 16, 2026 (Pacific time).
Bottom line: CYPH +23.8%. Step 7 in both runs: CYPH 23.9%, Up. Keep both displayed fields. The bottom line names the largest gain; Step 7’s key can select a gain or loss across runs.
The intraday_pct reading is a first-to-last underlying-price proxy in the option tape. It is not an independently verified daily stock return, and movers do not prove flow causality.
What this session is evidence of
| Question | TradingFlow reading | Clock |
|---|---|---|
| Size / tone | $27.1B · 27% Bullish / 24% Bearish | Session tape |
| Concentration | MU $2.8B Bullish | Session leaders |
| Relative exposure | MU DEI 133% · DEX Positive | Session exposure |
| Volatility | RKLB IV rank 100 · IV 130.5% | T+1 |
| Index structure | SPX −13.69B Negative | T+1 |
| Largest print | MU 1,070 PUT 2026-10-16 $42M BULLISH | Session ticket |
Reproduce the findings
- Open the October 15 recap; confirm Oct 15, 2026 in the session KPI.
- Record the KPI strip and Step 1 sentiment before reading the leaders.
- Compare MU’s leaders-table tag, headline cards, and largest ticket.
- Read Steps 4–6 separately: exposure magnitude, volatility rank, and all six index GEX rows.
- Keep both mover fields, the session date, and the snapshot clock. Stop before turning a report into a buy/sell instruction.
TradingFlow App Home → Cookbooks → Daily Market Recap → select the completed session.
Related reading
Related Articles
October 14 Recap: Leaned Bearish, MU $2.0B Bearish, SPX GEX Negative
$17.9B in single-name premium, 25% bullish versus 27% bearish. MU led at $2.0B Bearish; SPX GEX was −$105.30B.
October 13 Recap: Leaned Bearish, MU $3.0B Bearish, SPX GEX Positive
$16.9B in single-name premium, 22% bullish versus 24% bearish. MU led at $3.0B Bearish; SPX GEX was +$103.41B.
October 12 Recap: Leaned Bearish, MU $1.5B Mixed, SPX GEX Positive
$14.2B in single-name premium, 22% bullish versus 24% bearish. MU led at $1.5B Mixed; SPX GEX was +$61.43B.