November 12 Recap: NVDA Opens $14 Under Its Priced Range and Closes Back Inside
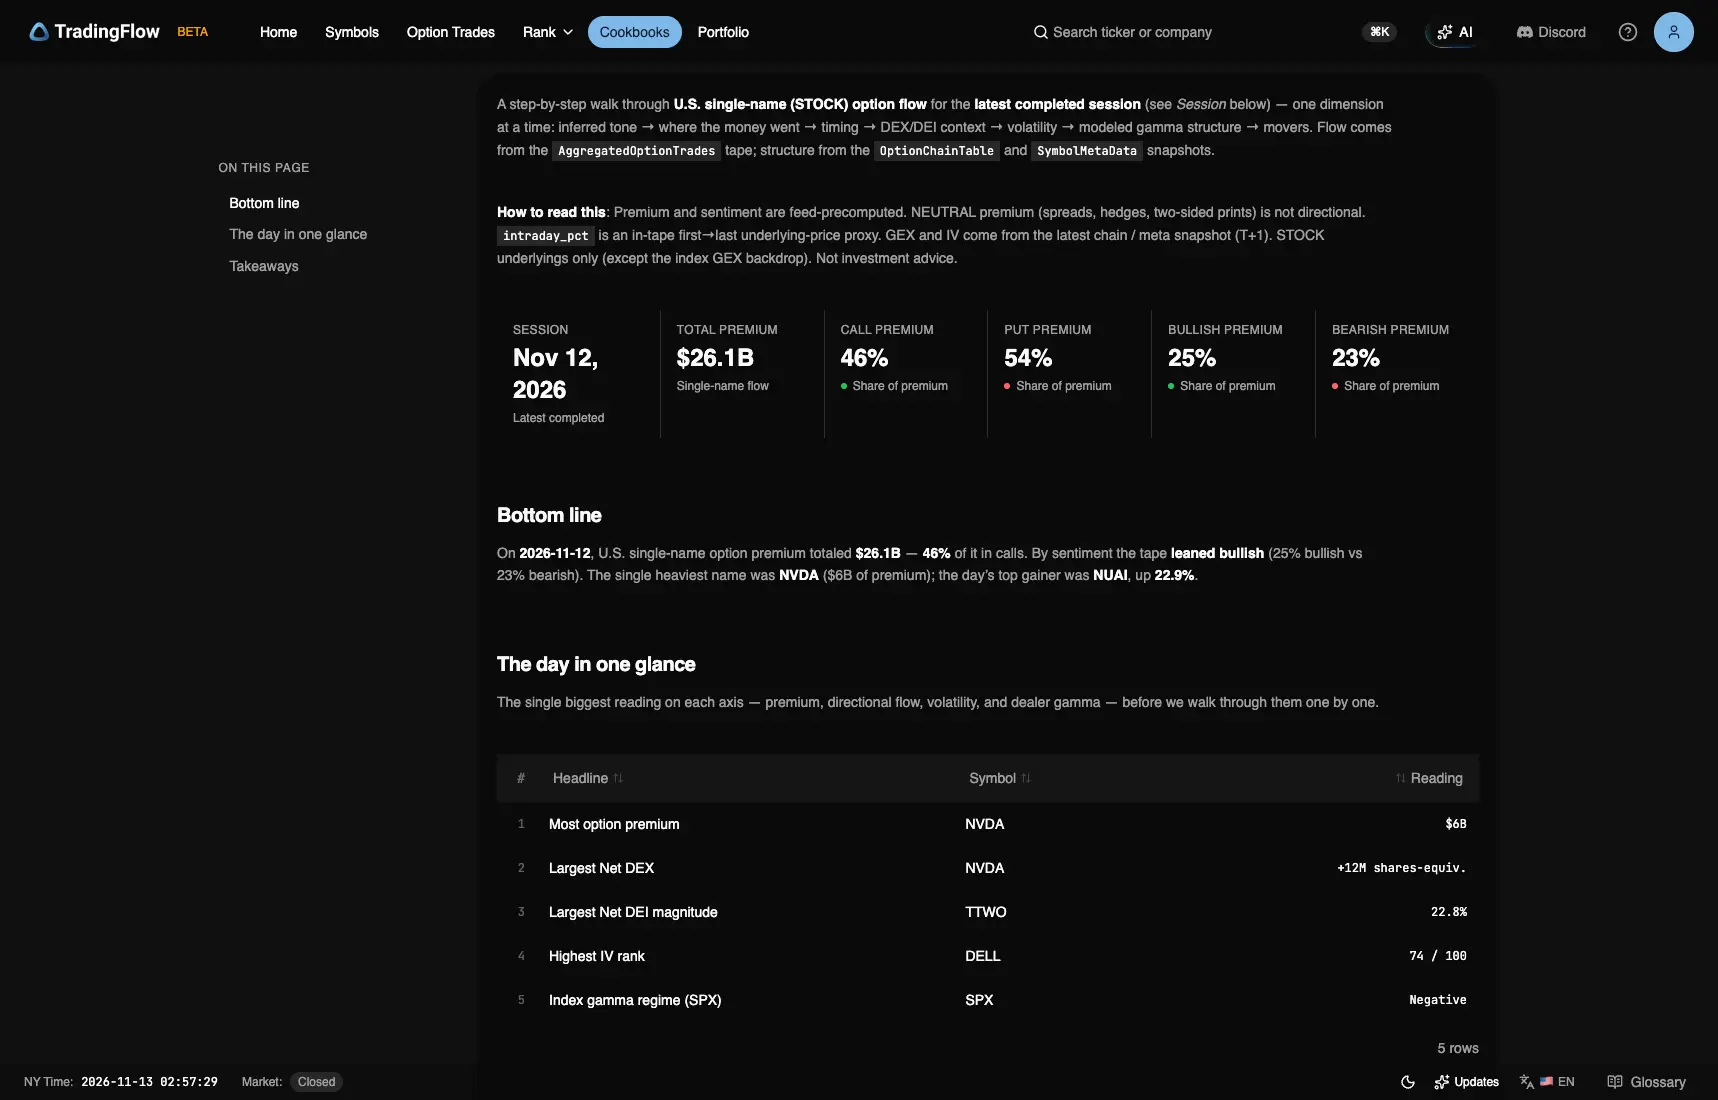
$26.1B in single-name premium, 25% bullish versus 23% bearish. NVDA led at $6.0B Bullish; SPX GEX was −$15.87B.

NVDA opened at 151.00 on November 12, 13.07% under Wednesday's close and $14.04 under the bottom of the range Wednesday's chain priced through Friday. It traded down to 148.80, then closed at 166.20, $1.16 back inside that range and 4.32% lower on the day, on 738.34M shares. The indexes moved far less: SPX closed at 7,592.40, down 27.00 points and about half of what its options priced for the day, and 8.21 under the gamma flip built on Wednesday. NBIS fell 16.87% after its report, a hair more than its options priced through Friday. Single-name premium was $26.1B, 54% of it in puts, NVDA took $6.0B of it, and all six rows of the recap's index table read Negative.
$26.1B, 46% calls, 25% bullish versus 23% bearish. NVDA led at $6.0B Bullish; SPX's near-dated GEX read −15.87, against +40.26 on November 11.
Open Daily Market Recap or the November 12 session. Sign-in and a paid entitlement may be required.
This edition's figures in 45 seconds. The numbers match the tables below.
Did NVDA move more than its options priced?
Notes before the open had NVDA down more than 7% in pre-market trading, and one after the open had its one-week implied vol up about 12 points. NVDA has no Thursday expiry, so the nearest test is Wednesday's chain for Friday, November 13, two days out, against Thursday's bar:
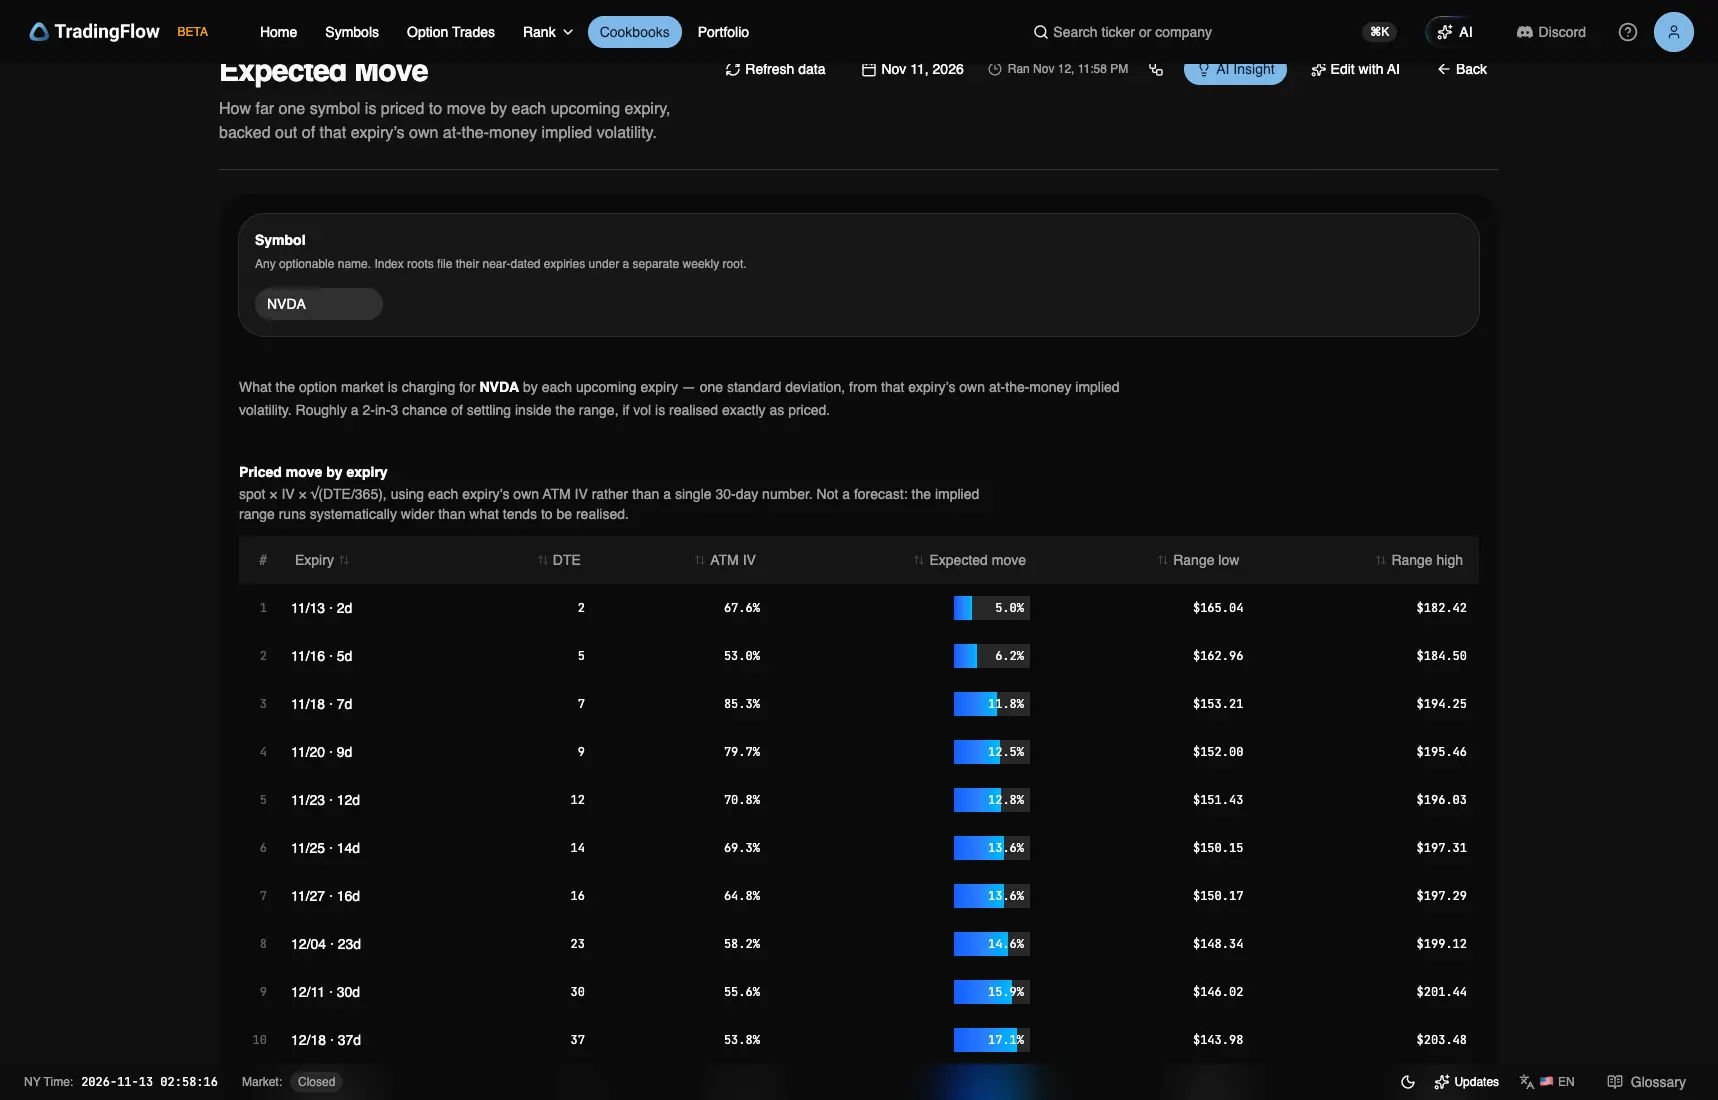
Test app, Cookbooks · Expected Move · NVDA, session 2026-11-11. Captured November 13, 2026 (New York time); the Ran stamp is the capture machine's clock.
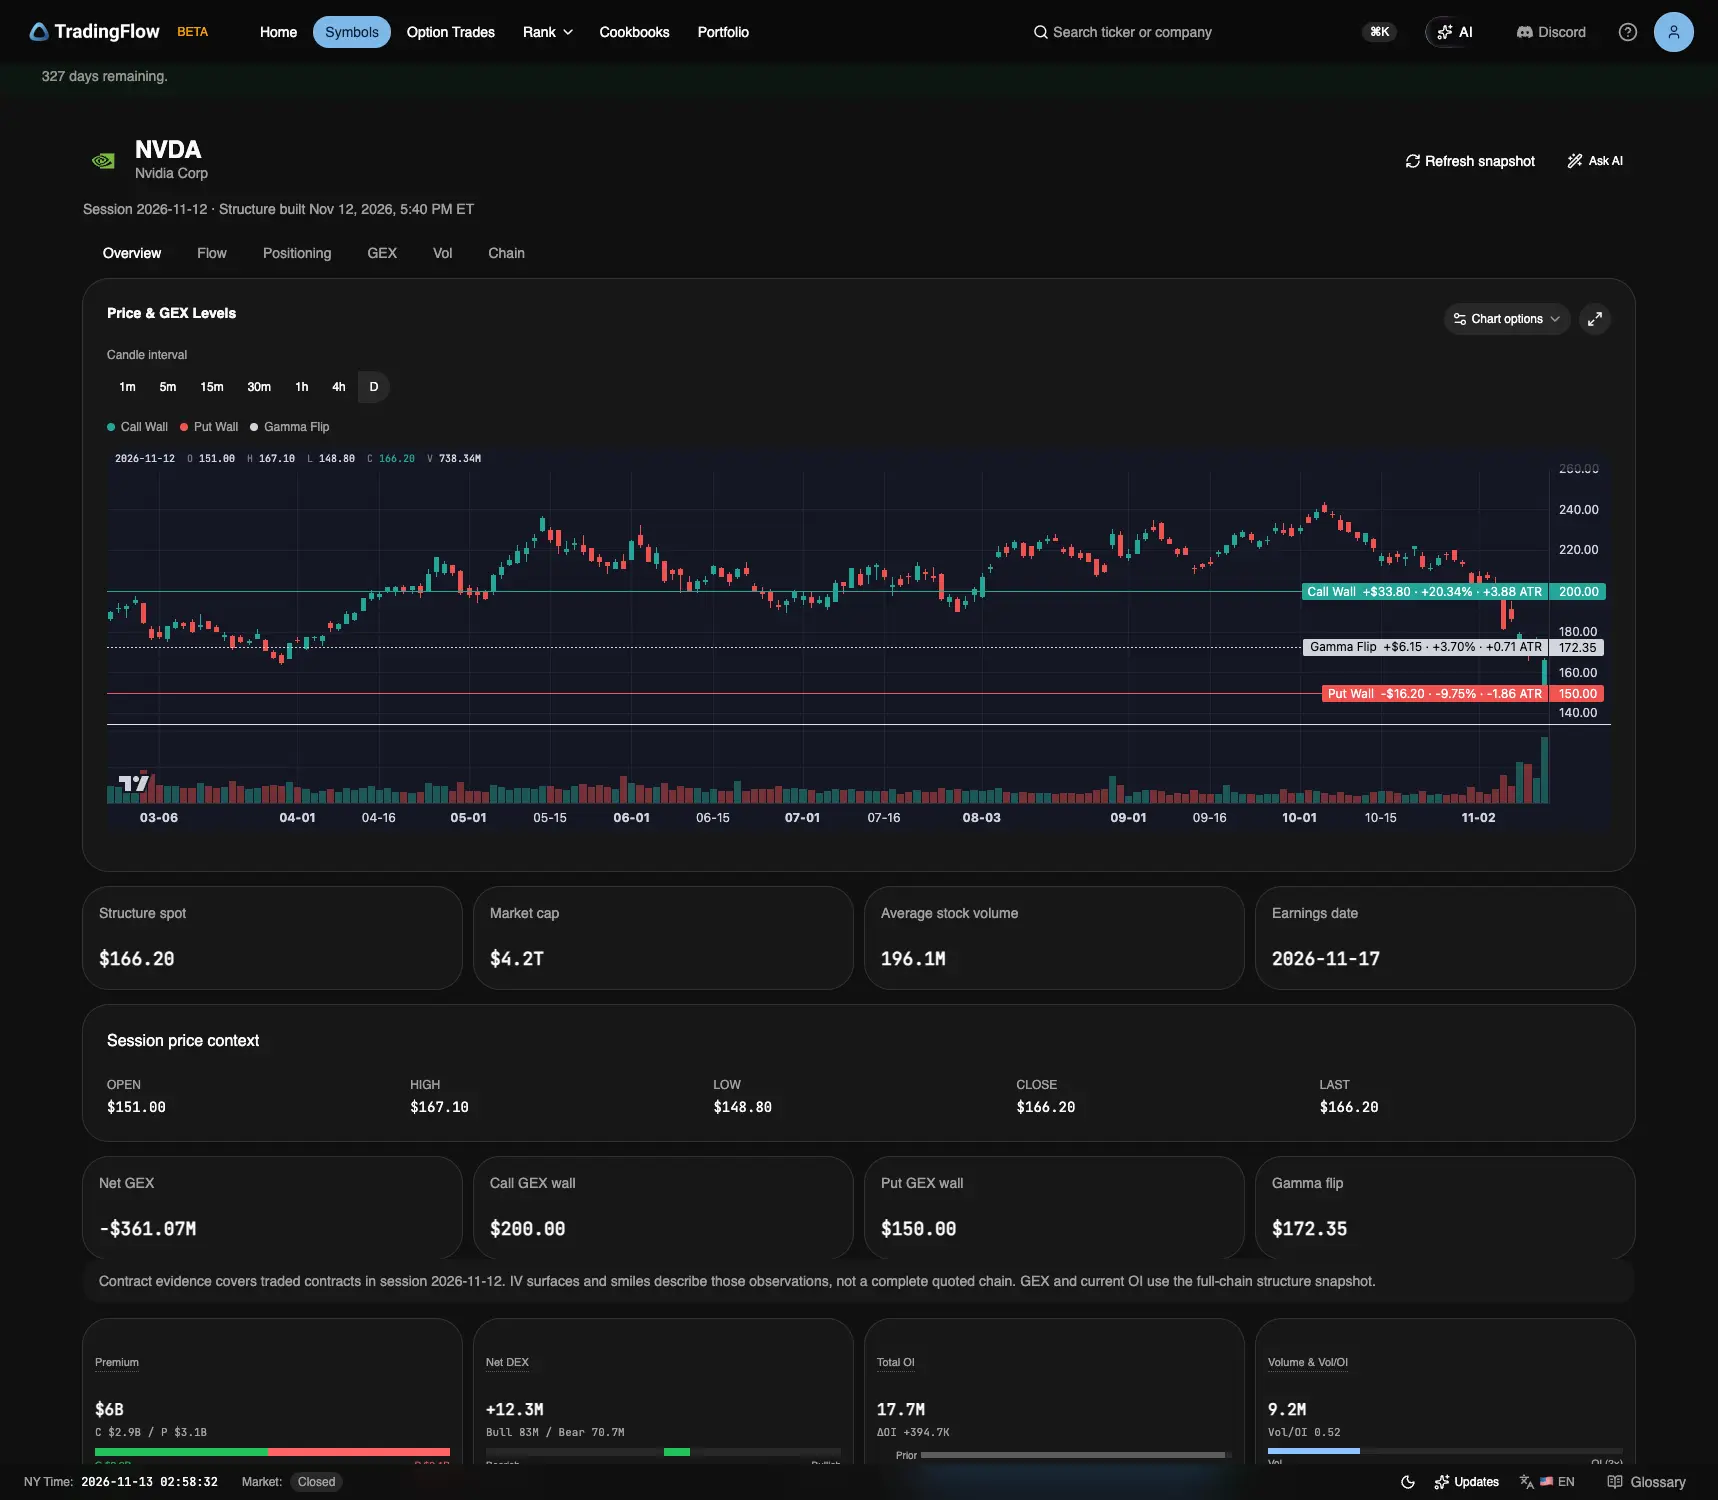
Test app, Symbols · NVDA · Overview, session 2026-11-12. Captured November 13, 2026 (New York time).
| Reading | NVDA |
|---|---|
| Nov 11 close | 173.70 |
| Priced to Nov 13, two days, Nov 11 chain | ±5.0% · 165.04–182.42 · ATM IV 67.6% |
| Priced to Nov 20, nine days, Nov 11 chain | ±12.5% · 152.00–195.46 |
| Put wall / gamma flip, built Nov 11 | 165 / 171.79 |
| Net GEX (all expirations), built Nov 11 → Nov 12 | −$859.41M → −$361.07M |
| Nov 12 open | 151.00, −13.07% |
| Open against the two-day range | $14.04 under the bottom |
| Nov 12 low · high | 148.80 · 167.10 |
| Nov 12 close | 166.20, −4.32% |
| Close against the two-day range | $1.16 inside |
| Close to close against half the range | 0.86× |
| Volume | 738.34M, against 267.96M on Nov 11 |
| Premium (Step 2) | $6.0B, first · $2.9B calls / $3.1B puts · Bullish |
| Put wall / gamma flip, built Nov 12 | 150 / 172.35 |
| Earnings date (Overview) | 2026-11-17 |
Partly supported. At the open the answer was yes by a wide margin: 151.00 is $14.04 under the bottom of the two-day range and $14.00 under the 165 put wall built on Wednesday, and it is $1.00 under the bottom of the nine-day range to November 20 as well. The low, 148.80, was $16.24 under the two-day range. By the close the answer was no: NVDA gained 11.69% from its low, finished at 166.20, $1.16 above the range's bottom and $1.20 above that put wall, and its close-to-close fall of 4.32% is 0.86 times half the range. The daily bar cannot say when the low printed or how fast the recovery ran. The range is a two-day reading tested against one session, so Friday still counts toward it. It is also the call side's reading: Expected Move takes its at-the-money IV from the near-the-money calls, and the test app's Symbols pages no longer served Wednesday's chain, so the put side could not be checked. Clock: Wednesday's closing chain and prior-close structure against the session's daily bar.
The evening rebuild put NVDA's put wall at 150, $1.20 above the day's low, and its flip at 172.35, $6.15 above the close; that structure was built after the session and describes where the day ended. The recap's Step 7 lists NVDA among the day's gainers, because its move there runs from the first to the last price inside the session, 151.00 to 166.20, not from Wednesday's close.
Did SPX get back above its 7,600 flip?
Notes before the open had SPX under a gamma flip they put between 7,600.80 and 7,611, with put walls from 7,500 to 7,600 and call walls from 7,635 up; one priced the day at ±61 points and another at ±83. Here is Thursday's bar against the structure built after Wednesday's close and against Wednesday's chain:
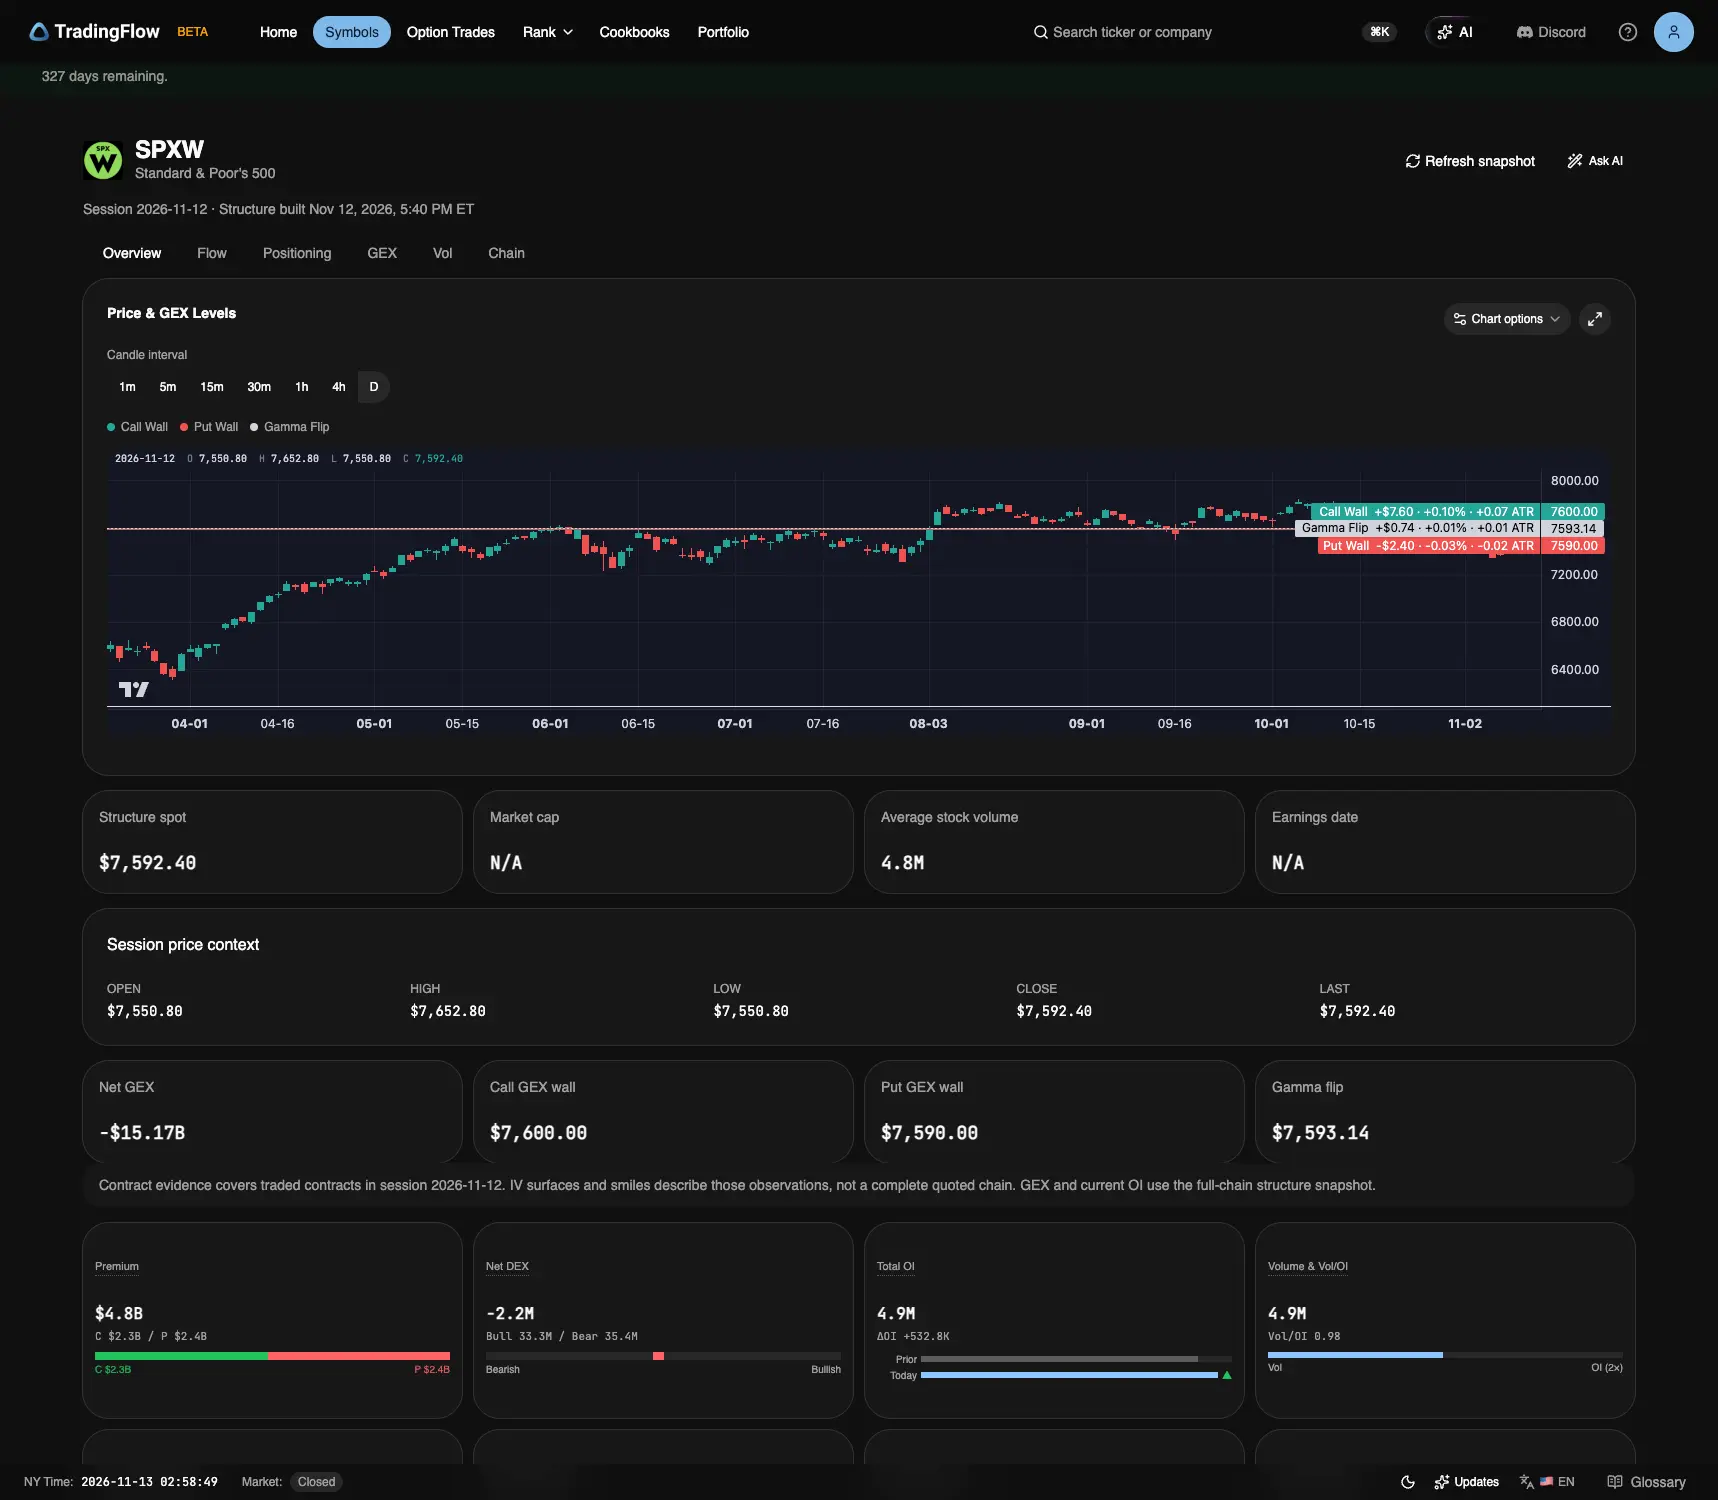
Test app, Symbols · SPXW · Overview, session 2026-11-12. Captured November 13, 2026 (New York time). The levels drawn are the November 12 evening build; this bar opens at its own low, so the text quotes SPX's close only.
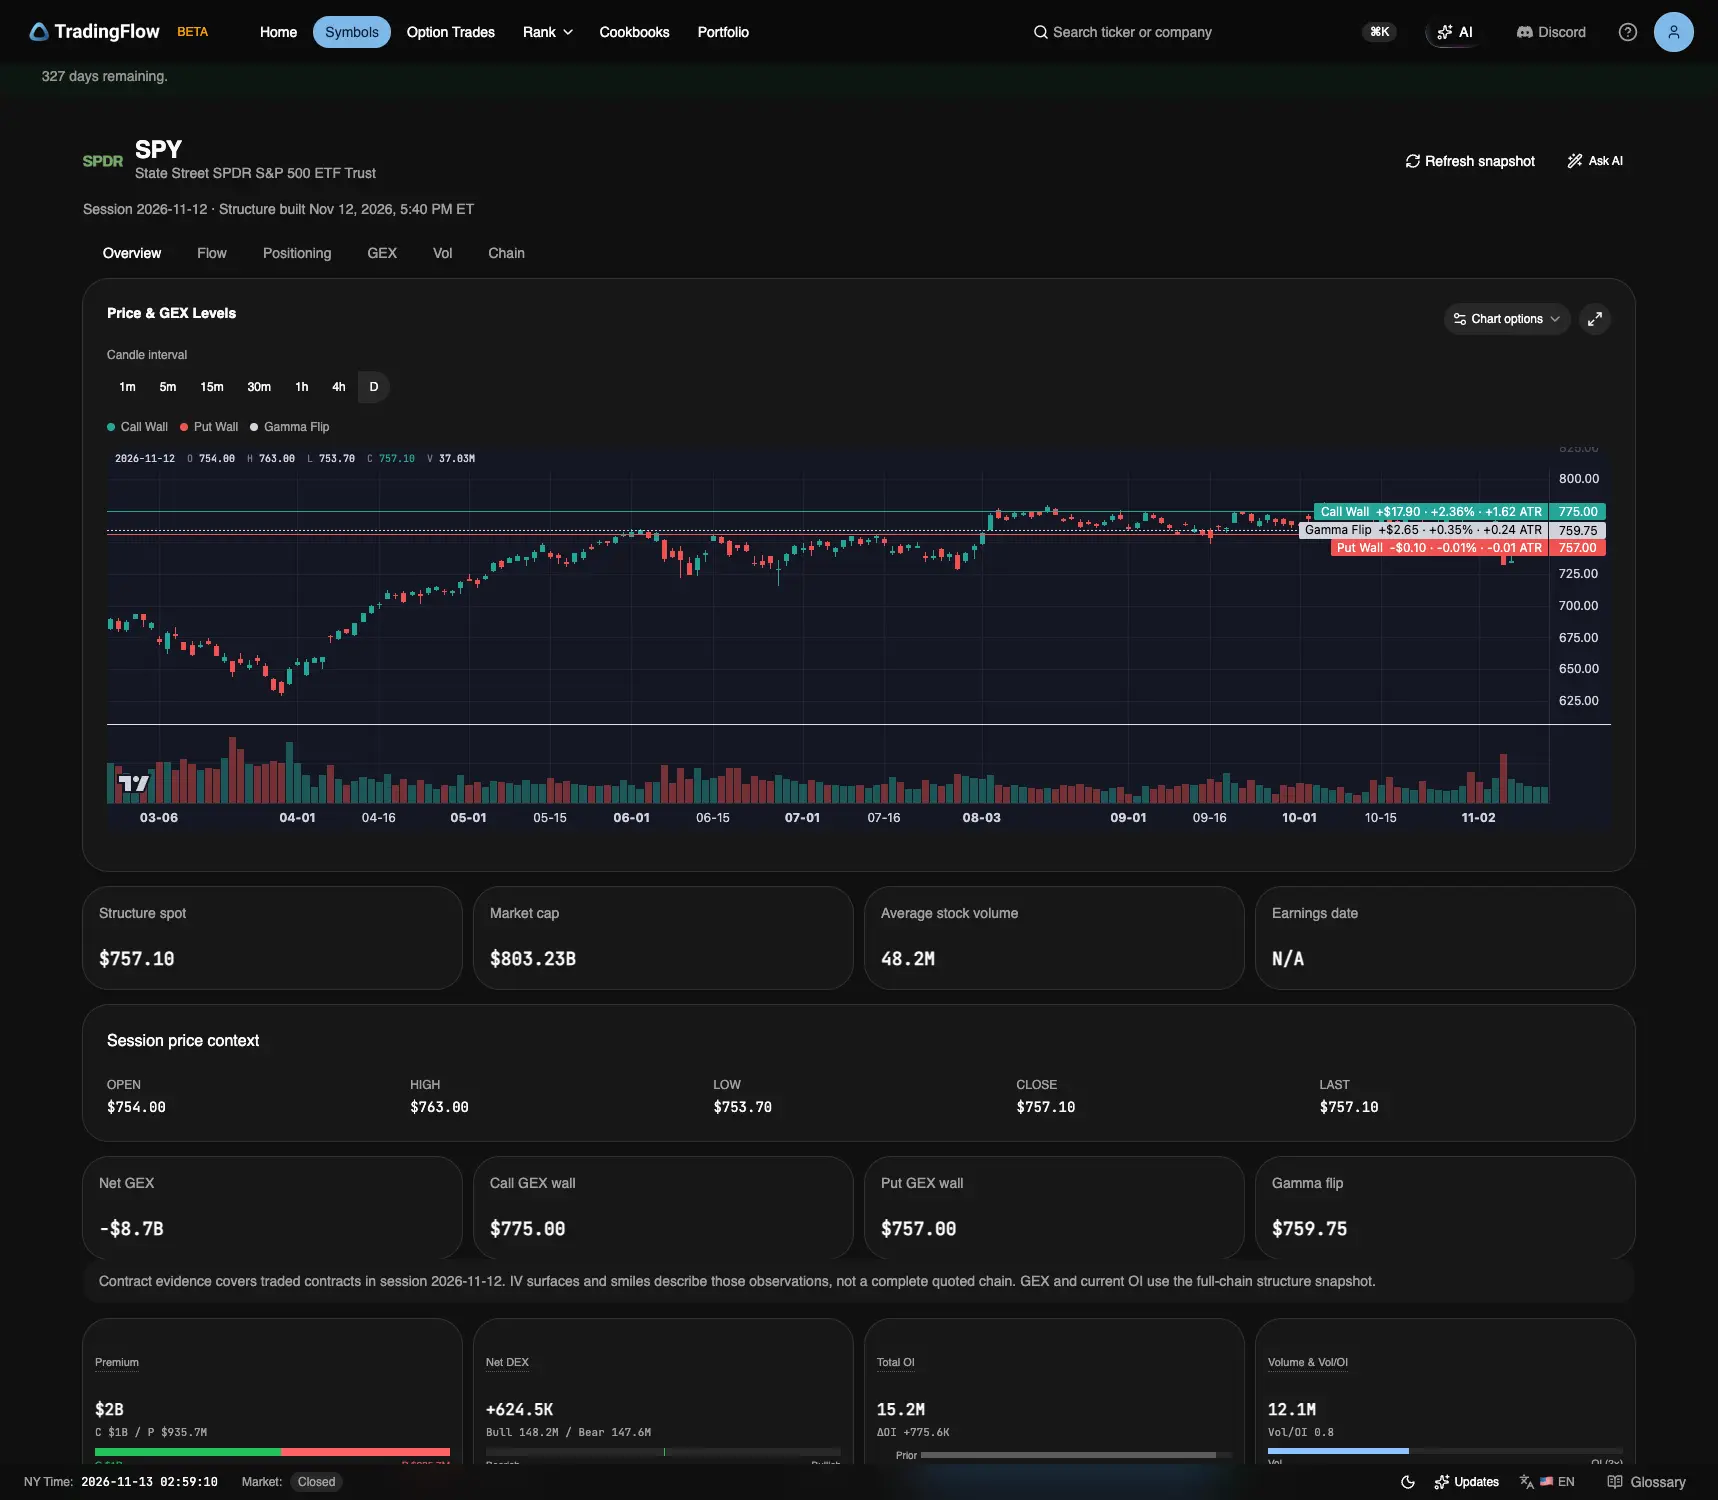
Test app, Symbols · SPY · Overview, session 2026-11-12. Captured November 13, 2026 (New York time). The levels drawn are the November 12 evening build.
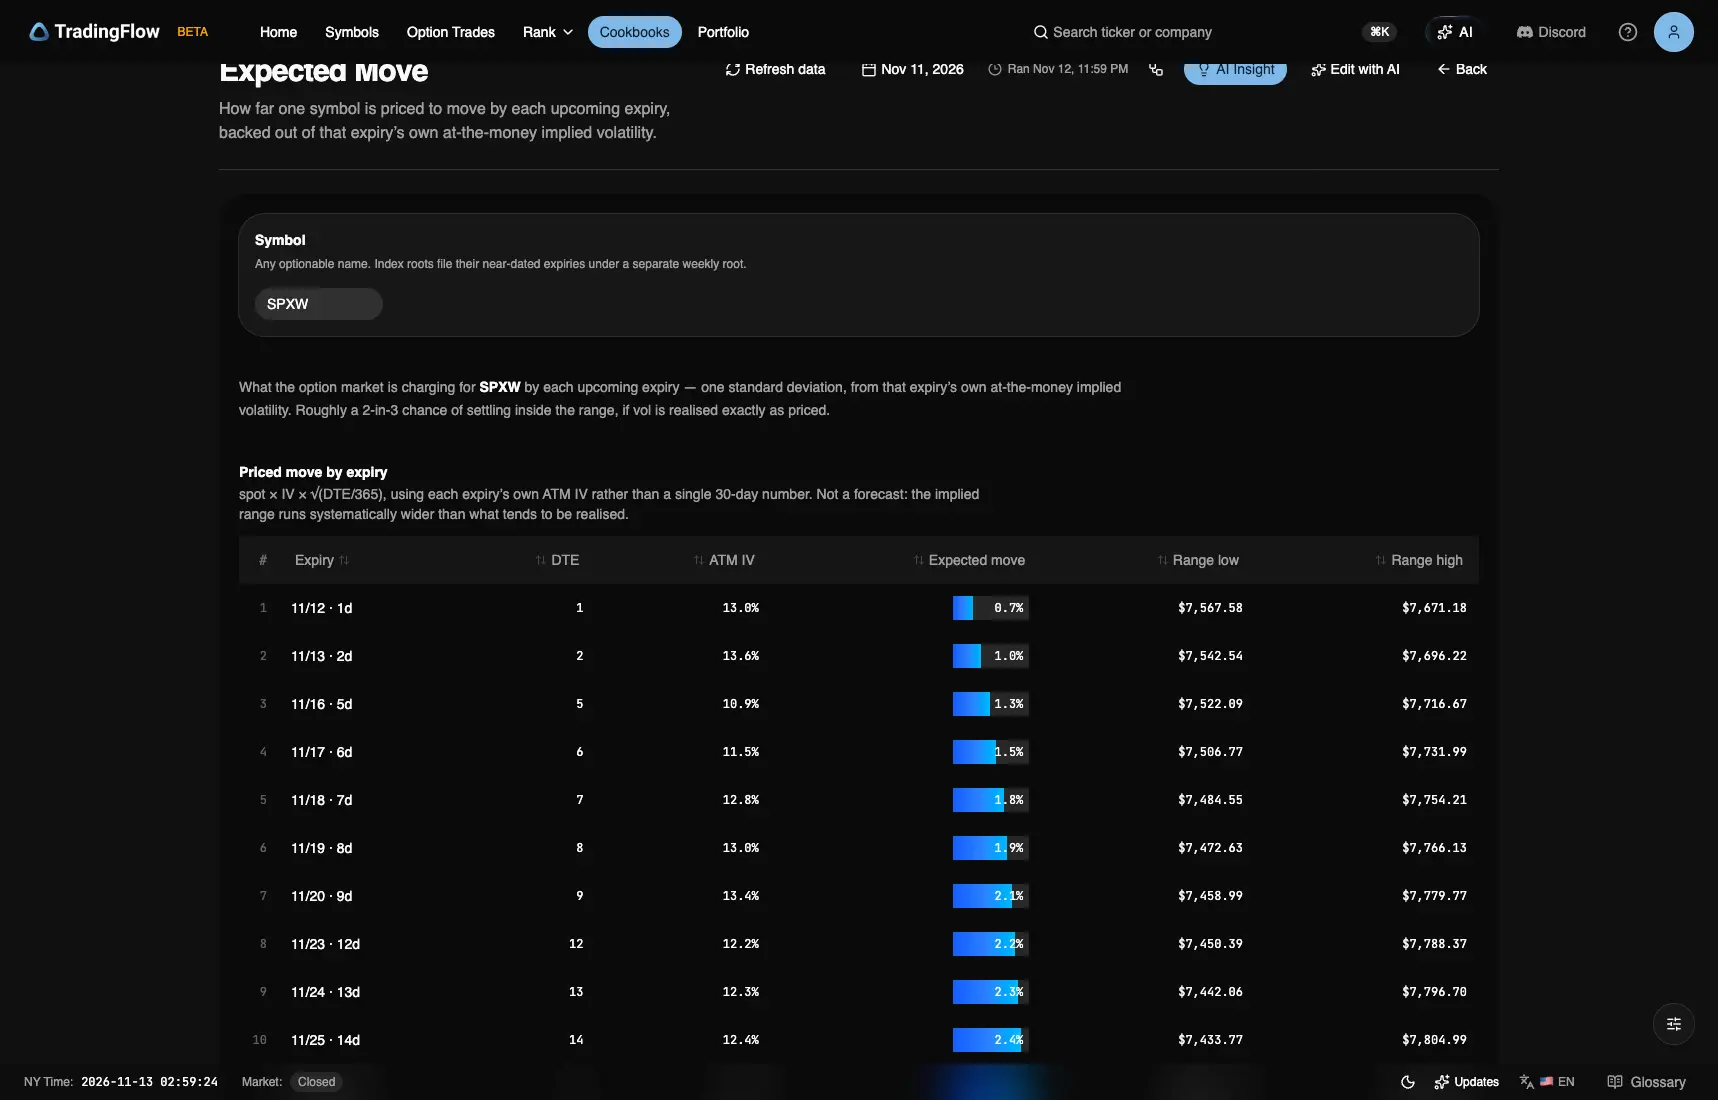
Test app, Cookbooks · Expected Move · SPXW, session 2026-11-11. Captured November 13, 2026 (New York time); the Ran stamp is the capture machine's clock.
| Reading | SPX (SPXW page) | SPY | QQQ |
|---|---|---|---|
| Put wall / call wall, built Nov 11 | 7,600 / 7,620 | 750 / 760 | 680 / 700 |
| Gamma flip, built Nov 11 | 7,600.61 | 758.40 | 688.71 |
| Nov 11 close | 7,619.40 | 759.80 | 690.40 |
| Priced range for Nov 12, Nov 11 chain | ±0.7% · 7,567.58–7,671.18 | ±0.9% · 752.97–766.15 | ±1.3% · 681.48–699.32 |
| Nov 12 open | Not quoted | 754.00 | 680.30 |
| Open against that flip | Not quoted | $4.40 under | $8.41 under |
| Nov 12 low · high | Not quoted | 753.70 · 763.00 | 679.80 · 694.60 |
| High against that flip | Not quoted | $4.60 above | $5.89 above |
| Nov 12 close | 7,592.40 | 757.10 | 688.20 |
| Close against that flip | 8.21 under | $1.30 under | $0.51 under |
| Close to close against half the range | 0.52× | 0.41× | 0.25× |
| Gamma flip, built Nov 12 | 7,593.14 | 759.75 | 691.05 |
| Put wall / call wall, built Nov 12 | 7,590 / 7,600 | 757 / 775 | 688 / 700 |
| Net GEX (all expirations), built Nov 11 → Nov 12 | +$48.3B → −$15.17B | −$249.15M → −$8.7B | −$1.21B → −$6.59B |
| Today · 0DTE share of gross GEX, built Nov 12 | 17.4% | 14.2% | 17.7% |
| Near-dated net GEX (Step 6), Nov 12 | −15.87, Negative | −4.04, Negative | −3.77, Negative |
Partly supported. All three closed under Wednesday's flips, SPX by 8.21, SPY by $1.30 and QQQ by $0.51, so the day ended on the short-gamma side the notes described. It did not stay there throughout: SPY opened $4.40 under its flip and traded $4.60 above it, to 763.00, $3.00 over Wednesday's 760 call wall, and QQQ opened $8.41 under and traded $5.89 above. On the downside, SPY's low held $3.70 above its 750 put wall, and QQQ's low, 679.80, went $0.20 through its 680 put wall before the close came back to 688.20. One note's flip, 7,600.80, sits 0.19 from TradingFlow's 7,600.61; the 7,635 and higher call walls and the 7,500 to 7,565 put walls are not on TradingFlow's map. Clock: the session's daily bars against the prior-close structure.
The priced ranges held at the close. SPX fell 27.00 points, 0.52 times half its range, and finished 24.82 above the bottom; SPY stayed inside its range all day, with a low $0.73 above the bottom; QQQ opened $1.18 under its bottom, went $1.68 under at the low, and closed $6.72 inside. Half of SPX's range is 51.80 points, narrower than the ±61 and ±83 in the notes, and a 27.00-point close-to-close move is inside all three. SPY's low was 0.80% under Wednesday's close, which is the size of the ±61 note's 0.80%. Clock: Wednesday's closing chain and the session's daily bars.
The evening rebuild turned SPX's all-expirations reading from +$48.3B to −$15.17B and set its walls 10 points apart, 7,590 and 7,600, around a 7,593.14 flip, 0.74 above the close; 17.4% of its gross GEX sits in the November 12 expiry, which ended at that close. SPY and QQQ moved from near flip to −$8.7B and −$6.59B. Clock: built at 5:40 PM ET after the session.
Did NBIS move more than its options priced for the report?
Notes before the open had NBIS's report priced at a 13% to 17% move. NBIS has no Thursday expiry either, so the test is Wednesday's chain for Friday, November 13:
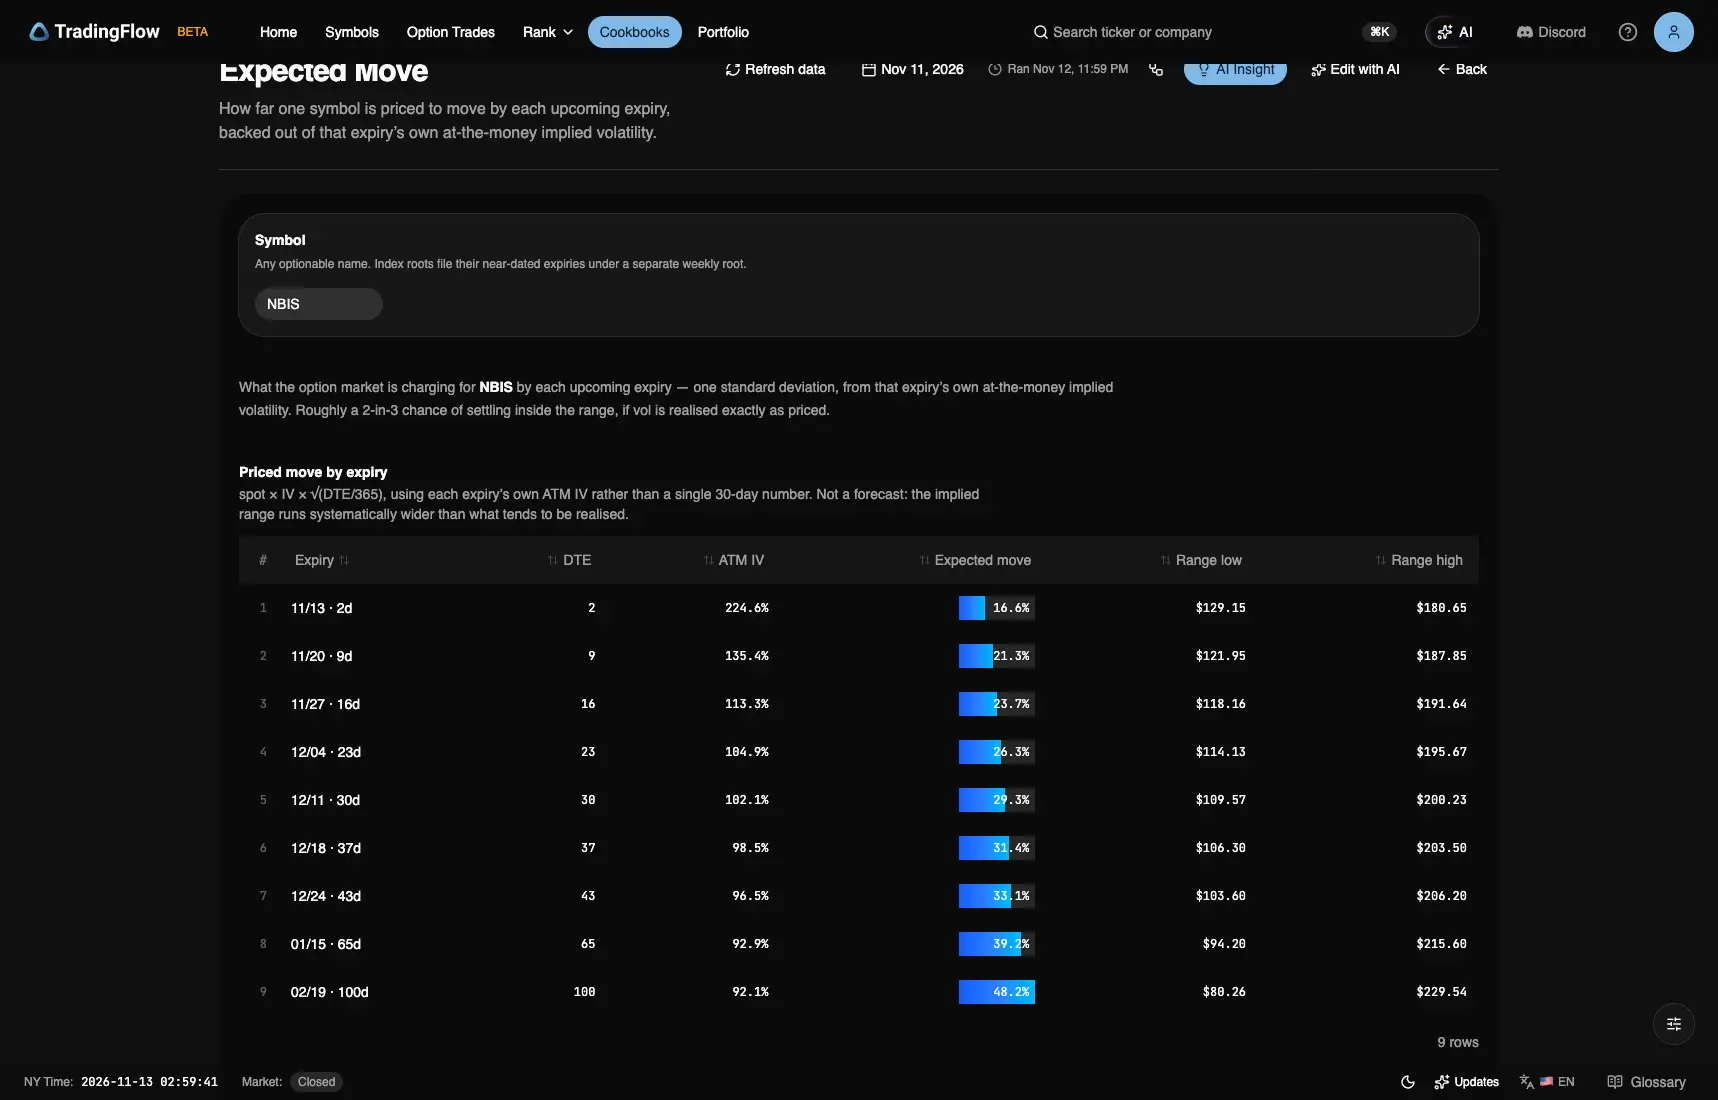
Test app, Cookbooks · Expected Move · NBIS, session 2026-11-11. Captured November 13, 2026 (New York time); the Ran stamp is the capture machine's clock.
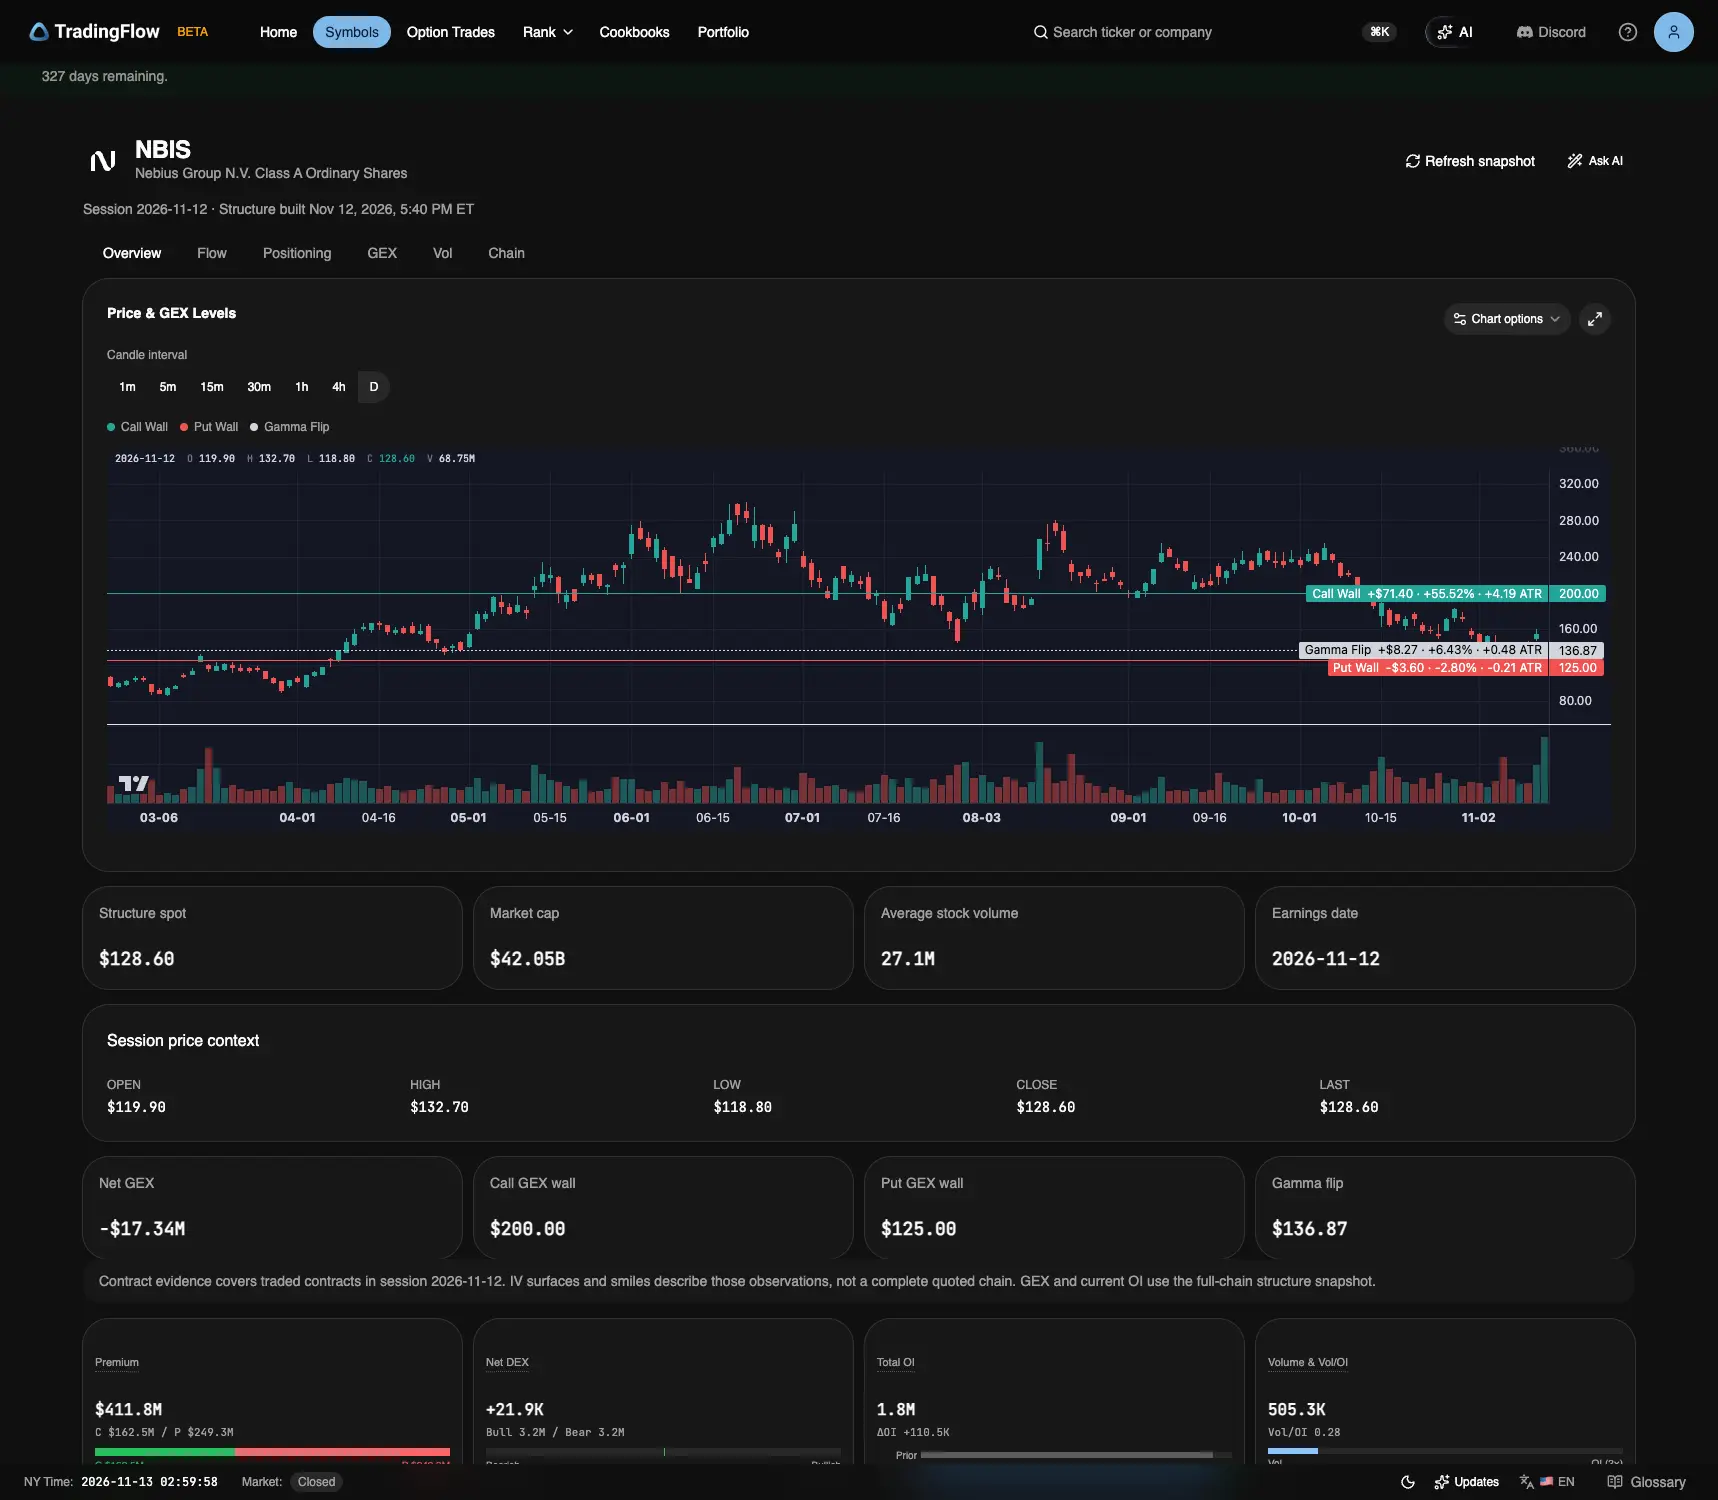
Test app, Symbols · NBIS · Overview, session 2026-11-12. Captured November 13, 2026 (New York time).
| Reading | NBIS |
|---|---|
| Earnings date (Overview) | 2026-11-12 |
| Nov 11 close | 154.70 |
| Priced to Nov 13, two days, Nov 11 chain | ±16.6% · 129.15–180.65 · ATM IV 224.6% |
| Nov 12 open | 119.90, −22.50% |
| Nov 12 low · high | 118.80 · 132.70 |
| Nov 12 close | 128.60, −16.87% |
| Close against the two-day range | $0.55 under the bottom |
| Premium (Step 2) | $412M, thirteenth · $162M calls / $249M puts · Mixed |
| ATM IV, Nov 13 expiry, Nov 11 → Nov 12 chain | 224.6% → 145.6% |
| ATM IV, Nov 20 expiry, Nov 11 → Nov 12 chain | 135.4% → 106.7% |
Supported, narrowly. NBIS closed $0.55 under the bottom of the range, a 16.87% fall against ±16.6%, and the open was much further out: 119.90, $9.25 under the bottom and 22.50% lower. It recovered $8.70 of that by the close. ±16.6% sits at the top of the notes' 13% to 17%. Two cautions apply. The range is a two-day reading tested against one session, and it is the call side's reading; on a report chain the puts can price a different range, as CRWV's did on November 10, and the test app's Symbols pages no longer served Wednesday's chain to check. The event premium then came out: Thursday's chain prices the November 13 expiry at 145.6%, against 224.6% the evening before, and Friday at ±7.6%. Clock: Wednesday's closing chain, the session's daily bar, and Thursday's closing chain.
The session in numbers
What the recap printed
Test app, session 2026-11-12, KPI. Captured November 13, 2026 (New York time).
| Reading | Recap value |
|---|---|
| Single-name premium | $26.1B |
| Call / Put | 46% / 54% |
| Bullish / Bearish | 25% / 23% |
| Overall tone | leaned bullish |
| First 30-minute window | 09:30 · $4.0B |
Sentiment bars: Neutral $13.6B, Bullish $6.6B, Bearish $5.9B.
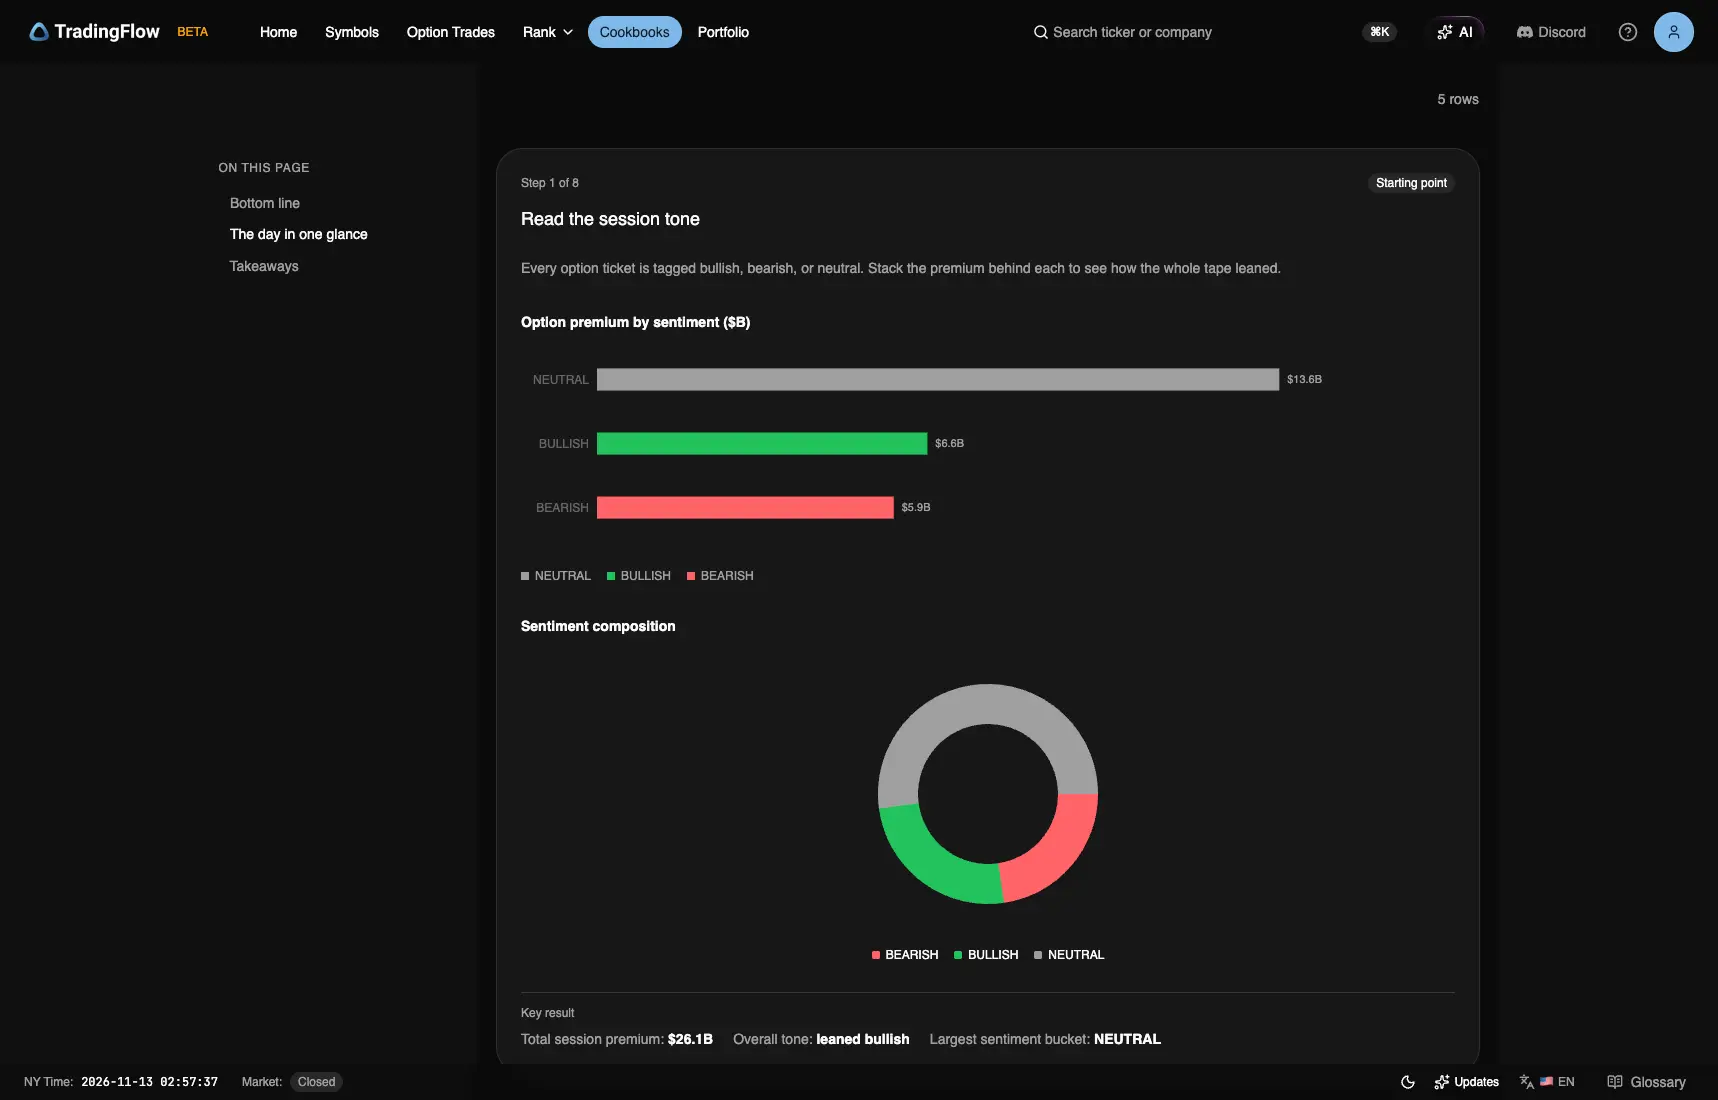
Test app, session 2026-11-12, Step 1. Captured November 13, 2026 (New York time).
What changed since November 11
| Reading | Nov 11 | Nov 12 |
|---|---|---|
| Single-name premium | $19.2B | $26.1B |
| Call / Put | 64% / 36% | 46% / 54% |
| Bullish / Bearish | 21% / 20% | 25% / 23% |
| Tone | leaned bullish | leaned bullish |
| Leader | MU $3.5B Mixed | NVDA $6.0B Bullish |
| SPX net GEX ($B) | 40.26 Positive | −15.87 Negative |
| QQQ net GEX ($B) | 1.6 Positive | −3.77 Negative |
| Negative index rows | DIA 0 only | All six |
| Largest headline-name ticket | MU 880 CALL 2027-02-19 $62M NEUTRAL | NVDA 170 CALL 2027-03-19 $59M BULLISH |
Premium was 36% higher than on November 11, and the call share fell 18 points, from 64% to 46%. Every bucket grew: Bullish from $4.1B to $6.6B, Bearish from $3.8B to $5.9B and Neutral from $11.3B to $13.6B, so the lean widened from one point to two while puts took most of the premium. Put premium is option type, not bearish sentiment: a put sold at the bid is tagged Bullish. The first half hour carried $4.0B, against $2.8B.
Leaders: where premium concentrated
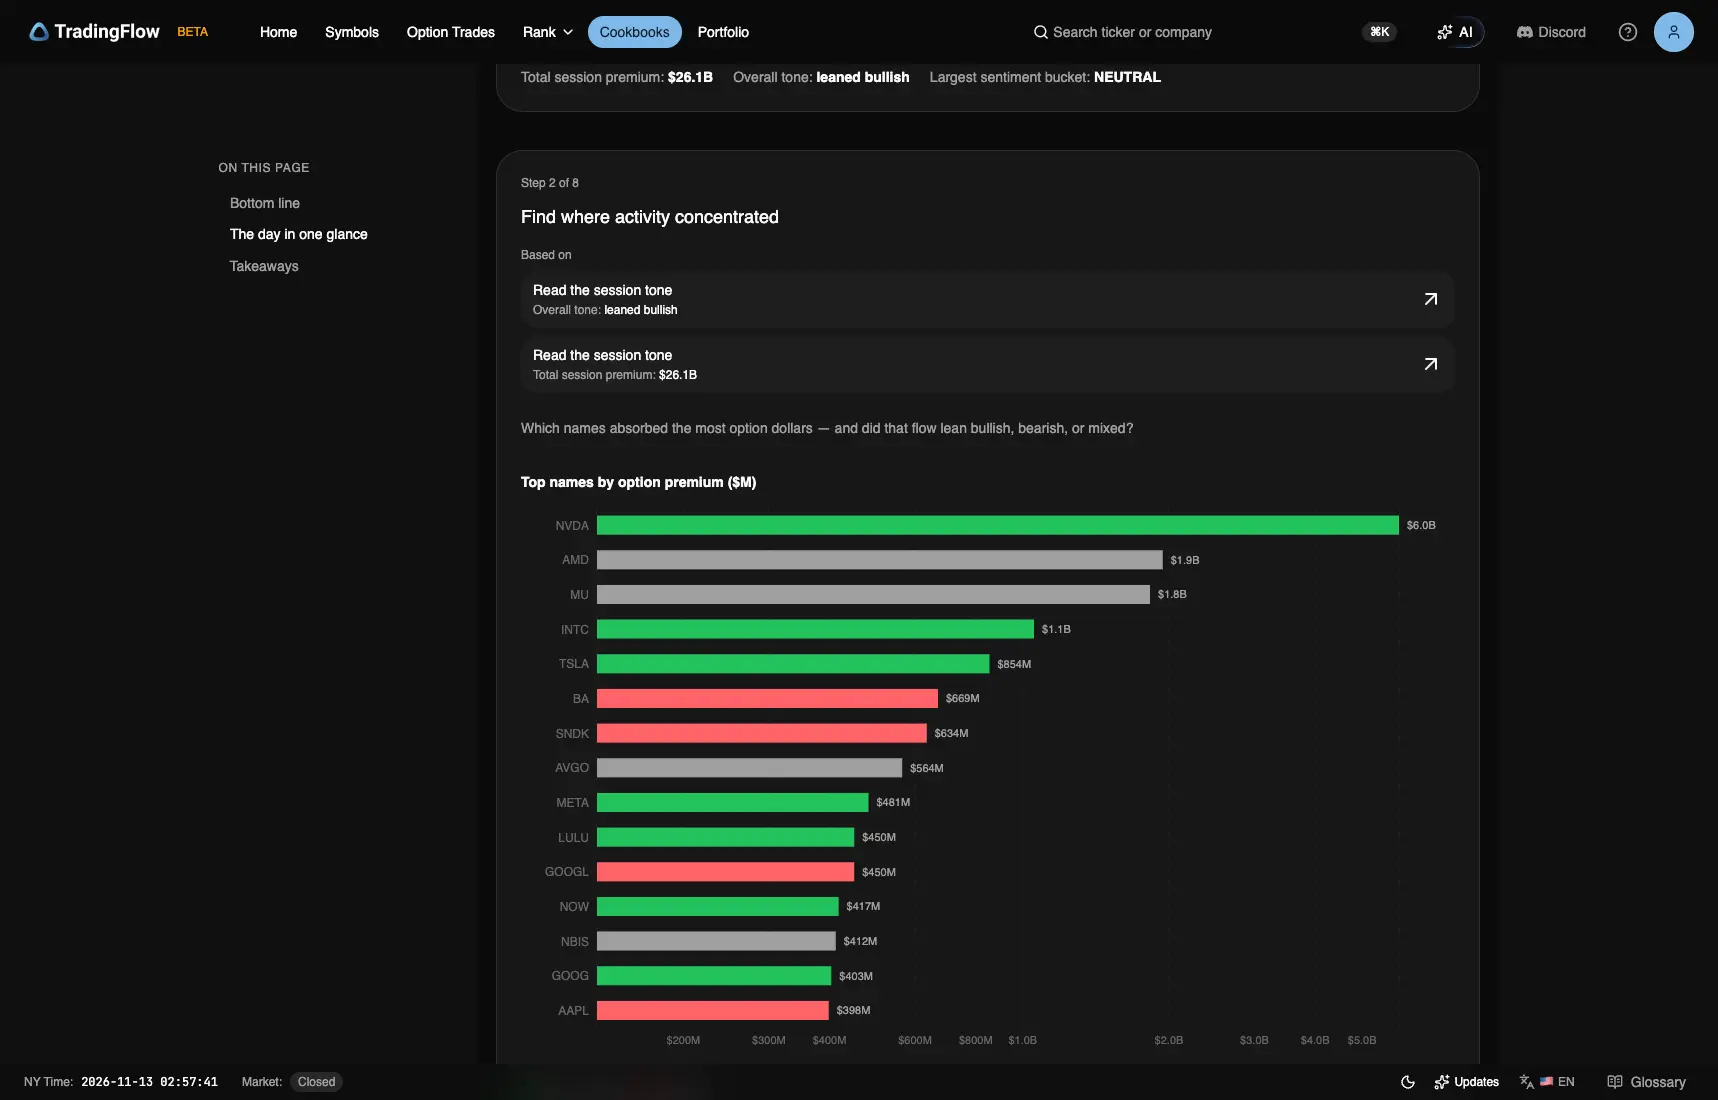
Test app, session 2026-11-12, Step 2. Captured November 13, 2026 (New York time).
| Symbol | Premium | Call | Put | Net bias |
|---|---|---|---|---|
| NVDA | $6.0B | $2.9B | $3.1B | Bullish |
| AMD | $1.9B | $1.3B | $608M | Mixed |
| MU | $1.8B | $807M | $1.0B | Mixed |
| INTC | $1.1B | $93M | $962M | Bullish |
| TSLA | $854M | $613M | $240M | Bullish |
| BA | $669M | $22M | $647M | Bearish |
NVDA took $6.0B, 23% of the session's premium and nearly three times its $2.1B on November 11; MU fell from $3.5B to $1.8B. Eleven of the fifteen names in Step 2 carried more put than call premium, against one on November 11; AMD, TSLA, AVGO and AAPL were the four that did not. Three of those put-heavy names are tagged Bullish with almost no call premium: INTC at $93M calls against $962M puts, LULU at $4M against $446M, and NOW at $12M against $406M.
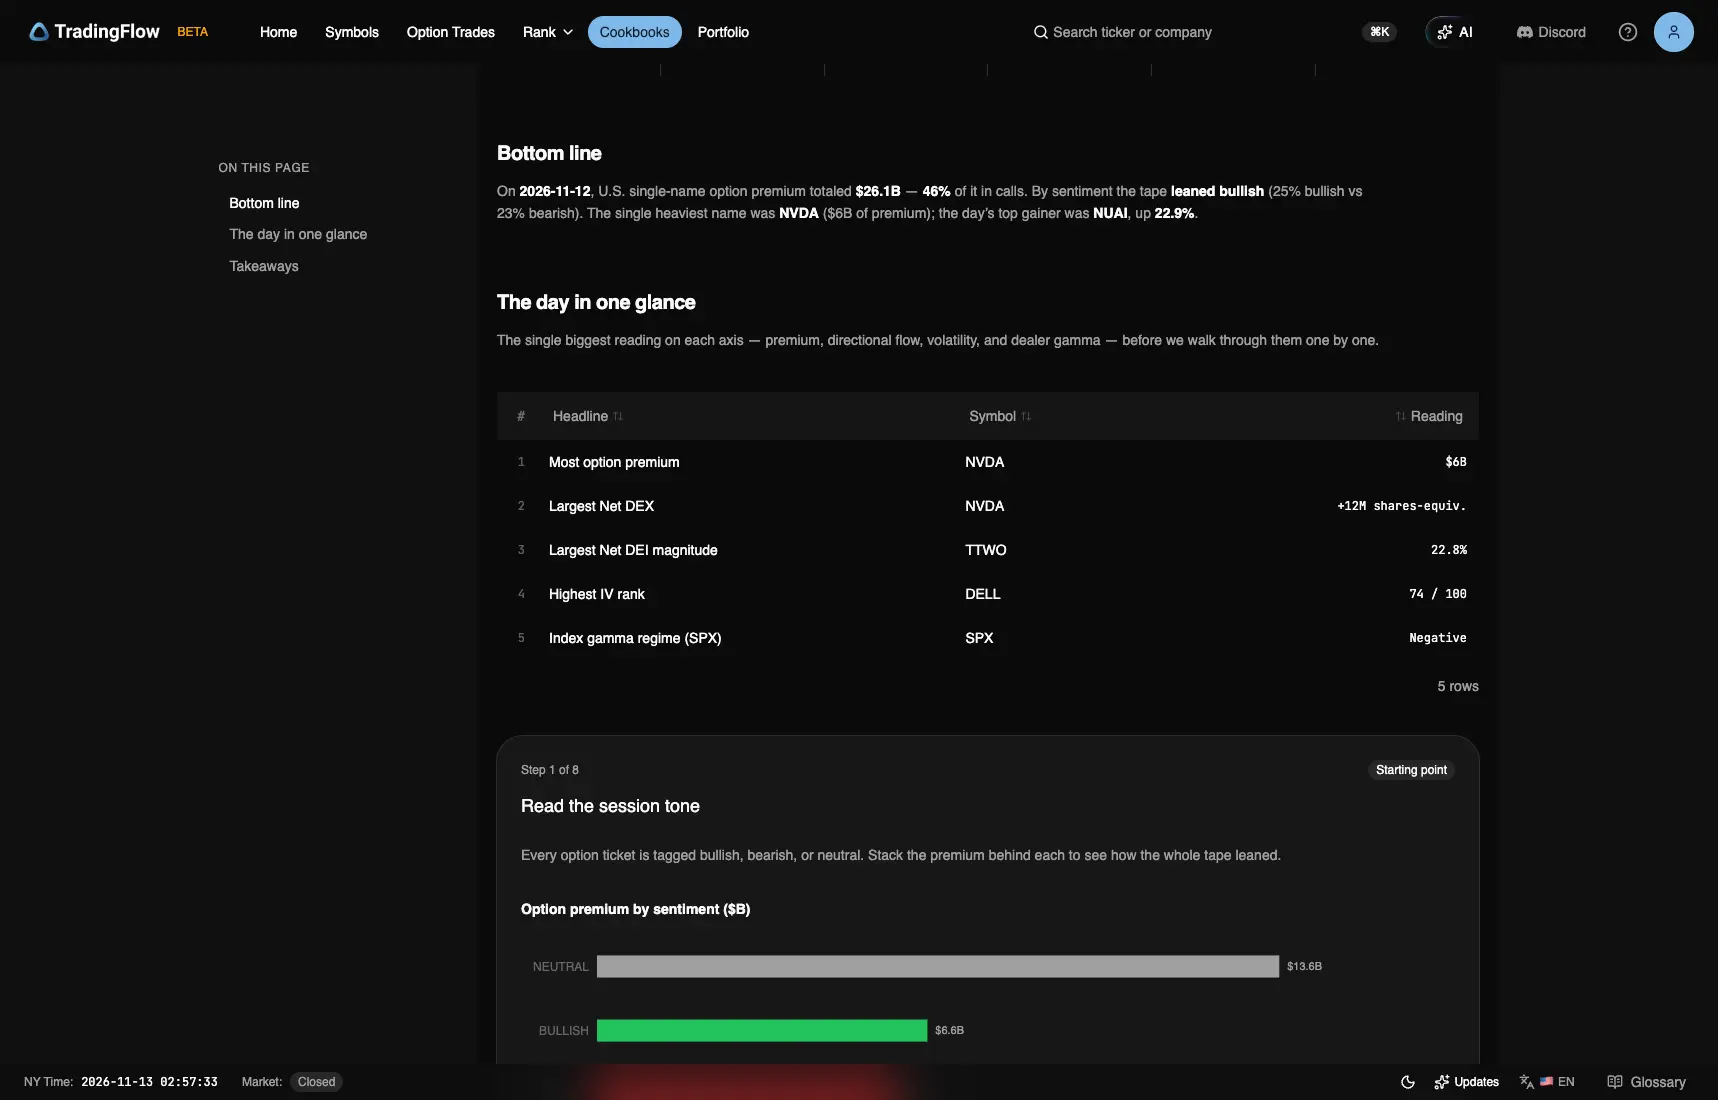
Test app, session 2026-11-12, Bottom line / glance. Captured November 13, 2026 (New York time).
Largest tickets across the session
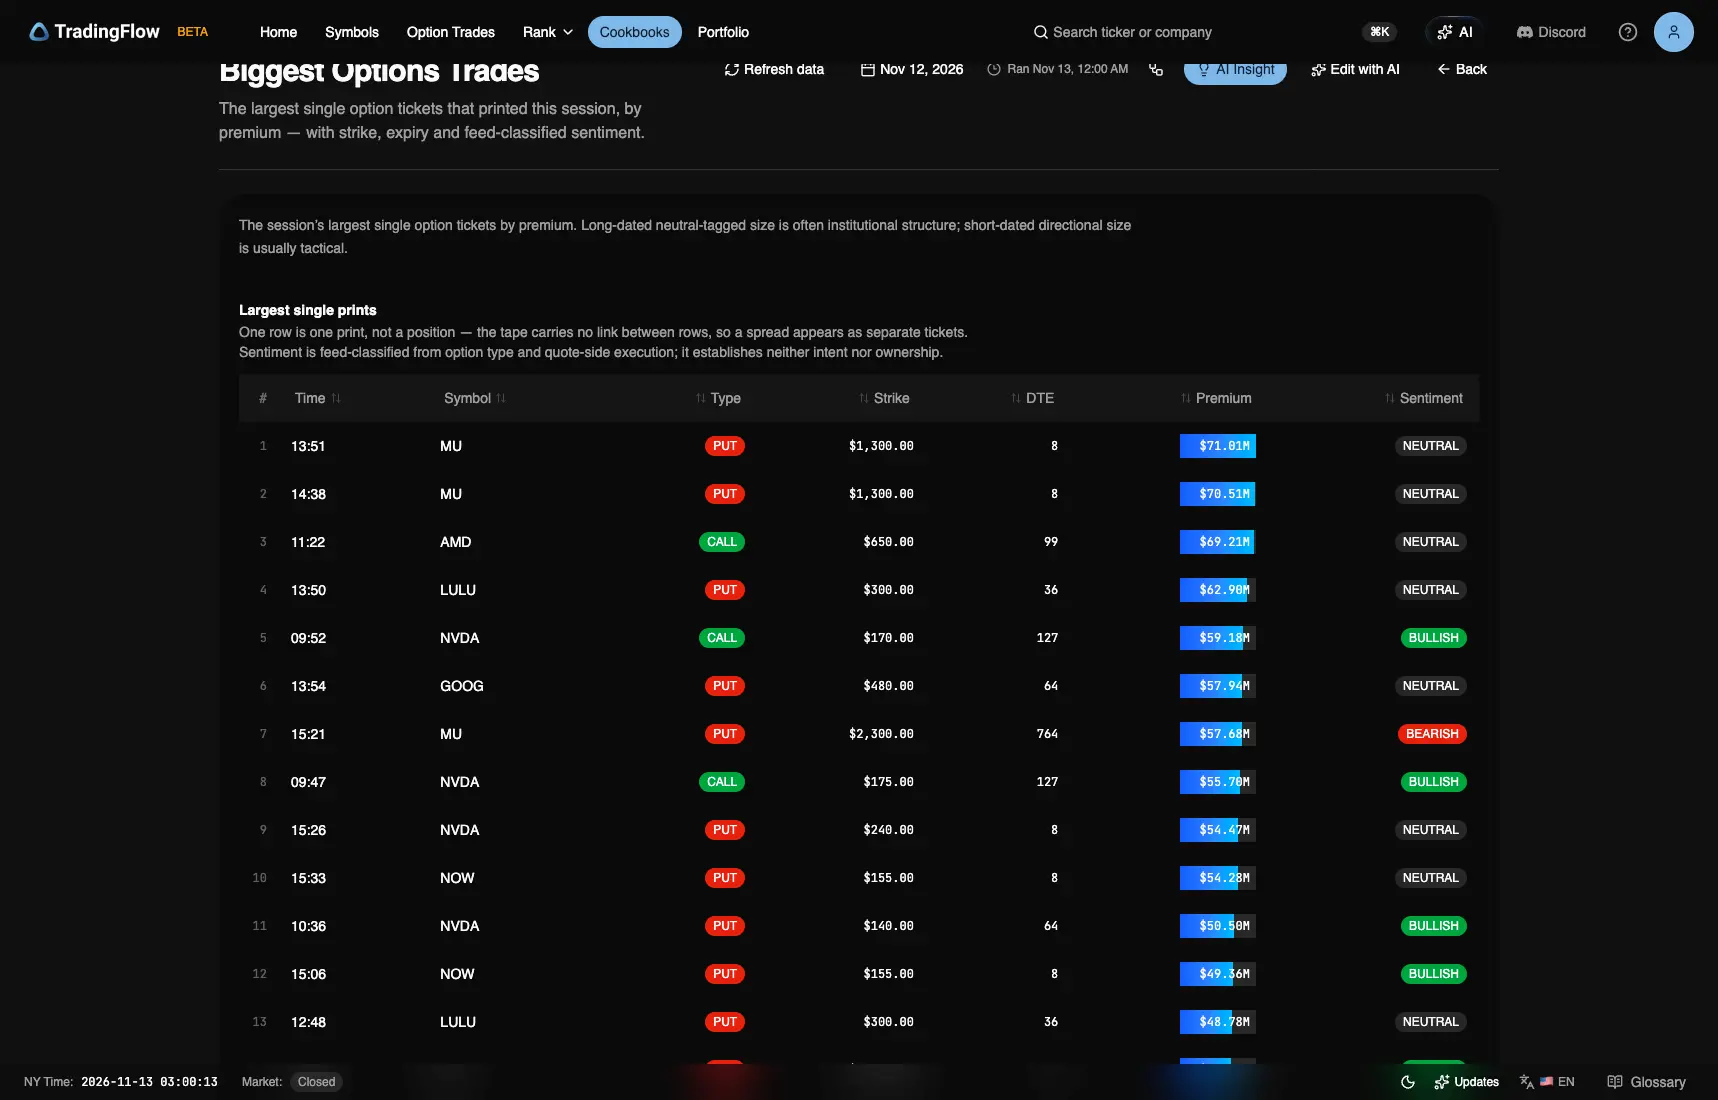
Test app, Cookbooks · Biggest Options Trades, session 2026-11-12. Captured November 13, 2026 (New York time); the Ran stamp is the capture machine's clock.
Twenty of the 25 largest tickets were puts, against five on November 11. The two largest were MU 1,300 puts, eight days out, at $71.01M Neutral at 13:51 and $70.51M Neutral at 14:38; a third at the same strike and expiry printed at 15:21 for $47.72M, tagged Bullish, for $189.24M between them. NVDA took six rows: calls at 170, 175 and 185, each 127 days out, printed between 09:47 and 09:52 for $155.24M together, and puts at 240, eight days out, at 15:06 and 15:26 and at 140, 64 days out, at 10:36. LULU's three rows were puts at 300 and 350, 36 days out, for $157.91M. One row is one print, not a position, and the tape does not link rows, so these do not show one structure.
Exposure and volatility context
The glance lists NVDA +12M shares-equiv. as largest Net DEX and TTWO 22.8% as largest Net DEI magnitude; Step 4 prints TTWO at 22.8% with a Positive Net DEX sign, and the next name, PDD, at 22.2%. On November 11 the largest Net DEI was WULF at 6.2%, Negative.
Notes on Thursday said implied vol had jumped, most of all in NVDA's nearest expiries. Each evening's chain shows the rise, comparing the same expiry across Wednesday and Thursday:
| At-the-money IV | Nov 13, Nov 11 chain | Nov 13, Nov 12 chain | Nov 20, Nov 11 chain | Nov 20, Nov 12 chain |
|---|---|---|---|---|
| SPX (SPXW root) | 13.6% | 19.1% | 13.4% | 15.8% |
| SPY | 16.4% | 19.6% | 14.9% | 16.0% |
| QQQ | 26.2% | 35.8% | 25.6% | 29.1% |
| NVDA | 67.6% | 90.6% | 79.7% | 86.9% |
| NBIS | 224.6% | 145.6% | 135.4% | 106.7% |
Supported. All eight index and NVDA readings rose: SPX by 5.5 and 2.4 points, SPY by 3.2 and 1.1, QQQ by 9.6 and 3.5, and NVDA by 23.0 and 7.2. They had all fallen the evening before. NVDA's November 18 expiry, the first after the November 17 earnings date its Overview lists, rose from 85.3% to 92.6%, and its December 11 expiry from 55.6% to 59.3%, so the nearest expiry moved most. NBIS went the other way once its report was out. Thursday's chain prices Friday's expiry at SPX ±1.0%, SPY ±1.0%, QQQ ±1.9% and NVDA ±4.7%, 158.34–174.10. Clock: each evening's closing chain, so this cannot say when during the day the vol rose.
Step 5 names DELL at 74 / 100 with 86.4% 30-day implied volatility. Thursday's chain prices DELL's December 11 expiry, 29 days out, at 89.1% and December 18 at 84.2%, so the stored reading sits between them. AVGO is second at 66 and AMD third at 47; NVDA's rank is 29, the lowest of the fifteen shown, on the day its nearest expiry repriced by 23 points, which is one more reason this edition reads vol changes from the chain and not from the stored rank.
Index GEX: all six rows Negative
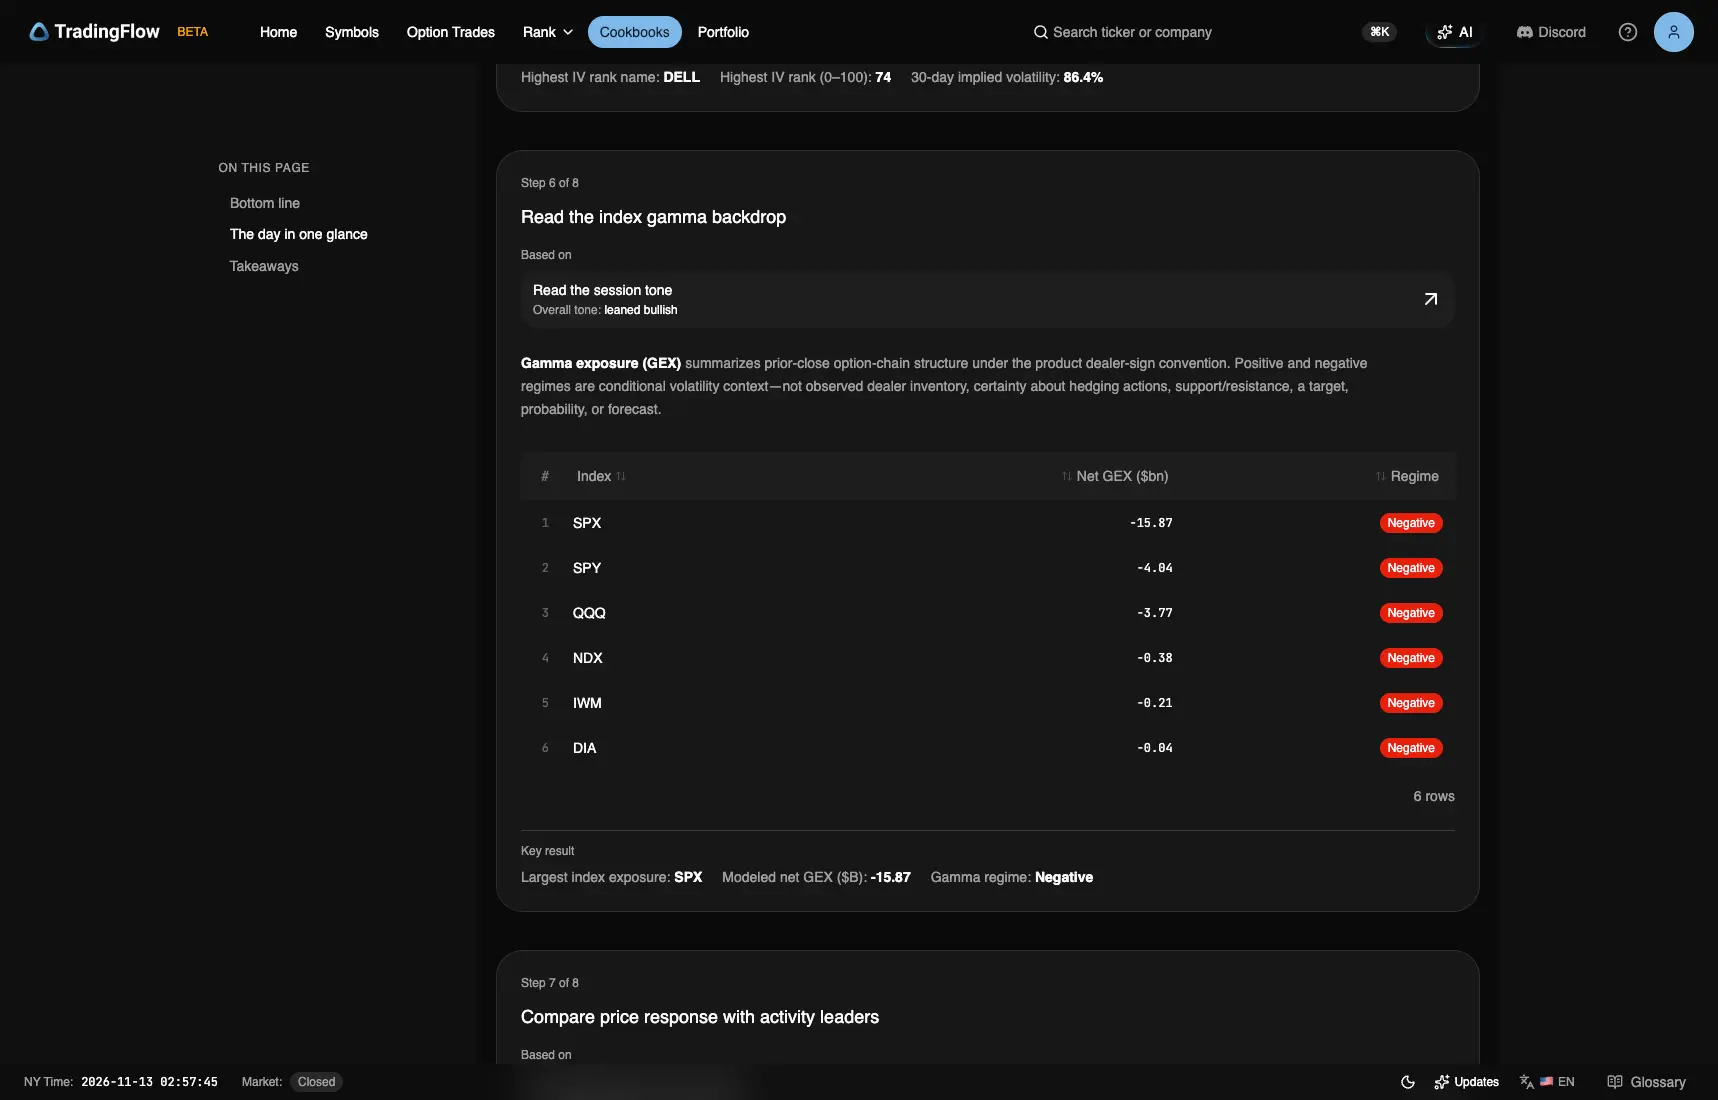
Test app, session 2026-11-12, Step 6 · T+1. Captured November 13, 2026 (New York time).
| Index | Net GEX ($B) | Regime |
|---|---|---|
| SPX | −15.87 | Negative |
| SPY | −4.04 | Negative |
| QQQ | −3.77 | Negative |
| NDX | −0.38 | Negative |
| IWM | −0.21 | Negative |
| DIA | −0.04 | Negative |
Against November 11, SPX moved from +40.26 to −15.87, SPY from +4.31 to −4.04, QQQ from +1.6 to −3.77, NDX from +1.35 to −0.38 and IWM from +0.39 to −0.21; DIA went from 0 to −0.04. The all-expirations figures agree in sign this time: SPX −$15.17B, SPY −$8.7B and QQQ −$6.59B, all Negative.
Since October 30, SPX has gone −98.98, −44.76, −36.56, +36.11, −41.53, −57.04, +51.89, then, after the unpublished November 10, +40.26 and −15.87; QQQ −12.7, −3.45, +4.6, −0.54, −2.8, −0.96, +3.17, +1.6 and −3.77.
Headline name: NVDA at $166
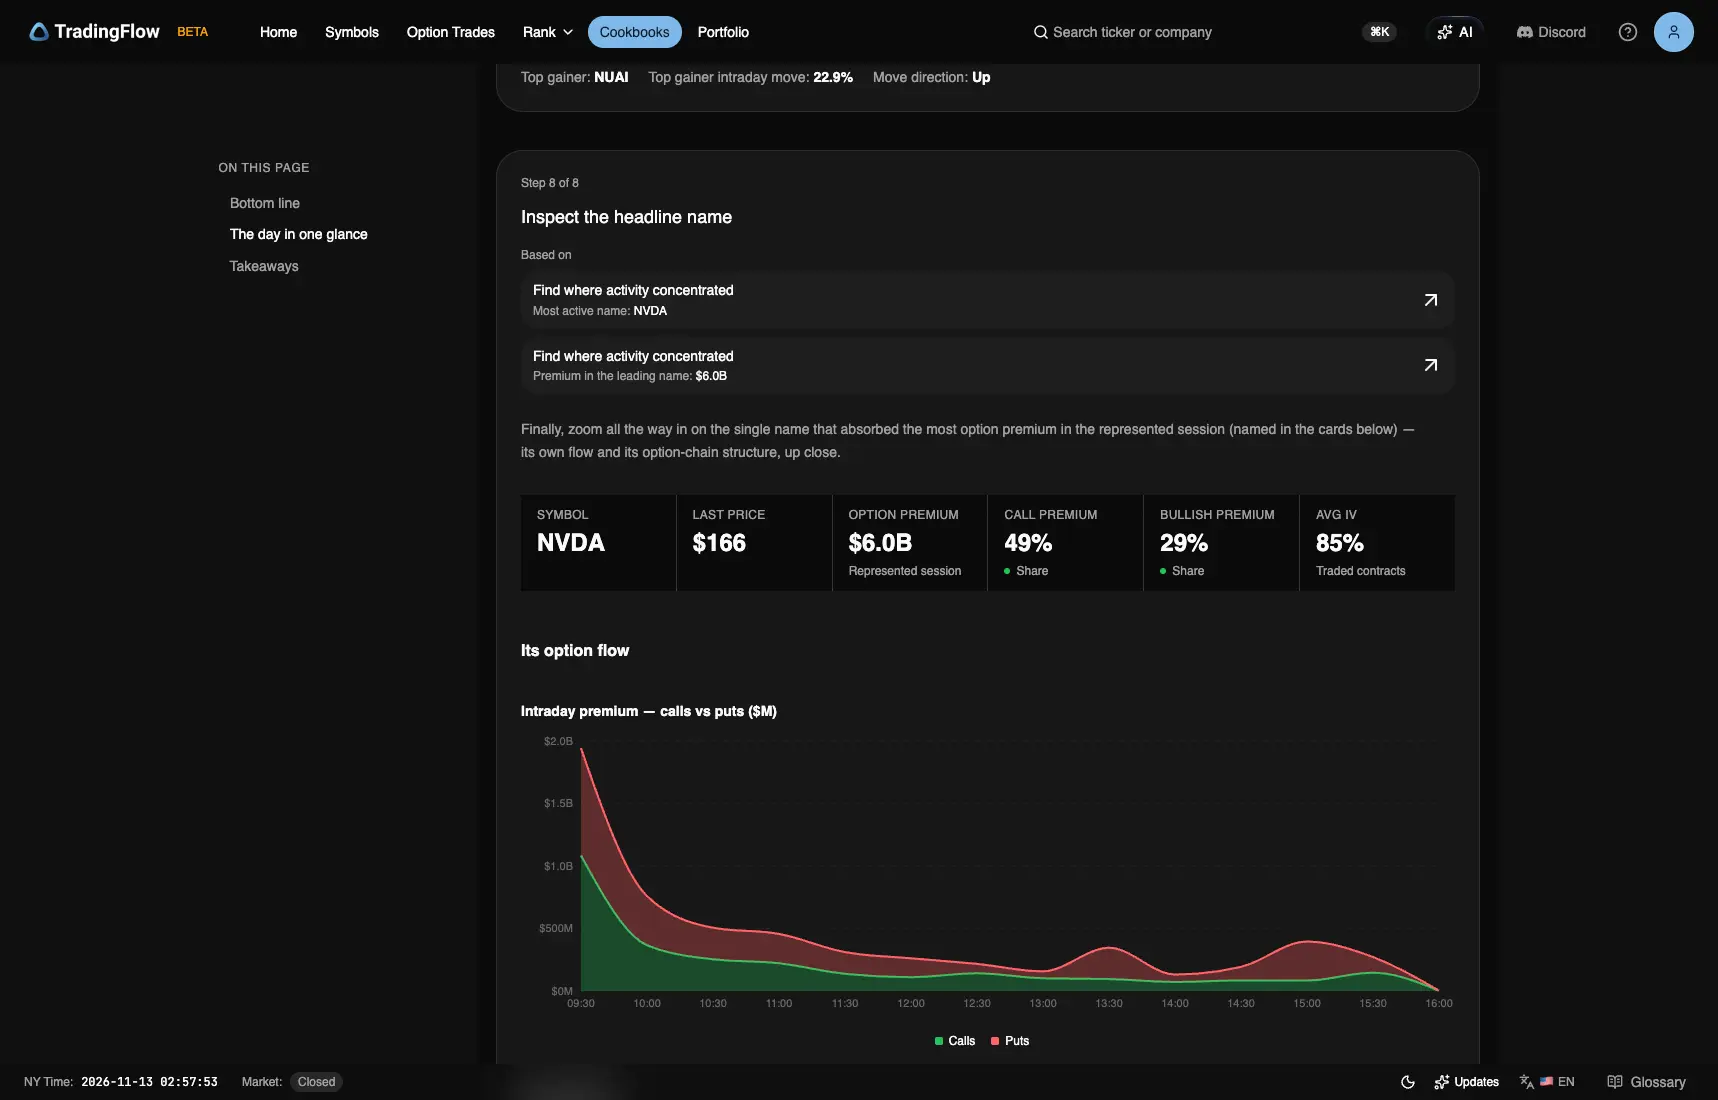
Test app, session 2026-11-12, Step 8. Captured November 13, 2026 (New York time).
Cards: last $166, premium $6.0B, 49% calls, 29% bullish, 85% average IV on traded contracts. On November 11 NVDA was second with $2.1B, Mixed.
| Time | Type | Strike | Expiry | Premium | Sentiment |
|---|---|---|---|---|---|
| 09:52 | CALL | 170 | 2027-03-19 | $59M | BULLISH |
| 09:47 | CALL | 175 | 2027-03-19 | $56M | BULLISH |
| 15:26 | PUT | 240 | 2026-11-20 | $54M | NEUTRAL |
| 10:36 | PUT | 140 | 2027-01-15 | $51M | BULLISH |
| 15:06 | PUT | 240 | 2026-11-20 | $47M | BULLISH |
| 09:52 | CALL | 185 | 2027-03-19 | $40M | NEUTRAL |
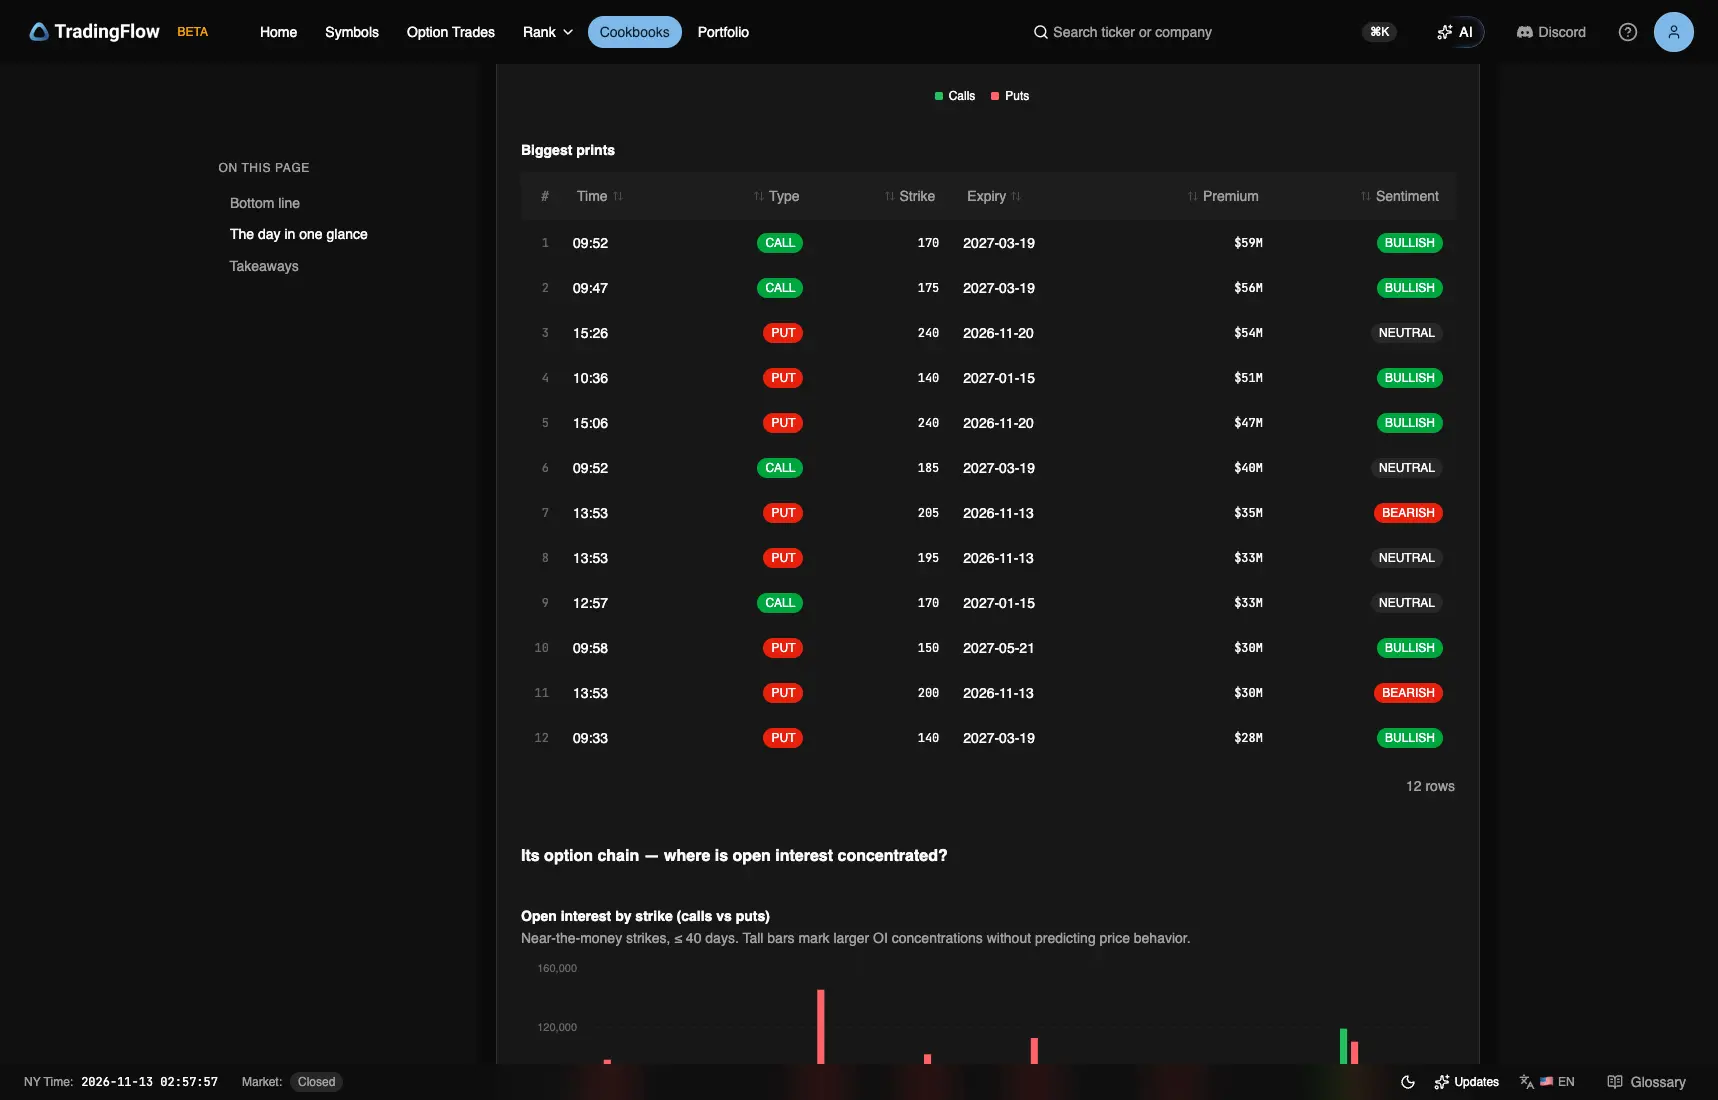
Test app, session 2026-11-12, Step 8 · prints. Captured November 13, 2026 (New York time).
The three March 2027 calls, at 170, 175 and 185, printed within five minutes of each other in the first half hour. Two of the six largest tickets are 240 puts expiring November 20, $74 above a $166 stock, late in the day. Further down the list, three puts in Friday's expiry at 205, 195 and 200 printed at 13:53 for $35M, $33M and $30M. The tape does not link those rows, so they do not show one structure.
Movers: NUAI +22.9%
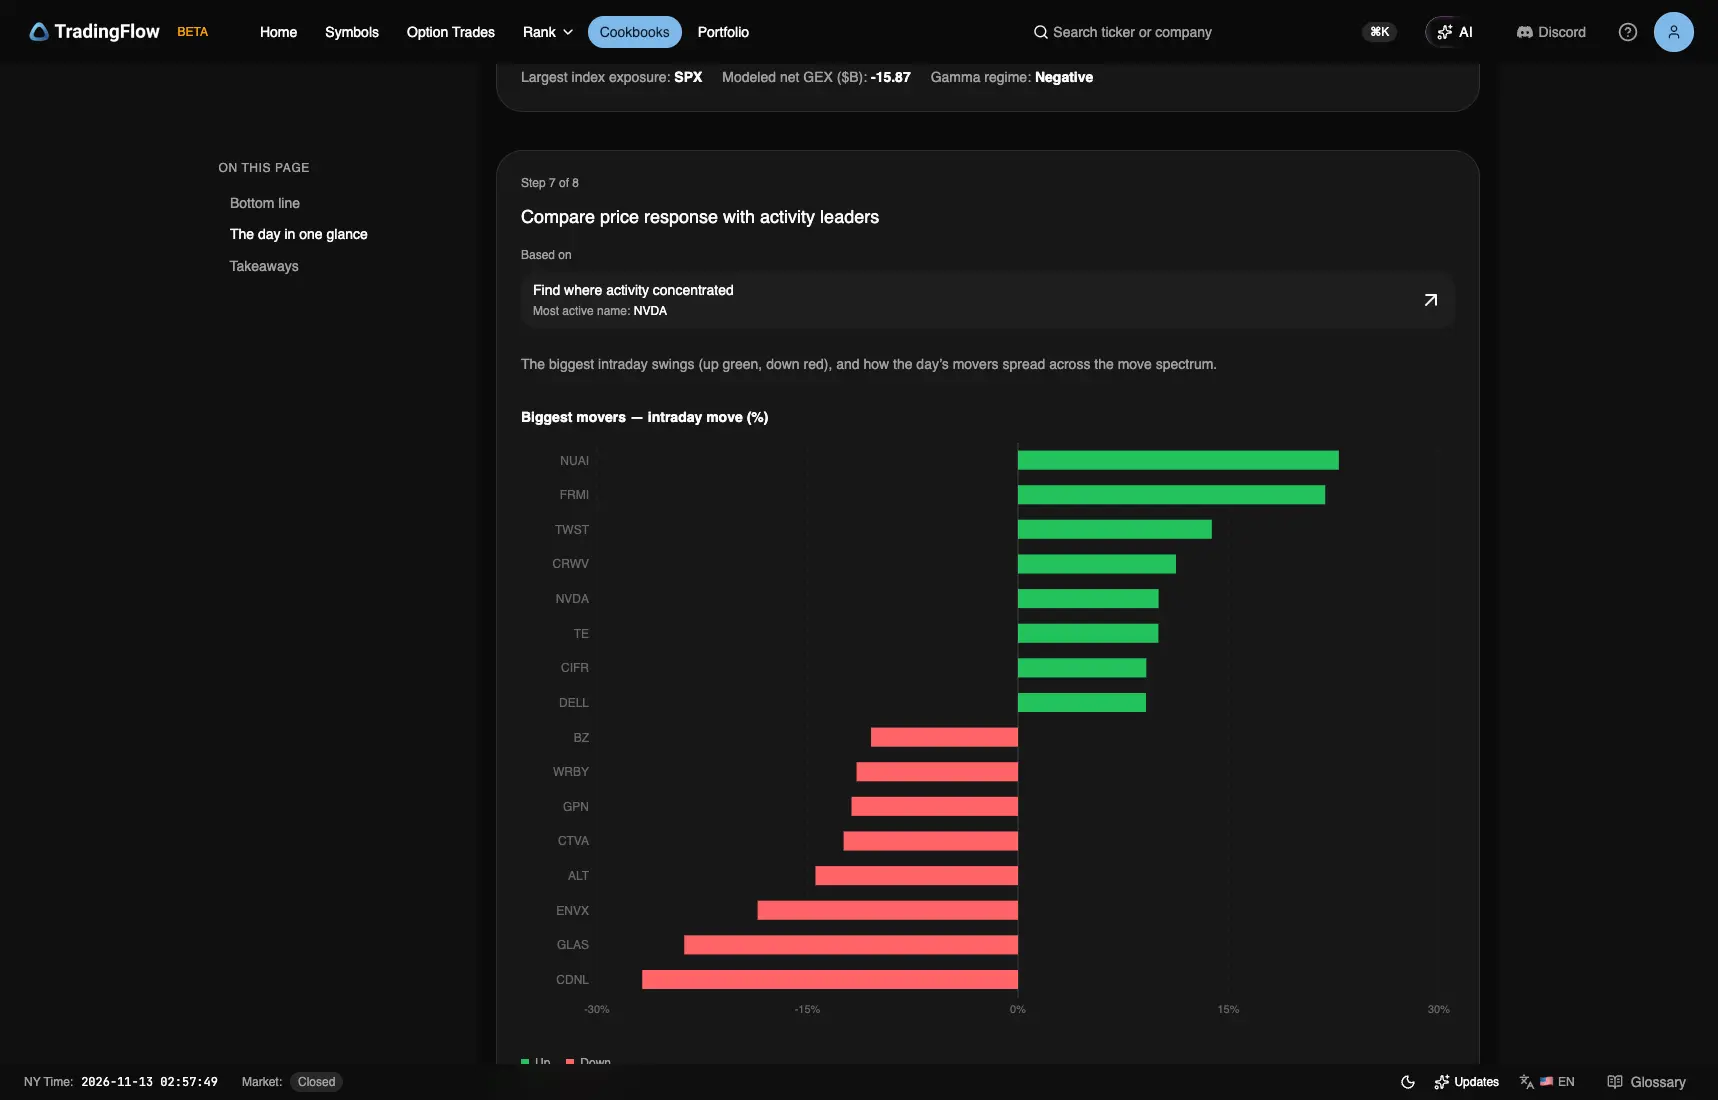
Test app, session 2026-11-12, Step 7. Captured November 13, 2026 (New York time).
The largest gain was NUAI, +22.9% in the bottom line and 22.9% in Step 7 (Up). November 11's was BGS +20.2%. NVDA is the fifth bar on the up side, for the reason given above. The longest bar on the down side of Step 7's chart is CDNL.
What this session is evidence of
| Question | Nov 12 | Nov 11 | Clock |
|---|---|---|---|
| NVDA against its priced move | Opened $14.04 under the two-day range · closed $1.16 inside, −4.32% against ±5.0% | Closed $2.47 inside its one-day range | Prior evening's chain · daily bar |
| NBIS against its priced move | −16.87% against ±16.6% to Nov 13 | Not tested | Prior evening's chain · daily bar |
| SPX's day | Close 7,592.40; bar opens at its low | Open 7,586.70 · high 7,647.20 · low 7,571.90 · close 7,619.40 | Daily bars |
| Priced move, nearest expiry | SPX, SPY and QQQ closed inside the range | SPX, SPY and QQQ closed above the range | Prior evening's chain · daily bars |
| Close to close against half the range | SPX 0.52× · SPY 0.41× · QQQ 0.25× | SPX 1.32× · SPY 1.45× · QQQ 1.40× | Prior evening's chain · daily bars |
| Close against the prior evening's flip | SPX 8.21 under · SPY $1.30 under · QQQ $0.51 under | SPX 67.32 above · SPY $1.59 above · QQQ $1.62 above | Daily bars · prior-close structure |
| SPX all-expirations structure, built that evening | −$15.17B Negative · flip 7,593.14 · call wall 7,600 | +$48.3B Positive · flip 7,600.61 · call wall 7,620 | Structure built each evening |
| Implied vol, Nov 13 expiry | SPY 19.6% · QQQ 35.8% · NVDA 90.6% | SPY 16.4% · QQQ 26.2% · NVDA 67.6% | Each evening's chain |
| Size / tone | $26.1B · 25% / 23% · leaned bullish | $19.2B · 21% / 20% · leaned bullish | Session tape |
| Concentration | NVDA $6.0B Bullish | MU $3.5B Mixed | Session leaders |
| Relative exposure | TTWO net DEI 22.8% · DEX Positive | WULF net DEI 6.2% · DEX Negative | Session exposure |
| Volatility rank | DELL 74 / 100 · 86.4% | DELL 67 / 100 · 81.5% | T+1 |
| Index structure | SPX −15.87B Negative · all six rows Negative | SPX +40.26B Positive · five rows Positive, DIA 0 | T+1 |
| Largest headline-name print | NVDA 170 CALL 2027-03-19 $59M BULLISH | MU 880 CALL 2027-02-19 $62M NEUTRAL | Session ticket |
How to read these numbers
This edition reads TradingFlow's Daily Market Recap for November 12, 2026, captured on November 13 (New York time), after the session's 5:40 PM ET structure build. Runs at 2:41 AM, 2:57 AM and 3:00 AM New York time printed the same figures. It is a completed-session report, not a trade recommendation.
Two clocks apply. Premium, sentiment, and prints describe the session tape; GEX and IV are T+1 / prior-close snapshots, not a live intraday gamma map. Step 6 sums each index's near-dated chain, expiries out to seven days and strikes within 7% of spot, so it is not the all-expirations figure on a symbol's GEX page. Neutral premium supplies no direction, and call or put share is option type, not sentiment. Net DEI is a magnitude relative to typical activity; Net DEX is a separate signed classification. GEX is modeled chain structure under TradingFlow's dealer-sign convention, not observed dealer inventory, a support level, or the next session's direction. Ticket tags do not prove who bought or sold or whether a position opened, and intraday_pct is a first-to-last underlying-price proxy from the option tape, not a verified daily return, which is why NVDA shows as a gainer in Step 7.
Expected Move is one standard deviation, spot × at-the-money IV × √(days to expiry / 365), so about one close in three lands outside the range even when vol is realised as priced. Its at-the-money IV comes from the near-the-money calls, and each range is centred on the session's last underlying price in the option tape, which can differ from the daily bar's close: NVDA's centres on 173.73 against a 173.70 close, NBIS's on 154.90 against 154.70. NVDA's and NBIS's ranges are two-day readings for the November 13 expiry, tested here against one session. The multiples divide the close-to-close change by half the range and are rounded.
The structure and chain for November 11 come from two places. The index walls and flips built on November 11 are the ones the November 11 edition published, and NVDA's were read on November 12. On November 13 the test app's Symbols pages showed the November 12 session for every date asked, so no November 11 chain could be reopened; Expected Move still answers for each evening.
A structure built after the close still counts the contracts expiring that day: Today · 0DTE on Thursday's build is the November 12 expiry, which is 17.4% of SPX's all-expirations gross GEX. Friday's own expiry is a separate 1DTE row in the Expiry structure panel. All-expirations walls can sit on the strike those contracts crowd.
TradingFlow's SPXW daily bar for November 12 opens at its own low, 7,550.80, and its range is 1.34% of the close against SPY's 1.23%, so this edition quotes SPX's close only and takes the session's open, high and low from SPY and QQQ.
A ticket's feed tag reads the quote side: Bullish is a call bought at the ask or a put sold at the bid, Bearish the reverse.
Reproduce the findings
- Open the November 12 recap; confirm Nov 12, 2026 in the session KPI.
- Open the November 11 recap beside it and compare the KPI strip, leaders, and all six index GEX rows.
- Open Expected Move for NVDA on November 11, read the 11/13 and 11/20 rows, then open NVDA's November 12 Overview and compare Thursday's bar.
- Open the Overview for November 12 for SPXW, SPY and QQQ, and compare each bar with the walls and flips in the November 11 edition.
- Open Expected Move for November 11 with SPXW, SPY and QQQ, and compare each 11/12 row with Thursday's bar. Open it for November 12 to compare the 11/13 and 11/20 rows across the two evenings.
- Open Expected Move for NBIS on November 11 and November 12, and its November 12 Overview.
- Open Biggest Options Trades for November 12 and read the largest single tickets.
- Compare NVDA's headline cards and largest tickets.
TradingFlow App Home → Cookbooks → Daily Market Recap → select the completed session.
Related reading
Educational and informational only, not financial advice. Options-flow reads are statistical inferences. Dealer exposure levels, including GEX, DEX, DEI, walls, and magnets, are modeled estimates, not guarantees.
Related Articles
November 11 Recap: SPX Clears 7,600 and Closes Above Its Priced Range
$19.2B in single-name premium, 21% bullish versus 20% bearish. MU led at $3.5B Mixed; SPX GEX was +$40.26B.
November 9 Recap: SPY Beats Its Priced Move, Then Closes Just Under Friday's Flip
$24.0B in single-name premium, 23% bullish versus 19% bearish. NVDA led at $3.9B Mixed; SPX GEX was +$51.89B.
November 6 Recap: SPY Touches 742.20, Then Closes $0.70 Above Its Low
$21.3B in single-name premium, 23% bullish versus 22% bearish. MU led at $3.4B Bullish; SPX GEX was −$57.04B.