Official template · basic · Symbol
One symbol. Its options activity in one view.
Answer "what is happening in this ticker’s options" before deciding which deeper read to open.
The report UI is recreated from the test app's Sep 25, 2026 session, not a live screen. A historical example with music; no narration.
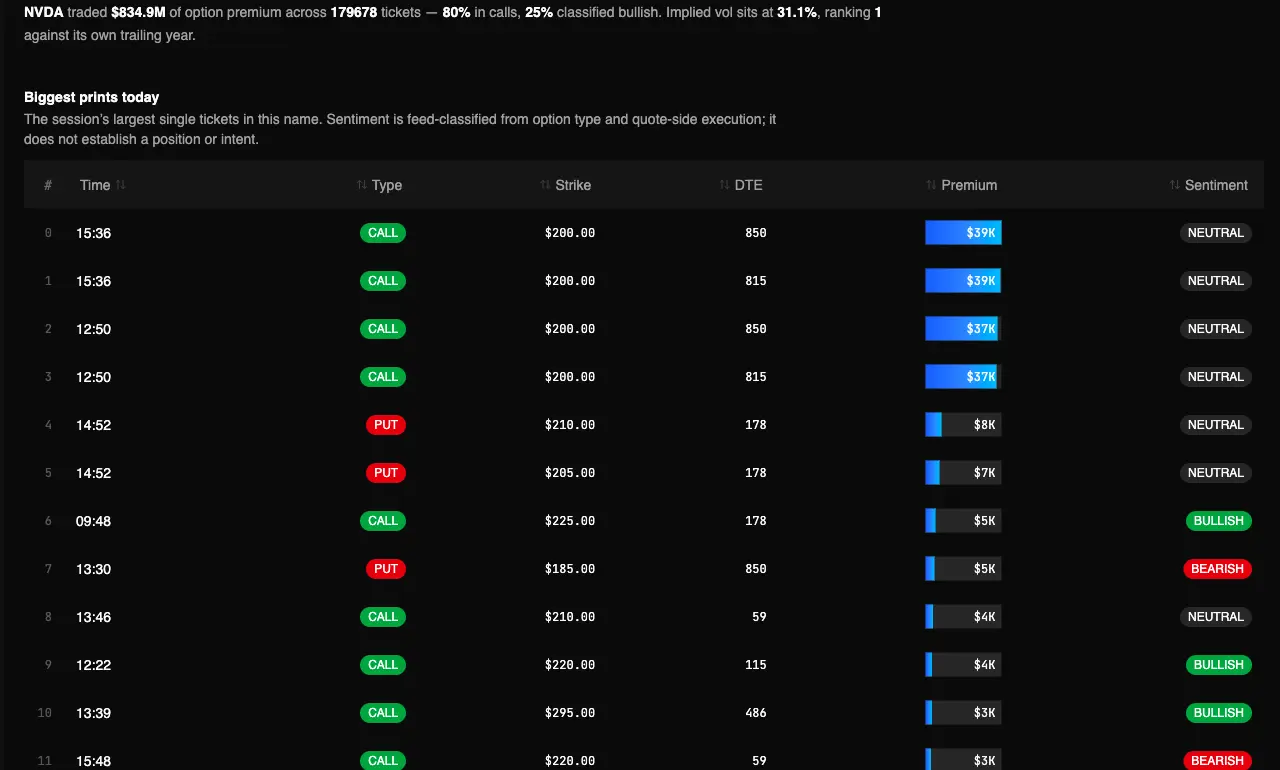
Captured Sep 23, 2026 on testapp.tradingflow.com. This is a historical example; results on this page do not refresh. Swipe across the image to inspect its columns.
- 01One symbol
- 02Session activity + IV
- 03Premium, rank, prints
The report resolves for the selected completed session.
Read the output
- 01Spot, 30-day implied volatility and its 1-year rank for the symbol.
- 02The session’s option premium, call share and bullish share.
- 03The largest single prints in that name, with strike, expiry and sentiment.
Keep in mind
Sentiment is feed-classified from option type and quote-side execution; it is not a position.
How to read it
From report to evidence01
Type a symbol
Everything resolves for the latest completed session, or a date you pin.
02
Read premium against IV rank
Heavy premium on a low IV rank is a different setup from heavy premium on a high one.
03
Go deeper where it matters
Gamma Levels for structure, Expected Move for what is priced, Vol Surface for the whole vol map.
Method and limitations
A one-screen Cookbook tool for a selected completed session: a symbol’s volatility, option premium, and biggest prints. Official app template: Ticker Options Snapshot.
What the report computes
- Spot, 30-day implied volatility and its 1-year rank for the symbol.
- The session’s option premium, call share and bullish share.
- The largest single prints in that name, with strike, expiry and sentiment.
What it does not claim
- Sentiment is feed-classified from option type and quote-side execution; it is not a position.
- One print is not a trade idea — the tape carries no link between rows.
- Vol figures are vendor fields; no realized-volatility comparison is made here.
Puts the session’s premium split next to the 1-year IV rank, so heavy activity in a quiet-vol name is distinguishable from heavy activity in an already-expensive one.
Frequently asked questions
- Is this the same as an option chain?
- No. A chain lists every contract. This summarises the session for the symbol — how much premium traded, how it split, where implied vol sits, and which tickets were largest.
- Why is bullish premium lower than call premium?
- Calls are not automatically bullish. A call sold at the bid classifies differently from one lifted at the ask, and neutral prints — spreads and hedges — count toward neither side.
Related recipes
- Gamma levelsAnswer "what are the gamma levels for this ticker" without opening a full structure map.
- Expected moveAnswer "how far is this name priced to move by Friday" without building a vol surface first.
- Vol surfaceSee whether options are rich or cheap on the surface before you sell or buy premium.
More learning resources
Related glossary
Related personas
The public page explains the report. Run the official template in TradingFlow for a selected completed market session.
Open Ticker snapshot