Official template · basic · Key levels
See a symbol’s modeled gamma profile.
Answer "what are the gamma levels for this ticker" without opening a full structure map.
The report UI is recreated from the test app's Sep 25, 2026 session, not a live screen. A historical example with music; no narration.
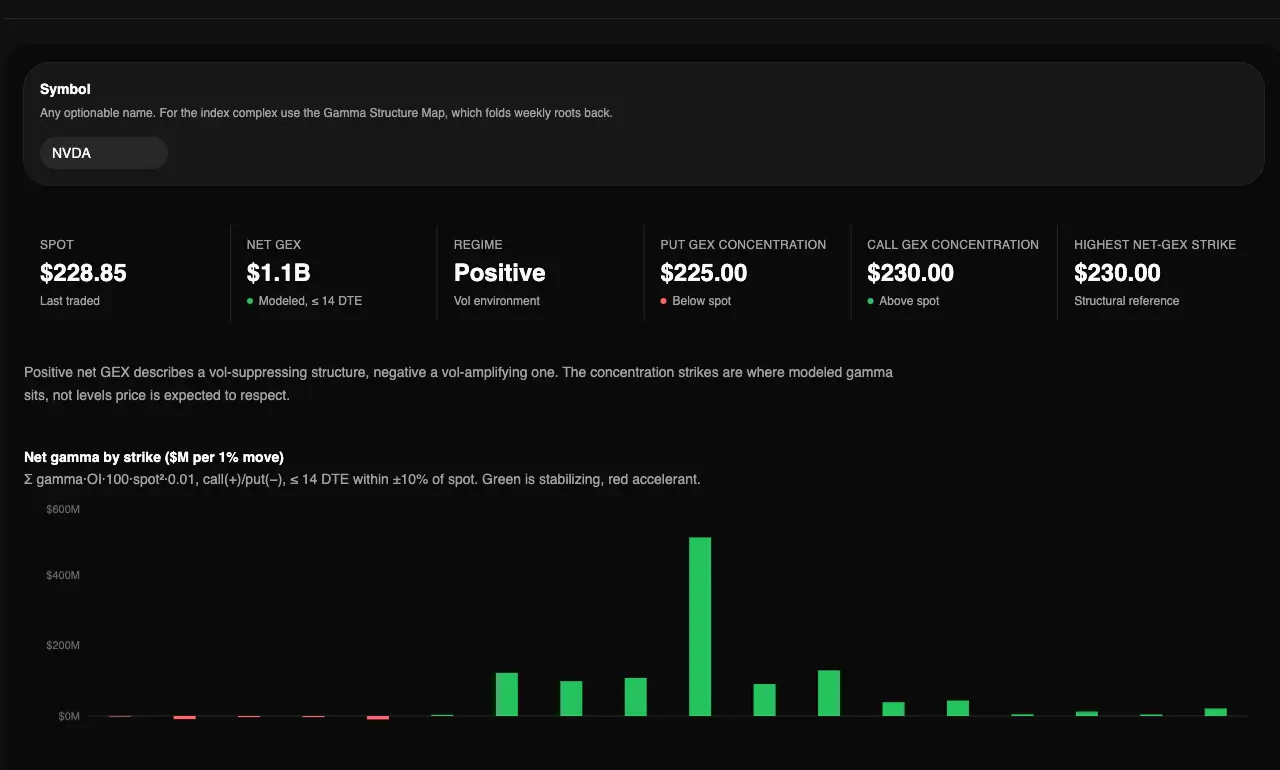
Captured Sep 23, 2026 on testapp.tradingflow.com. This is a historical example; results on this page do not refresh. Swipe across the image to inspect its columns.
- 01Prior-close chain
- 02Modeled GEX by strike
- 03Regime + concentrations
A convention-based estimate, not dealer inventory.
Read the output
- 01Net GEX for the symbol and whether the regime reads positive or negative.
- 02The largest put-side and call-side GEX concentrations bracketing spot.
- 03The per-strike net gamma profile within ±10% of spot, out to 14 days.
Keep in mind
These are concentrations and structural references, never support, resistance, targets or pins.
Explore the concept behind this report
Positive gamma: dealer hedging tends to dampen moves (range). Negative gamma: hedging can amplify moves (trend/vol).
How to read it
From report to evidence01
Read the regime sign
Positive describes a vol-suppressing structure, negative a vol-amplifying one.
02
Locate the concentrations
They mark where modeled gamma sits, not levels price is obliged to respect.
03
Use the index view for indices
The Gamma Structure Map folds weekly roots back so index 0DTE gamma is not lost.
Method and limitations
A one-screen Cookbook tool: where modeled dealer gamma sits for a symbol, and which side of zero the total falls on. Official app template: Gamma Levels.
What the report computes
- Net GEX for the symbol and whether the regime reads positive or negative.
- The largest put-side and call-side GEX concentrations bracketing spot.
- The per-strike net gamma profile within ±10% of spot, out to 14 days.
What it does not claim
- These are concentrations and structural references, never support, resistance, targets or pins.
- A simplified call(+)/put(−) convention off a prior-close chain snapshot, not a dealer-desk figure.
- It is not evidence of actual dealer inventory — no participant tagging exists in this data.
Uses the same GEX kernel as the index-wide Structure Map, so a symbol read here and the same symbol read there cannot disagree about its regime.
Frequently asked questions
- Is positive gamma bullish?
- No. The sign describes a volatility environment, not direction. Positive describes hedging that tends to dampen moves; negative describes hedging that tends to extend them.
- Is this real dealer positioning?
- No. Like most public GEX it applies a call-positive, put-negative convention to open interest. Without exchange-tagged participant data, nobody can compute true dealer inventory.
Related recipes
- Gamma structureLocate modeled concentration strikes and the highest net-GEX strike, then compare them with session flow.
- Zero-gamma flipLocate the modeled cumulative-GEX zero crossing and read its regime context.
- OI by strike · BasicAnswer "where is open interest stacked in this name" without a gamma model in the way.
More learning resources
The public page explains the report. Run the official template in TradingFlow for a selected completed market session.
Open Gamma levels