配方详情目前以英文提供,官方报告可在 TradingFlow 应用中打开。
Official template · advanced · Volatility
Explore volatility across strikes and expiries.
See whether options are rich or cheap on the surface before you sell or buy premium.
The report UI is recreated from the test app's Sep 25, 2026 session, not a live screen. A historical example with music; no narration.
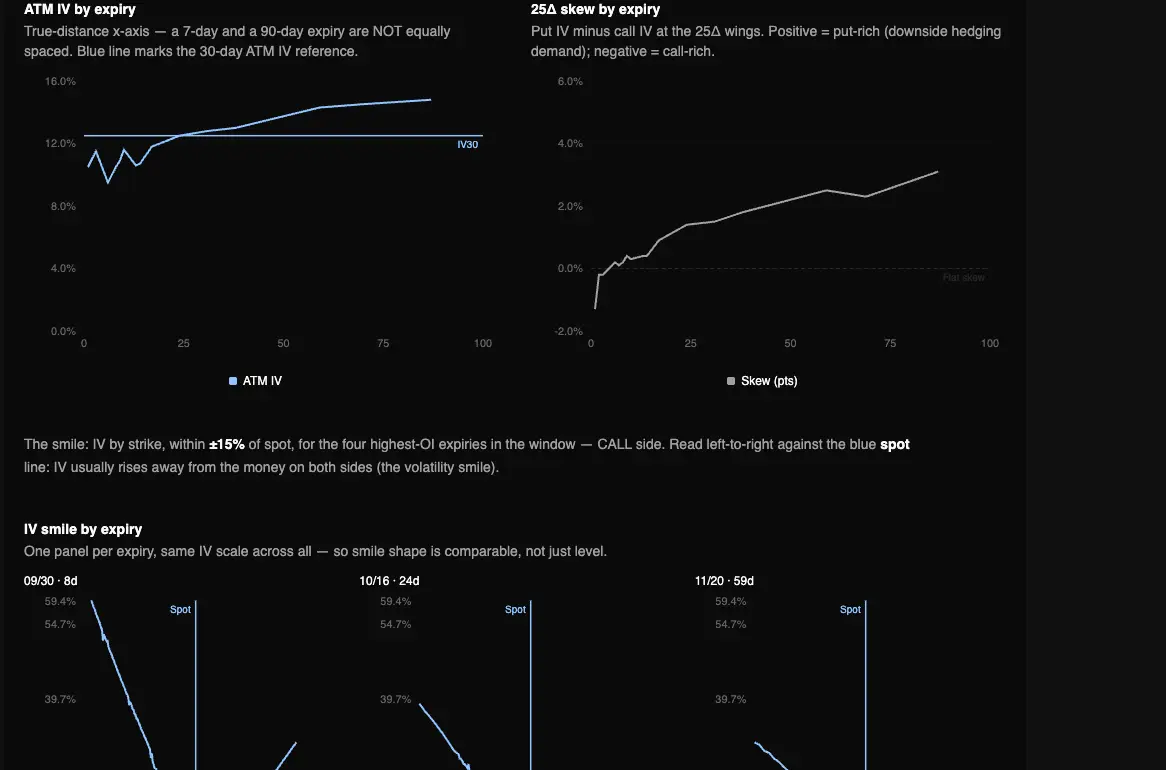
Captured Sep 23, 2026 on testapp.tradingflow.com. This is a historical example; results on this page do not refresh. Swipe across the image to inspect its columns.
- 01Symbol + strike/expiry
- 02Compare ATM, smile, skew
- 03Volatility surface
The diagram is schematic; the report charts are two-dimensional.
Read the output
- 01ATM term structure, per-expiry smile, and strike-by-expiry IV surface.
- 0225Δ skew.
- 03How the name’s vol ranks against the day’s most active names.
Keep in mind
Vendor historical volatility on this recipe is not RV20. Do not read it as the Rank IV30−RV20 spread.
How to read it
From report to evidence01
Run the vol surface
Open Vol Surface in Cookbooks and pick the symbol the report resolves (or the session’s active name).
02
Read term, then smile and skew
Term structure shows which expiries are bid. Smile and 25Δ skew show wing pricing. Rank vs peers is a cross-section, not a trade.
03
Sell or buy premium elsewhere if you act
The recipe maps vol. Execution still lives on your broker. Rank Symbols holds the governed IV30 vs RV20 comparison.
Method and limitations
A paid Cookbook of one symbol’s volatility map: ATM term structure, per-expiry smile, strike-by-expiry IV surface, and 25Δ skew, plus where that vol ranks against the day’s most active names. Official app template: Vol Surface — Term Structure, Smile & Skew.
What the report computes
- ATM term structure, per-expiry smile, and strike-by-expiry IV surface.
- 25Δ skew.
- How the name’s vol ranks against the day’s most active names.
What it does not claim
- Vendor historical volatility on this recipe is not RV20. Do not read it as the Rank IV30−RV20 spread.
- It is not a covered-call / CSP yield scanner or earnings backtester.
- Skew extremes are context, not a reversal signal with a published hit rate.
The IV heatmap is a true strike×expiry surface (not a faked bar chart), and vendor HV stays labeled as unspecified-window — it is never relabeled RV20.
Frequently asked questions
- Is vendor HV the same as RV20?
- No. Cookbooks labels vendor historical volatility as window-unspecified. Exact IV30 minus RV20 lives on Rank Symbols, not this recipe.
- Can this pick covered calls for me?
- No. It is a surface map. It does not screen 30-delta calls, skip earnings, or backtest the wheel.
Related recipes
More learning resources
Related glossary
Related personas
The public page explains the report. Run the official template in TradingFlow for a selected completed market session.
Open Vol surface