The Data Feed: Flow vs Chain
A plain-language map of what data powers TradingFlow and how the three main tools are organized — by data source, time horizon, and level of detail.
TradingFlow has a few different tools, and at first glance they can look like they show the same thing. They don't. Each one is built for a different question. Once you understand the two kinds of data underneath — Flow and Chain — the whole platform clicks into place, and you'll always know which tool to reach for.
This chapter is the map. We won't define every term here (the concept chapters do that) — instead we'll show you how everything fits together.
The Two Kinds of Data
Everything in TradingFlow comes from one of two pictures of the options market:
- Flow — the activity. Individual trades as they happen, and the running totals built from them. Flow answers "what are people doing right now?" Think: a big call buy just printed, money is piling into one name, the tape is leaning bullish.
- Chain — the structure. A snapshot of how options are positioned: how many contracts are outstanding (open interest), the Greeks, and volatility readings. Chain answers "how is this name set up?" Think: where the big walls of open interest sit, the gamma backdrop, how expensive options are.
Some tools blend the two. We call that Hybrid — recent flow shown next to prior structural context, so you see both what's happening and the backdrop it's happening against.
Three Ways to Slice It
Beyond Flow vs Chain, each tool sits somewhere along two more dimensions. Together these three describe what any TradingFlow surface is for.
- Data source — Flow, Chain, or Hybrid (above).
- Time horizon
- Single day — focused on one trading session or date.
- Multi-period — pulls together information across several periods so you can compare.
- Level of detail
- Trade — one individual event (this exact print).
- Contract — one specific option (a single strike and expiry).
- Symbol — rolled all the way up to the underlying stock or ETF.
The level-of-detail dimension is just a zoom level. You can start zoomed all the way in on a single trade and zoom out to the whole name — or the other way around.
The Three Main Tools, Mapped
Here's where each tool lands. This is the part worth bookmarking.
Option Trades — trade-level Flow
Option Trades is the live tape: every individual option trade as it prints, one row each. It's pure Flow at the trade level, and it works in both a live view (today, updating) and a historical view (a past date). This is where you go to validate something — "is this flow real, is it opening, who's the aggressor?"
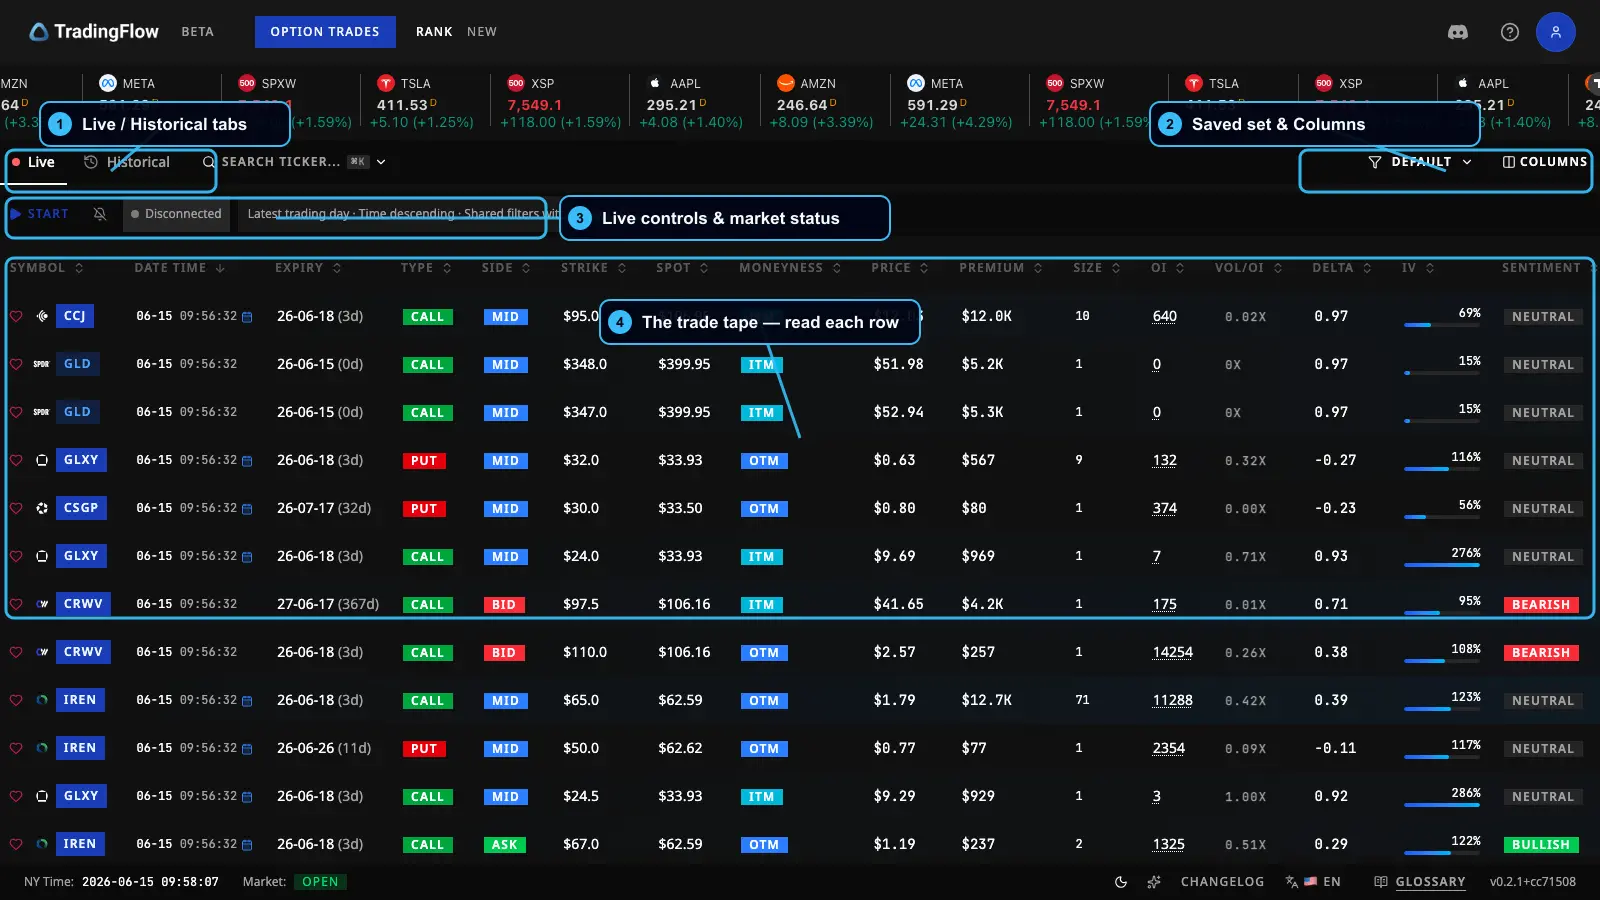 The Option Trades feed — each row is one trade, streaming in live.
Full walkthrough: Option Trades.
Rank Contracts — contract-level Hybrid
Rank Contracts takes a whole day's flow and ranks the standout contracts. It's Hybrid: the ranking is driven by recent flow, but each row also carries prior structural context (open interest, daily volume) so you can judge it. It can also compare across periods, so its horizon leans multi-period.
![]() Rank Contracts — the day's most interesting contracts, ranked, with structure alongside the flow signal.
Rank Contracts — the day's most interesting contracts, ranked, with structure alongside the flow signal.
Full walkthrough: Rank Contracts.
Rank Symbols — symbol-level discovery
Rank Symbols rolls everything up to the underlying name: which stocks and ETFs are seeing the most interesting activity. It's built from the same flow picture as Rank Contracts, but it also folds in Chain structure — the GEX environment, volatility readings, and open-interest context — at the symbol level. So it spans Flow and Chain at the symbol level.
![]() Rank Symbols — a leaderboard of names, with flow signal on the left and structure/volatility on the right.
Rank Symbols — a leaderboard of names, with flow signal on the left and structure/volatility on the right.
Full walkthrough: Rank Symbols.
Heads-up: TradingFlow used to have a separate Option Chain Analysis tool. Its GEX, volatility, and chain features now live inside Rank Symbols (in the symbol detail panel). Old links still work — they just take you to the right place now.
A Quick Reference
| Tool | Data source | Detail level | Horizon | Best for |
|---|---|---|---|---|
| Option Trades | Flow | Trade | Single day (live or historical) | Validating exact activity, reading the tape |
| Rank Contracts | Hybrid | Contract | Multi-period | Finding standout contracts |
| Rank Symbols | Flow + Chain | Symbol | Single day | Discovering which names are active |
One Thing to Keep in Mind: Freshness
This is the most important caveat, and it's simple once you know it.
The activity (Flow) is fresh, but some of the structure (Chain) next to it is the latest available snapshot — not the exact moment of each trade. Figures like open interest and daily volume update on a slower clock than the live trade tape. So when you see a structural number sitting beside a hot trade, read it as "the most recent backdrop," not as a tick-by-tick reading from the instant that trade printed.
TradingFlow always labels this mixed nature so you never misread a ranked list as purely real-time or purely end-of-day. The takeaway for you:
- Use Flow for "what just happened."
- Use Chain for "how is this name positioned," knowing it's a recent snapshot.
- Don't expect a structural figure to match a single trade to the second — it isn't meant to.
What to Do Next
Now that you know the map, start with the live tape: head to Option Trades to see trade-level Flow in action. From there, Rank Contracts and Rank Symbols show you how to zoom out and find the standout activity.