Official template · basic · Flow scanner
Find contracts trading heavily against standing OI.
Answer "what unusual options activity printed today" without tuning a screener first.
The report UI is recreated from the test app's Sep 25, 2026 session, not a live screen. A historical example with music; no narration.
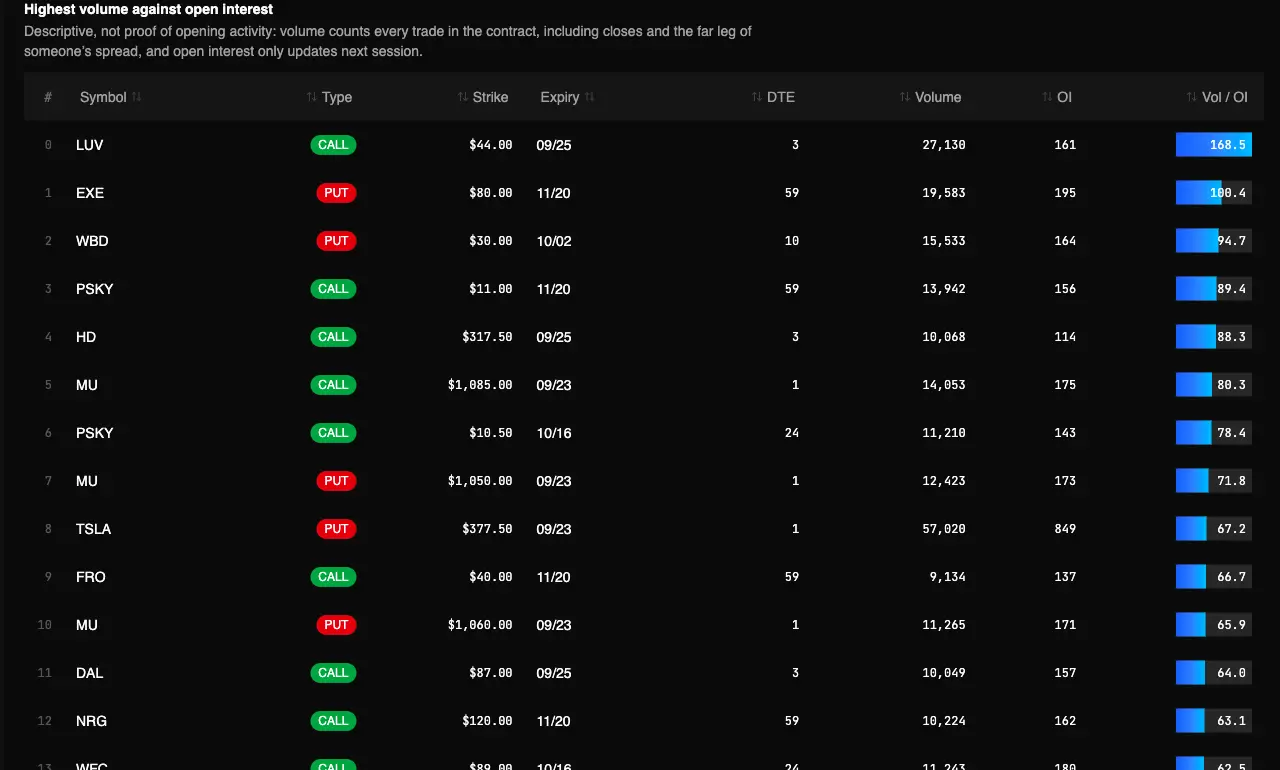
Captured Sep 23, 2026 on testapp.tradingflow.com. This is a historical example; results on this page do not refresh. Swipe across the image to inspect its columns.
- 01Contract volume + OI
- 02Compare session to book
- 03Unusual contracts
Volume over OI does not establish opening activity.
Read the output
- 01Volume-to-open-interest ratio per contract, above sensible liquidity floors.
- 02The standing open interest the ratio is measured against.
- 03Strike, expiry and days to expiry for each contract.
Keep in mind
A high ratio is not proof of opening activity — volume counts closes and the far leg of spreads too.
Explore the concept behind this report
Vol/OI is today’s volume divided by standing open interest, a freshness ratio for screening unusual activity.
How to read it
From report to evidence01
Read the ratio, then the base
A 50× ratio on 120 open interest is a much smaller event than 5× on 40,000.
02
Check the expiry
Near-dated ratios turn over fast. A multi-week contract building volume is a different story.
03
Confirm with the tape
Pre-Move Positioning traces whether the open interest actually persisted across sessions.
Method and limitations
A one-screen Cookbook tool: today’s contracts where volume exceeded standing open interest, ranked by the ratio. Official app template: Unusual Options Activity Today.
What the report computes
- Volume-to-open-interest ratio per contract, above sensible liquidity floors.
- The standing open interest the ratio is measured against.
- Strike, expiry and days to expiry for each contract.
What it does not claim
- A high ratio is not proof of opening activity — volume counts closes and the far leg of spreads too.
- Open interest only updates next session, so the denominator is yesterday’s.
- 0DTE is excluded: on expiry day the denominator no longer means anything.
Shows the standing open interest next to the ratio, so a large multiple on a nearly empty contract reads as the small event it is.
Frequently asked questions
- Why is 0DTE excluded?
- On expiry day the standing open interest is the previous session’s, so the ratio measures churn against a base that no longer exists. A 0DTE contract tops that screen by construction.
- Does unusual activity mean someone knows something?
- No. The ratio is descriptive. Volume includes closing trades and the other leg of someone’s spread, and nothing in the tape identifies the trader or the motive.
Related recipes
- UOA screenerScreen unusual contracts by volume versus the book, not by a vendor’s opaque UOA score.
- OI accumulationSee whether OI actually built after loud prints, instead of trusting a one-session sweep.
- OI lotteryFind cheap deep-OTM contracts that added open interest, without treating them as a UOA score.
More learning resources
The public page explains the report. Run the official template in TradingFlow for a selected completed market session.
Open Unusual activity today