Official template · advanced · Flow scanner
Find names whose options mix changed.
See whose call/put mix shifted versus its own tape, not versus a market-wide 1.0 rule of thumb.
The report UI is recreated from the test app's Sep 25, 2026 session, not a live screen. A historical example with music; no narration.
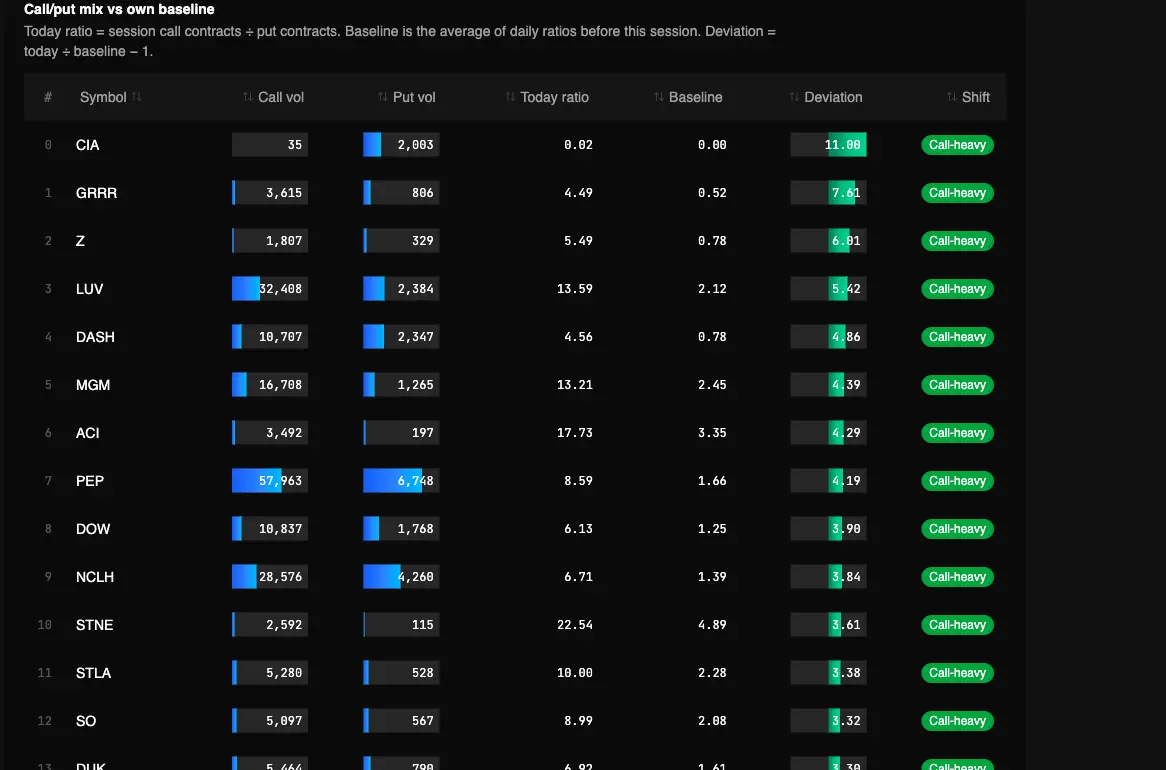
Captured Sep 23, 2026 on testapp.tradingflow.com. This is a historical example; results on this page do not refresh. Swipe across the image to inspect its columns.
- 01Name’s prior sessions
- 02Call / put vs baseline
- 03Mix deviation
This uses call ÷ put contracts, despite the official title.
Read the output
- 01Session call contracts ÷ put contracts (tape size, not OI).
- 02That name’s average daily ratio on sessions strictly before the represented date.
- 03Deviation = today ÷ baseline − 1, labeled call-heavy / put-heavy / in line.
Keep in mind
It is not the UOA volume/OI screen and not the OI lottery screen.
How to read it
From report to evidence01
Run the mix screen
Open Put/Call Ratio Deviation Screener in Cookbooks. Tighten min |deviation| if the board is noisy.
02
Read today versus baseline, not the raw ratio
A 3.0 ratio is ordinary if that name usually prints 2.8. The deviation column is the job.
03
Handoff to UOA or tape if you act
Unusual mix plus unusual volume/OI is two facts. This recipe only has the mix.
Method and limitations
A paid Cookbook that compares each single name’s session call/put contract ratio to that same name’s average daily ratio on prior sessions. Names without enough history are omitted, not padded. Official app template: Put/Call Ratio Deviation Screener.
What the report computes
- Session call contracts ÷ put contracts (tape size, not OI).
- That name’s average daily ratio on sessions strictly before the represented date.
- Deviation = today ÷ baseline − 1, labeled call-heavy / put-heavy / in line.
What it does not claim
- It is not the UOA volume/OI screen and not the OI lottery screen.
- A high ratio is not “bullish” unless it is high versus that name’s own history.
- Mix is not opening status, a trader identity, or a forecast.
Deviation is today (call size ÷ put size) divided by that symbol’s own average daily ratio on prior sessions, minus one — not versus a market-wide 1.0.
Frequently asked questions
- Is a high call/put ratio a buy signal?
- No. This screen only flags a mix that is far from that name’s own baseline. It does not say the next session goes up.
- Why was a name omitted?
- Not enough completed sessions in the baseline window, or put volume was zero (ratio undefined). That is unavailable, not a 1.0.
Related recipes
More learning resources
Related glossary
Related personas
The public page explains the report. Run the official template in TradingFlow for a selected completed market session.
Open P/C deviation