Official template · advanced · Option flow
See the session’s option premium breadth.
See whether the whole session’s option premium leaned one way without assembling Rank by hand.
The report UI is recreated from the test app's Sep 25, 2026 session, not a live screen. A historical example with music; no narration.
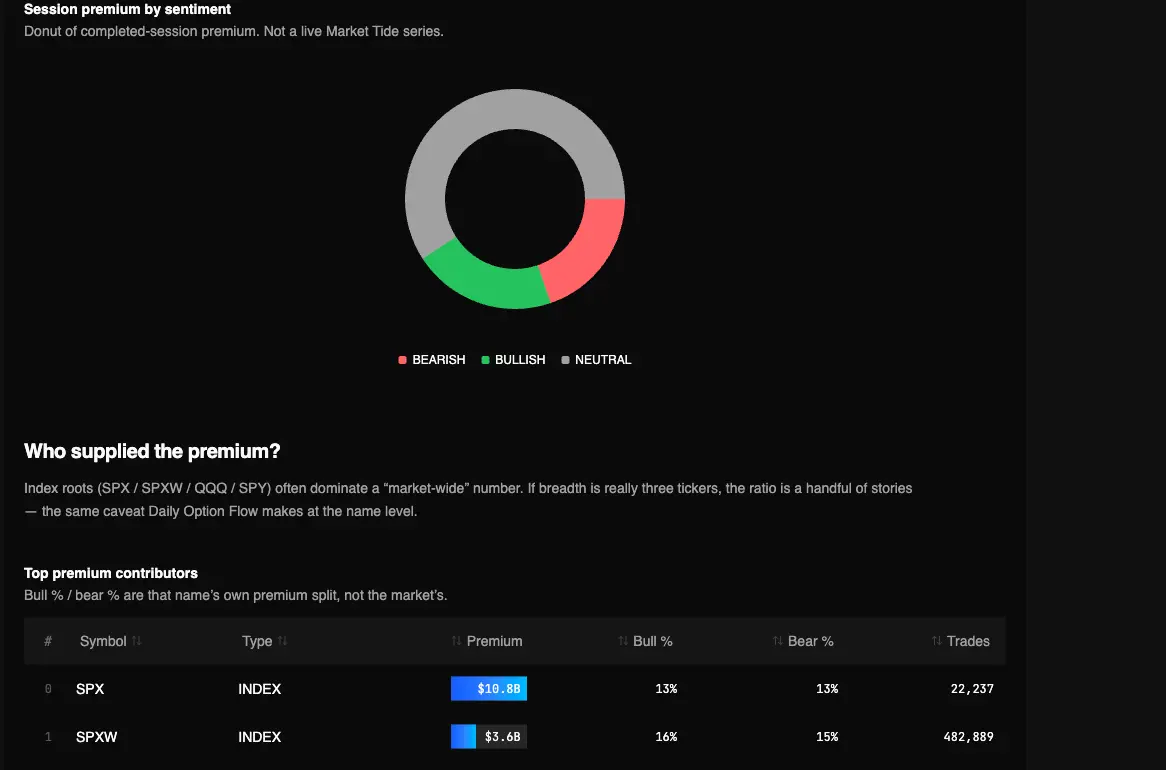
Captured Sep 23, 2026 on testapp.tradingflow.com. This is a historical example; results on this page do not refresh. Swipe across the image to inspect its columns.
- 01Session premium
- 02Classify sentiment
- 03Breadth + contributors
Neutral is a distinct category; this is not a live tide chart.
Read the output
- 01Session premium split by sentiment (bullish / bearish / neutral) across every symbol.
- 02Breadth ratio = bullish-classified premium ÷ bearish-classified premium.
- 03Top premium contributors with each name’s own bull/bear split.
Keep in mind
It is not Unusual Whales Market Tide: no SPY overlay, no intraday series.
How to read it
From report to evidence01
Run breadth
Open Market-Wide Flow Breadth in Cookbooks for the latest completed session.
02
Read the ratio, then who supplied it
A ratio near 1 with a large neutral share is a two-sided tape. If three index roots dominate the contributor table, the “market” is those stories.
03
Handoff to the tape for names you care about
Daily Option Flow still lists tickets. This report is the session total, not the prints.
Method and limitations
A paid Cookbook that collapses the completed session’s option premium into one breadth read: bullish / bearish / neutral shares, a bull÷bear ratio, and the top contributing names. Direction comes from sentiment, not the sign of DEX. Official app template: Market-Wide Flow Breadth.
What the report computes
- Session premium split by sentiment (bullish / bearish / neutral) across every symbol.
- Breadth ratio = bullish-classified premium ÷ bearish-classified premium.
- Top premium contributors with each name’s own bull/bear split.
What it does not claim
- It is not Unusual Whales Market Tide: no SPY overlay, no intraday series.
- Sentiment is print classification, not dealer inventory.
- Trade-grain DEX is unsigned size here; direction is not read from the sign of DEX.
Breadth ratio is bullish-classified premium ÷ bearish-classified premium across the whole tape; DEX stays an unsigned magnitude and is not used as a signed tilt.
Frequently asked questions
- Is this a live Market Tide chart?
- No. It is one completed session’s premium split. There is no SPY overlay and no intraday tide series.
- Does a ratio above 1 mean the market is bullish?
- It means more premium classified bullish than bearish on that session. It is not a forecast and not dealer positioning.
Related recipes
More learning resources
Related glossary
Related personas
The public page explains the report. Run the official template in TradingFlow for a selected completed market session.
Open Flow breadth