What Is Option Flow? Options Flow, Scanners, Side, Sentiment & DEX
What is option flow (options flow)? Live tape, scanners, aggressive side, sentiment, moneyness, DEX, Vol/OI, and how to spot unusual options activity in TradingFlow.
What Is Option Flow?
Option flow (often written options flow) is the stream of live or historical options trades—each print with contract, size, premium, side, and timing—so you can see where money is actually trading, not only where the stock closed. An options flow scanner ranks and filters the loud prints first; TradingFlow does that with Rank plus the Option Trades tape. Traders use option flow to spot large prints, aggressive buying or selling, and builds in premium. Unusual options activity is the subset that stands out on size, premium, or Vol/OI—not a separate market.
Deep dives: What is option flow?, What is UOA?, aggressor side, 0DTE, moneyness, best options flow scanners, best UOA scanners. One-line definitions: Option Flow Glossary. Searchable hub: Options glossary.
You don't need a finance background. Read it once to get the big ideas, then keep it open as a cheat sheet while you watch Option Trades or scan Rank Contracts.
Options in 60 seconds
An option is a contract that gives the buyer the right (not the obligation) to buy or sell a stock at a set price before a set date. Every option trade you see in TradingFlow is described by a handful of fields:
- Call — the right to buy the stock at the strike price. People buy calls when they expect the price to go up.
- Put — the right to sell the stock at the strike price. People buy puts when they expect the price to go down (or want protection).
- Strike — the agreed price at which the option can be exercised.
- Expiration (expiry) — the date the contract expires. Closer expiries are more of a short-term bet; further-out expiries are longer-term.
- Size — how many contracts changed hands in the trade. One contract usually represents 100 shares.
- Premium — the total dollars that moved in the trade. Roughly: price per contract x size x 100. Big premium = big money on the table, which is what most traders watch for.
That's enough to read a single row. The rest of this page is about reading intent — who was the aggressor, and what they were betting on.
Bid / Ask and what "aggressive" means
Every option has two live prices at any moment:
- Bid — the highest price buyers are currently willing to pay.
- Ask — the lowest price sellers are currently willing to accept.
The gap between them is the spread. Where a trade actually prints inside (or outside) that spread tells you who was in a hurry — and that's the single most important clue in flow reading.
- A buyer who pays at the ask is "crossing the spread" to get filled right now. That's an aggressive buyer — they wanted in badly enough to pay up.
- A seller who accepts the bid is "hitting the bid" to get out right now. That's an aggressive seller.
- A trade in the middle could be either side, so we treat it as neutral.
TradingFlow labels this as the trade's side:
| Side | Where it printed | What it suggests |
|---|---|---|
| Above Ask | Above the ask | Very aggressive buyer — strong conviction |
| At Ask | At the ask | Aggressive buyer — willing to pay up |
| Mid | Between bid and ask | Neutral — could be either party |
| At Bid | At the bid | Aggressive seller |
| Below Bid | Below the bid | Very aggressive seller — eager to exit |
The key idea: at-ask-or-above = the buyer was the aggressor; at-bid-or-below = the seller was the aggressor. There's no literal "buy" or "sell" flag in the market data, so TradingFlow infers the aggressor from where the trade printed.
Sentiment: bullish, bearish, or neutral
Now combine two things you already know — whether it's a call or put, and who was the aggressor (side) — and you get sentiment: a quick read on whether the trade leans bullish (betting up), bearish (betting down), or neutral.
The logic is simple once you see it laid out:
From print to sentimentRead each cell: call-or-put crossed with buy-at-ask or sell-at-bid routes the print onto a bullish, bearish, or neutral platform.
In words:
- Buying calls aggressively = betting the stock goes up = bullish.
- Buying puts aggressively = betting the stock goes down = bearish.
- Selling calls leans bearish; selling puts leans bullish (the seller is comfortable with the opposite outcome).
- Mid-market trades are neutral.
Sentiment is a helpful shorthand, not gospel — a single trade can be a hedge, a spread leg, or a roll. It's most useful in aggregate: lots of bullish premium piling into the same name is a louder signal than any one print.
For beginners, write this rule in your notes: side plus option type gives a likely sentiment, not a guaranteed intention. A bullish call print can still be part of a hedge or spread. That is why the workflow always comes back to size, repetition, Vol/OI, OI confirmation, and event context.
Moneyness: ITM, ATM, OTM
Moneyness describes where the strike sits relative to the current stock price. It tells you how aggressive or speculative a bet is.
- In the Money (ITM) — the option already has real exercise value. For a call, the strike is below the stock price; for a put, above. More expensive, more like owning the stock.
- At the Money (ATM) — the strike is right around the current price. Most sensitive to near-term moves.
- Out of the Money (OTM) — the strike is beyond the current price (call strike above price, put strike below). Cheaper, more speculative, bigger payoff if it works. Heavy OTM buying often signals a strong directional bet on a move.
Seeing it in the table
All of these fields live side by side in the Option Trades table:
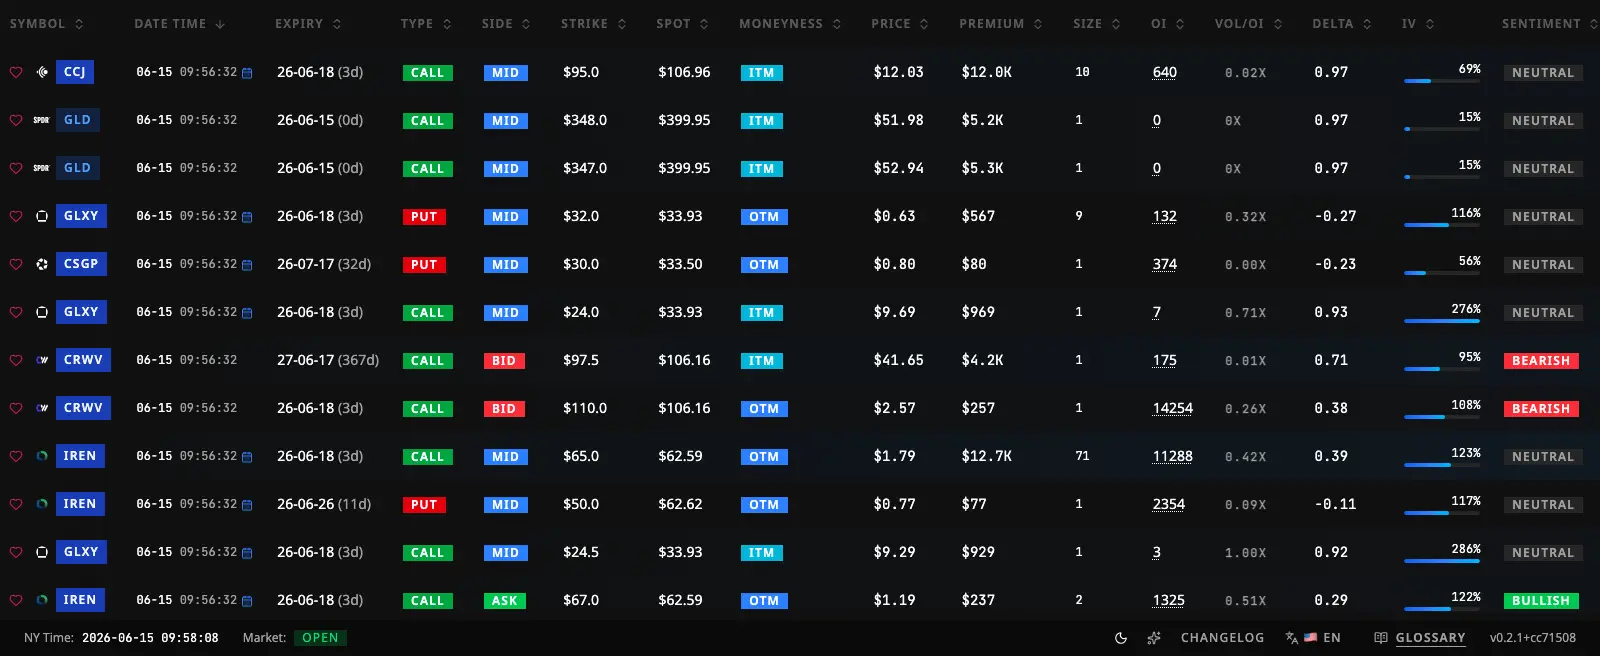
Each row is one trade: read Type (call/put) + Side together to understand the Sentiment shown on the right.
DEX and DEI: directional money, at a glance
Two metrics summarize how much directional exposure is behind the flow. You do not need advanced math, but the simple formula helps avoid a wrong mental model.
- DEX (Delta Exposure) — in TradingFlow's stored trade data, this is
delta × size. It converts the option trade into a directional exposure measure. Positive values lean bullish; negative values lean bearish. - DEI (Delta Impact) — DEX scaled by the underlying's typical stock volume. It asks: "is this directional exposure large for this name?" That is why DEI helps compare a small-cap and a mega-cap fairly.
Example: a trade with 500 DEX in a thinly traded name can matter more than 500 DEX in a mega-cap, because the same exposure is a larger share of normal liquidity. Both metrics build on delta, one of the option Greeks. For a dedicated walkthrough, read Delta Exposure (DEX); for the full picture of delta, gamma, and how dealer positioning can pin or accelerate a stock, see Greeks & GEX.
Vol/OI: the unusualness signal
Two numbers tell you whether a contract is seeing real, fresh interest:
- Volume (Vol) — how many contracts traded today.
- Open Interest (OI) — how many contracts are already open (held overnight from prior days).
The ratio Vol / OI is one of the fastest ways to spot something new happening:
- Vol/OI around or below 1 — today's activity fits within positions that already existed. Routine.
- Vol/OI well above 1 — today's volume dwarfs what was open before, meaning new positions are being opened. That's a flag worth a closer look.
A deeper look at OI, how it builds over days, and what rising-OI-plus-rising-volume means lives in Option Chain & OI.
What makes a trade "unusual" — and "smart money"
Unusual options activity (UOA) simply means an option (or a whole stock's options) is trading far more than normal. "Smart money" is the informal label for large, conviction-sized flow that often comes from institutions. None of it is a guarantee — it's a way to focus your attention on where real money is moving.
A trade tends to stand out when several of these line up:
What makes a trade "unusual"?A scorecard, not a single flag: large premium, high Vol/OI, an aggressive side, clear sentiment, and an OTM strike all converge on one verdict.
A practical rule of thumb:
- A few very large trades (block trades) often point to institutional conviction — that's the flow most traders care about.
- Many tiny trades are more often retail or market-maker activity and carry less directional signal.
- The strongest setups stack signals: big premium + high Vol/OI + aggressive side + one-directional sentiment.
What a row can and cannot prove:
| A row can show | A row cannot prove by itself |
|---|---|
| What contract traded, when, and at what price. | Whether the trader's whole portfolio is bullish or bearish. |
| Whether the print was aggressive at ask or bid. | Whether the trade opened a new position before OI confirms. |
| Whether the size is unusual for that contract. | Whether the stock must move in the same direction. |
| Whether the flow is worth investigating. | Whether you should enter a trade without risk controls. |
You don't have to weigh these by hand. TradingFlow surfaces the standouts for you in Rank Contracts (the loudest individual contracts) and on the live Option Trades feed.
FAQ: Option Flow Questions
What is option flow in trading?
Option flow (also options flow) is the time-and-sales of options contracts: who paid (aggressor side), how large, which strikes and expiries, and whether the print looks unusual versus open interest. Canonical lander: What is option flow?.
Is option flow the same as options flow?
Yes in practice—both names describe the same live (or historical) options tape used by flow scanners and desks.
What is an options flow scanner?
A scanner ranks and filters unusual prints by premium, side, trade type, and DTE so you do not watch every tick. In TradingFlow: Rank shortlists + Option Trades. Compare tools: best options flow scanners.
Is option flow the same as unusual options activity?
Related but not identical. Option flow is the full tape. Unusual options activity is the subset that stands out on size, premium, Vol/OI, or repetition. See What is UOA?.
How do I read option flow in TradingFlow?
Start on the Option Trades feed for prints, use Rank Contracts for the loudest contracts, then confirm structure with call/put walls and OI.
Where is the glossary?
Options glossary and Option Flow Glossary — short definitions with links back to full chapters.
What to do next
Now that the vocabulary makes sense, go watch it live. Open Option Trades to see side, moneyness, and sentiment update in real time, then jump to the ranked standouts in Rank Contracts.
To go deeper on the metrics, continue to Greeks & GEX, and to understand open interest in depth, read Option Chain & OI.
See real-time option flow and unusual activity in TradingFlow